


US Midterm Fallout: What Does the “Blue Tsunami” Mean for the S&P 500?
Democrats made sweeping gains in the US midterm elections, winning control of both the House and Senate - what does it mean for the S&P 500 and the AI trade?
Share this:

US MIDTERM KEY TAKEAWAYS:
- Democrats made sweeping gains in the US midterm elections, winning control of both the House and Senate.
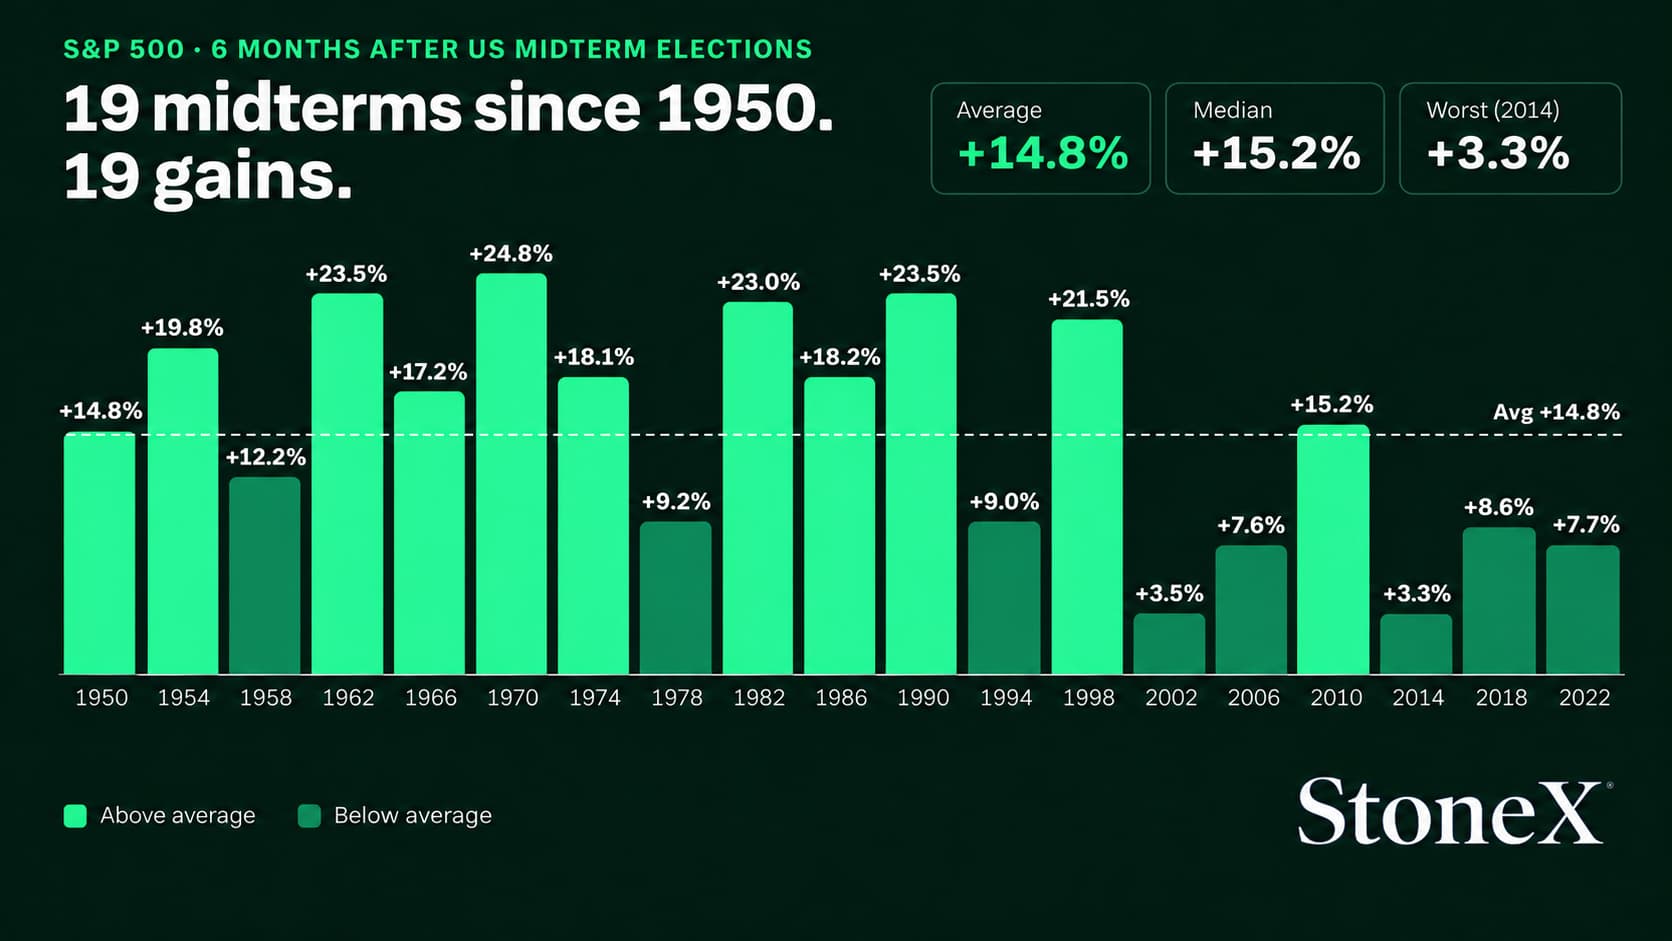
- The broad US stock market has historically returned and average of roughly +15% in the half year following a mid-term election.
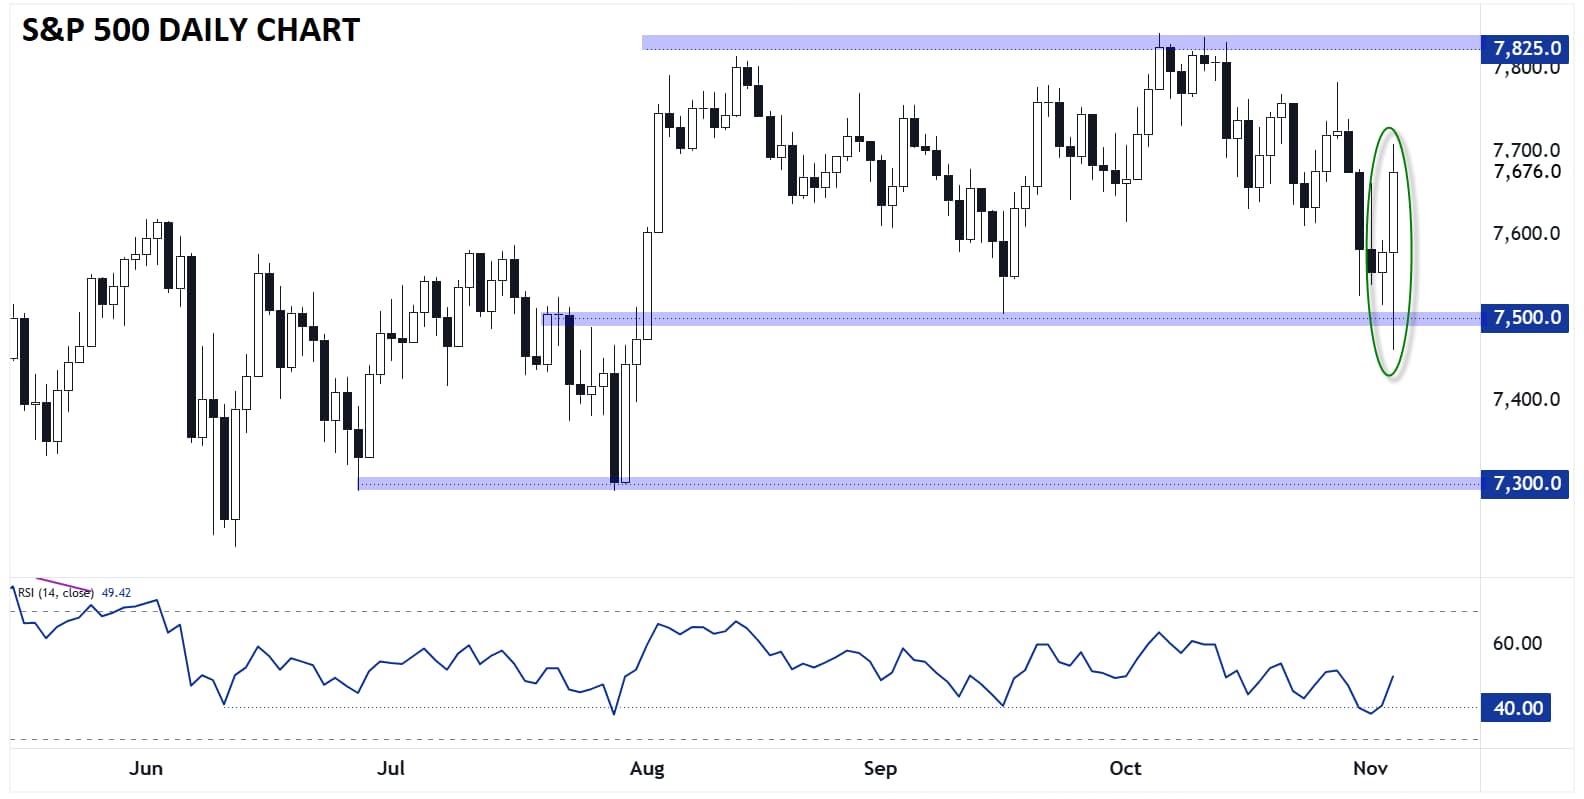
- For S&P 500 bulls, the next zone to watch will be around the late summer (and all-time record) highs in the 7,825 area.
US Midterm Election Recap
As you’ve no doubt heard by now, Democrats made sweeping gains in the US midterm elections, winning control of both the House and Senate and ending Republicans’ unified hold on Washington. The party flipped at least seven Senate seats, with notable victories in Texas, Ohio, Iowa, Kansas, North Carolina, South Carolina and Maine.
In the House, Democrats captured a majority by flipping more than two dozen districts, including seats in states that backed Donald Trump in 2024. Democrats also won several key gubernatorial races, including in Georgia, Ohio, Iowa and Texas.
For political analysts, the results marked a sharp setback for Trump and the Republican Party. Voters cited high living costs, dissatisfaction with the administration and a desire for stronger congressional checks on presidential power.
US Midterm Election: Stock Market Impact
For traders, the implications are more nuanced. Perhaps most importantly for traders, the election results are unambiguous, and President Trump has already publicly declared that he is “absolutely willing to accept the results;” this outcome removes a tail risk of a contested or disputed result that could extend uncertainty, and we’re accordingly seeing measures of implied volatility falling across markets.
Underscoring this theme, the chart below shows the historical performance of the S&P 500 in the six months following each US midterm election since 1950:
Source: StoneX. Past performance is not indicative of future results.
As you can see, the broad US stock market has historically returned and average of roughly +15% in the half year following a mid-term election, well above the full historical sample of 6-month returns.
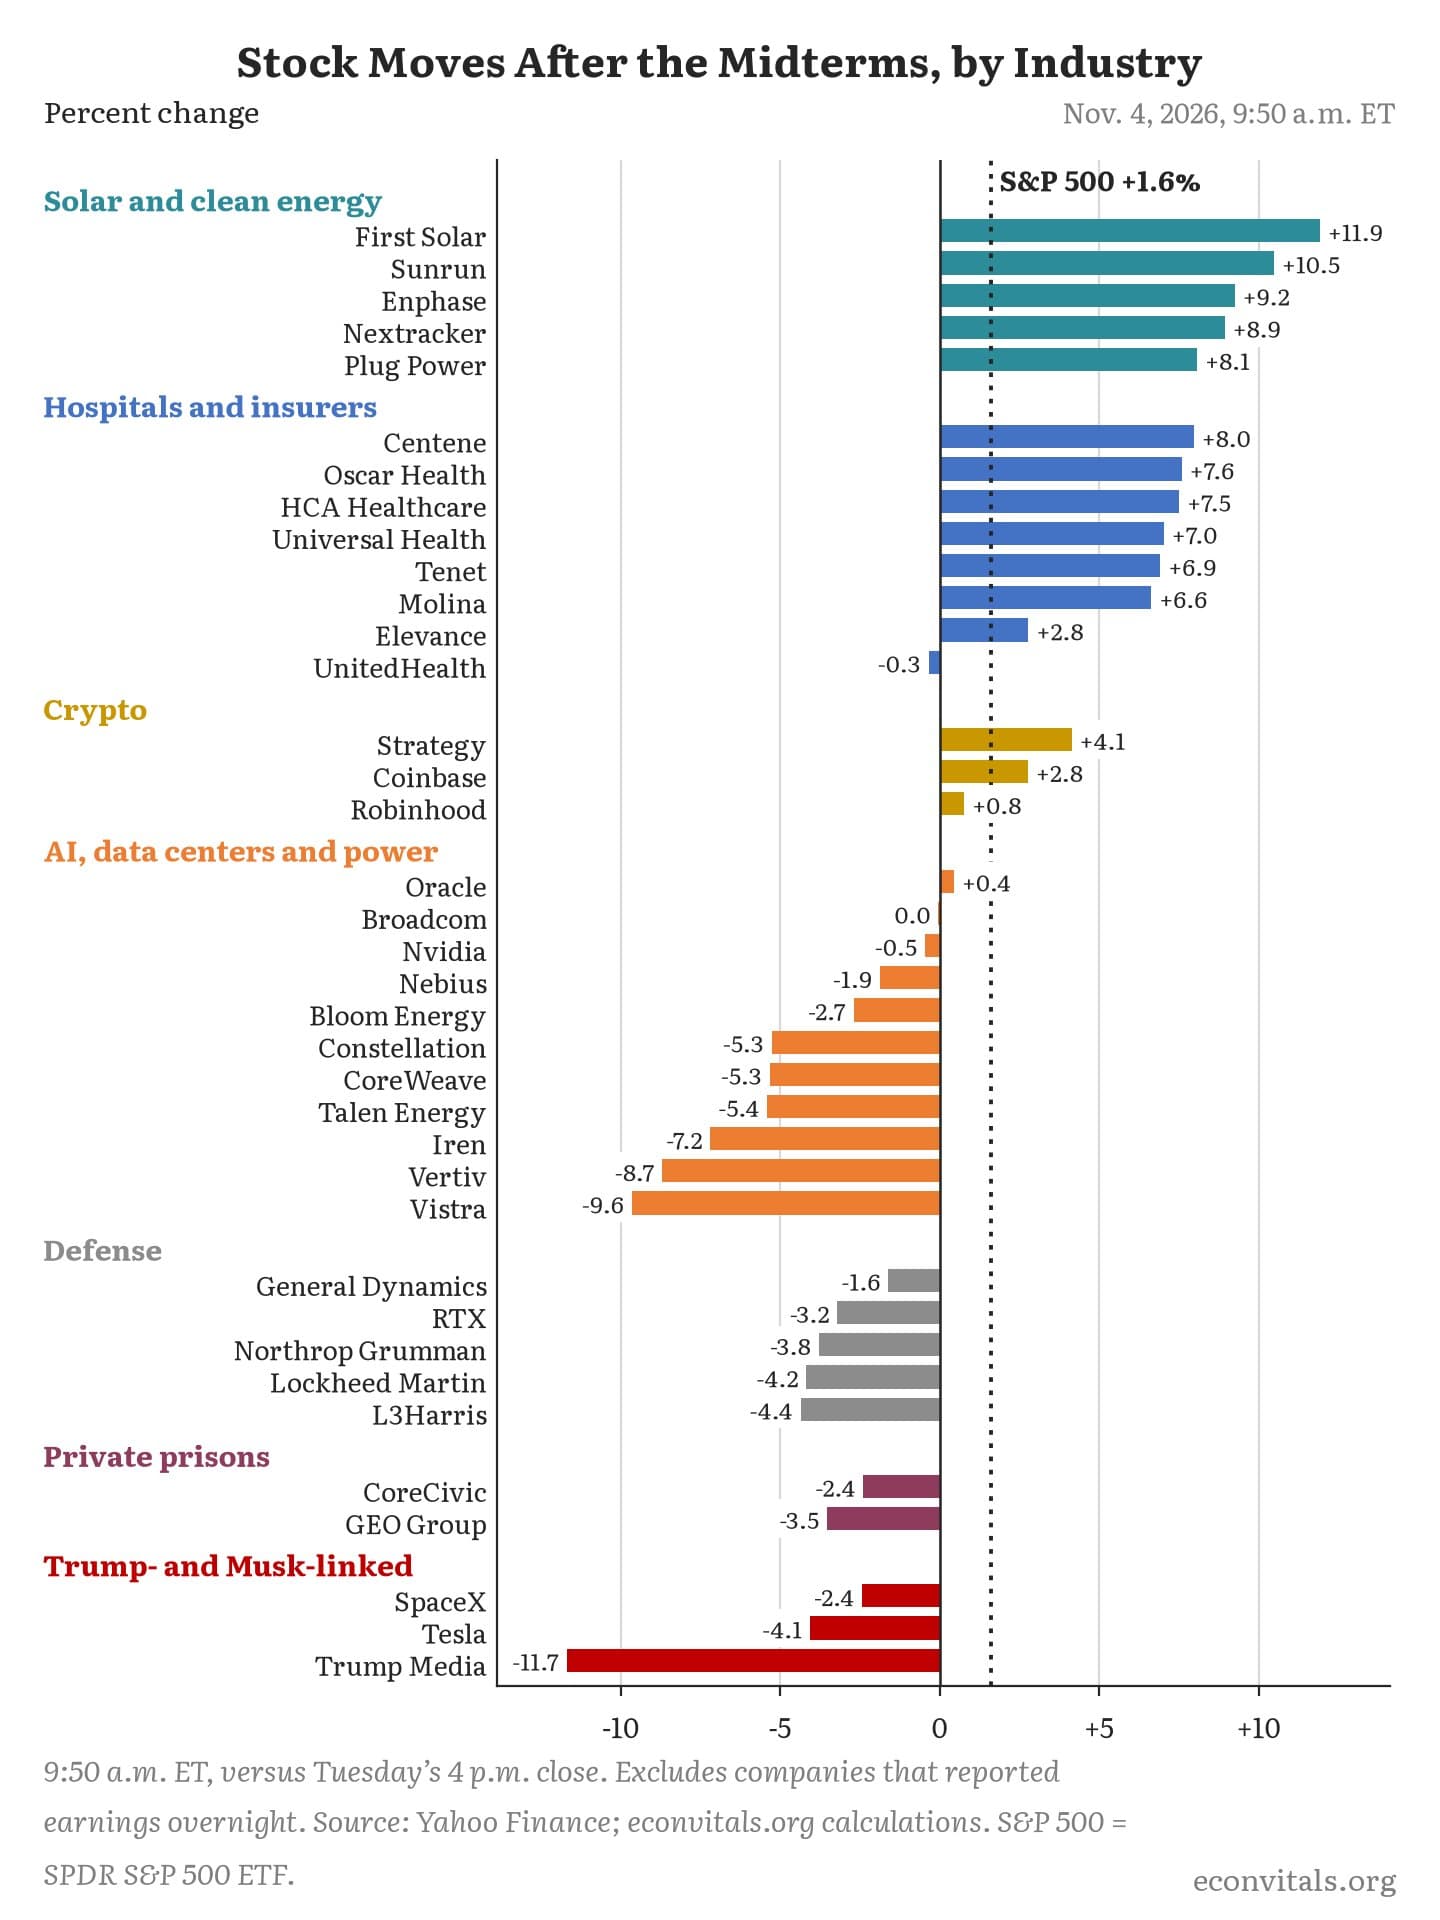
However, there are still some reasons for caution. Fears of a potential government shutdown over funding disagreements, the ongoing war with Iran, and pushback against AI datacenters are all significant risks to monitor in the coming months. In particular, datacenters were a big loser from the election: 44 of 45 datacenter-related initiatives lost, often with 70-90% opposition. A slowdown in datacenter development could hurt the broader “AI trade” that has driven markets sharply higher in the past couple of years. Investors are already starting to price in that possibility, though it remains to be seen whether the current negative sentiment will ultimately impact policy:
Source: Yahoo Finance, EconVitals
Despite today’s AI stumble, broader US indices are trading higher on the positive seasonals and removal of uncertainty; time will tell if bulls’ festive mood carries through the holidays.
S&P 500 Technical Analysis – SPX Daily Chart
Source: TradingView, StoneX
After an overnight swoon, the S&P 500 is showing a potential bullish engulfing candle on the daily chart. For the uninitiated, a Bullish Engulfing candle is formed when the candle breaks below the low of the previous day before buyers step in and push rates up to close above the high of the previous day. It indicates that the buyers have wrested control of the market from the sellers and shows potential for more upside in the coming days.
For bulls, the next zone to watch will be around the late summer (and all-time record) highs in the 7,825 area, whereas a break below the election lows near 7,500 would call the bullish bias into question and potentially expose 7,300 to the downside.
-- Written by Matt Weller, Global Head of Research
Check out Matt’s Daily Market Update videos on YouTube and be sure to follow Matt on Twitter: @MWellerFX
Latest market news


Open an account in minutes
Experience award-winning platforms with fast and secure execution, and enjoy tight spreads from 0.5 pts on FX and 0.3 pts on indices.
Economic calendar
Web Trader platform
Our sophisticated web-based platform is packed with features.
Related articles
US Midterm Fallout: What Does the “Blue Tsunami” Mean for the S&P 500?
Democrats made sweeping gains in the US midterm elections, winning control of both the House and Senate - what does it mean for the S&P 500 and the AI trade?
Euro Technical Outlook: EUR/USD Support Reversal Sets Up Breakout Test Ahead of NFP 11 4 2026
Euro bulls are attempting to build on the rebound from recent lows, but pivotal resistance still stands in the way of a larger EUR/USD recovery.


Crude Oil Prices Fall, What the U.S. Midterms Mean for Brent
Crude oil prices have pulled back more than 11% from October highs, in line with U.S.-Iran negotiation hopes and shifting U.S. midterm expectations.

This report is intended for general circulation only. It should not be construed as a recommendation, or an offer (or solicitation of an offer) to buy or sell any financial products. The information provided does not take into account your specific investment objectives, financial situation or particular needs. Before you act on any recommendation that may be contained in this report, independent advice ought to be sought from a financial adviser regarding the suitability of the investment product, taking into account your specific investment objectives, financial situation or particular needs.
StoneX Financial Pte. Ltd., may distribute reports produced by its respective foreign entities or affiliates within the StoneX group of companies or third parties pursuant to an arrangement under Regulation 32C of the Financial Advisers Regulations. Where the report is distributed to a person in Singapore who is not an accredited investor, expert investor or an institutional investor (as defined in the Securities Futures Act), StoneX Financial Pte. Ltd. accepts legal responsibility to such persons for the contents of the report only to the extent required by law. Singapore recipients should contact StoneX Financial Pte. Ltd. at 6826 9988 for matters arising from, or in connection with the report.
In the case of all other recipients of this report, to the extent permitted by applicable laws and regulations neither StoneX Financial Pte. Ltd. nor its associated companies will be responsible or liable for any loss or damage incurred arising out of, or in connection with, any use of the information contained in this report and all such liability is hereby expressly disclaimed. No representation or warranty is made, express or implied, that the content of this report is complete or accurate.
StoneX Financial Pte. Ltd. is not under any obligation to update this report.
Trading CFDs carries a high level of risk that may not be suitable for some investors. Consider your investment objectives, level of experience, financial resources, risk appetite and other relevant circumstances carefully. The possibility exists that you could lose some or all of your investments, including your initial deposits. If in doubt, please seek independent expert advice. Visit www.forex.com/en-sg/terms-and-policies for the complete Risk Disclosure Statement.