



Australian dollar tumbles as unemployment jumps to 2021 highs
The Australian labour market is cracking, with a sharp jump in unemployment and weak full-time jobs data driving a repricing of RBA rate cut expectations. The Aussie dollar and yields are sinking, while key support zones are coming under threat in AUD/USD and AUD/NZD.
Share this:

- Aussie unemployment hits 4.3%, highest since late 2021
- Full-time jobs slump, hours worked fall sharply
- RBA rate cut priced with 95% probability for August
- AUD/USD, AUD/NZD test key support after jobs miss
Summary
Australia’s unemployment rate jumped unexpectedly to the highest level since late 2021 in June, keeping the prospect of a RBA rate cut on the table when it next meets in August. The news sent Australian bond yields and the Aussie dollar sharply lower, reflecting the belief the data may prompt the RBA to focus beyond inflation to what’s now clear weakening in the domestic labour market.
Australian unemployment jumps sharply

Source: ABS
Australia’s labour market showed further signs of softening in June, with the unemployment rate lifting to 4.3%—the highest level since November 2021 and above the 4.2% average rate the RBA forecast for Q2. While total employment rose by a modest 2,000 people, it masked a concerning shift beneath the surface with 40,000 part-time jobs added but 38,000 full-time roles lost. The participation rate edged up to 67.1%. Hours worked also fell by 0.9%, driven by a decline in full-time hours, reinforcing the message that labour market conditions are cooling.
Underutilisation also ticked higher, rising to 10.3% as the underemployment rate increased to 6.0%. For context, underemployment captures those working fewer hours than they’d prefer, while the underutilisation rate combines this with those actively seeking work. Despite the monthly lift, both remain well below their pandemic-era peaks. Still, with job creation stalling and the quality of employment deteriorating, it’s clear the labour market is losing steam.
Increasing RBA rate cut probability
Source: Bloomberg
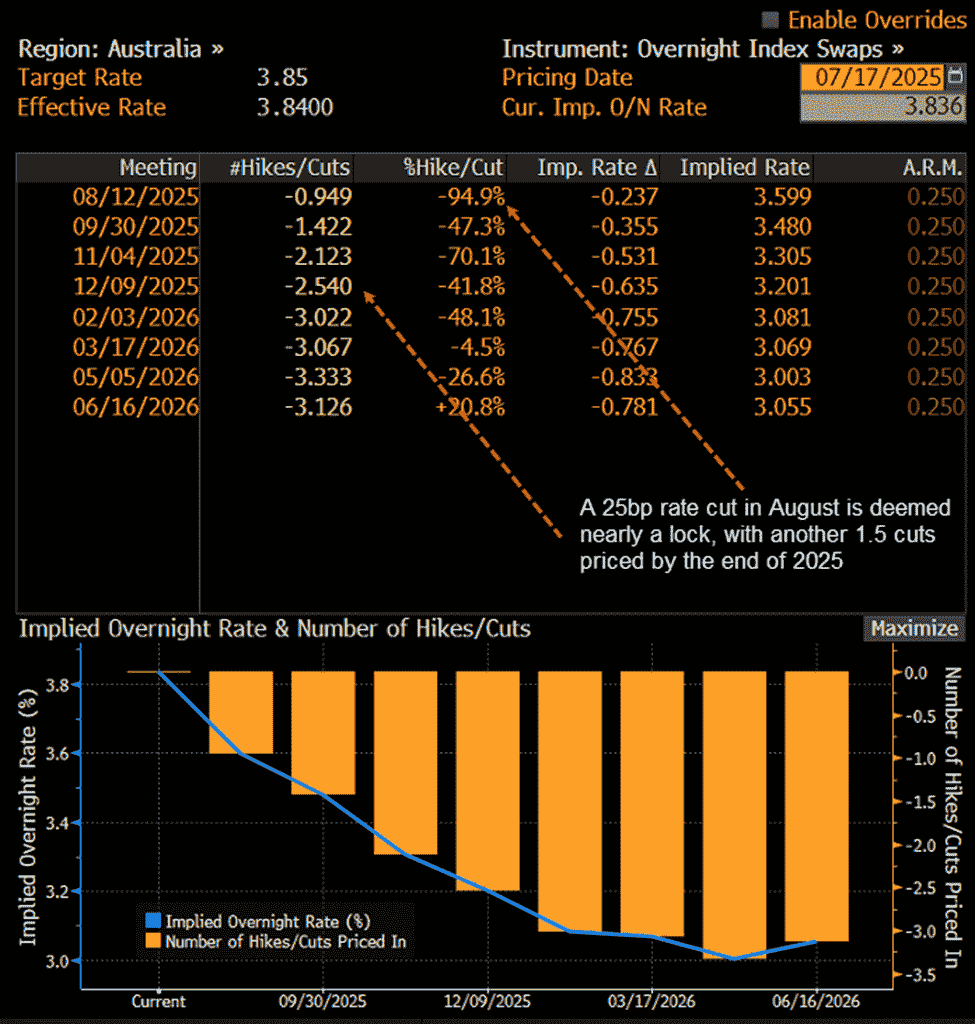
The data saw rates traders add to pricing for an August 12 RBA rate cut, with the implied probability now sitting at 95% for a 25 basis point move. Looking further ahead, another cut is fully priced by November with a third by December deemed a coin flip.
AUD sinks against USD, NZD
With interest rate differentials moving against it, the Aussie dollar slumped against both the U.S. dollar and Kiwi following the data.
Source: TradingView
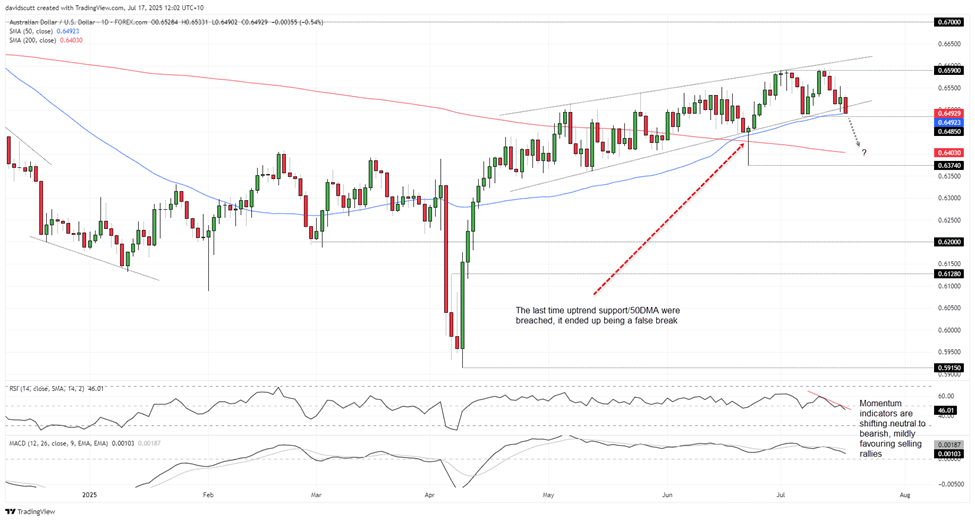
AUD/USD finds itself trading beneath channel support, testing the important 50-day moving average. As seen following the false break of both levels on June 23, price action over the remainder of the session may be instructive as to where longer-term directional risks for the Aussie may lie.
If the price can break and close beneath both the 50-day moving average and July 7 low of .6485, it may act as a catalyst to spark a deeper unwind towards the 200-day moving average located just above .6400. With RSI (14) sitting below 50 and with MACD now below the signal line and trending towards negative territory, the momentum picture is shifting neutral to slightly bearish, increasing the risk of a trend change.
Alternatively, if the price bounces off the 50-day moving average and reclaims channel support, it would put .6550 on the radar considering that’s where the pair stalled in the prior two sessions.
Source: TradingView
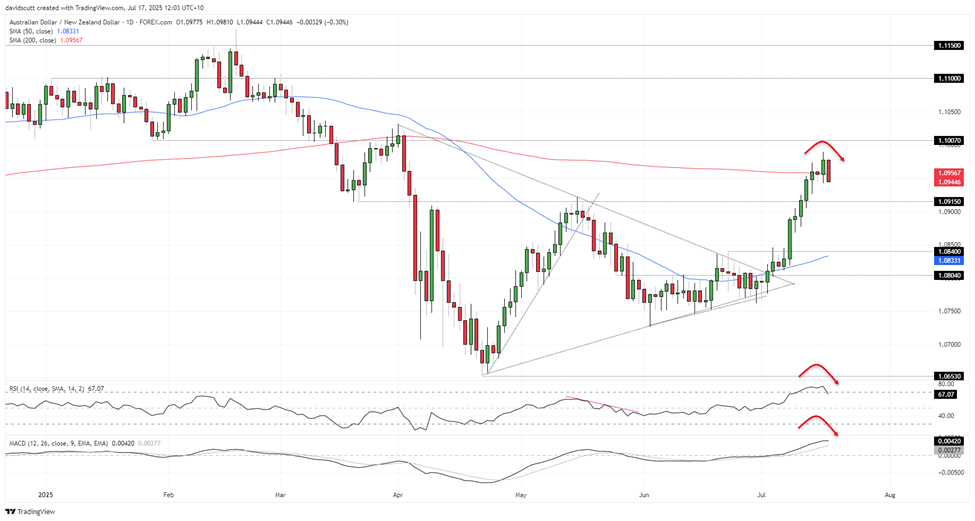
AUD/NZD is another pair to keep an eye on in the wake of the data, putting in a potential topping signal from a known resistance level. As things stand, we’re looking at a bearish engulfing candle should the price finish the session at or below these levels. Coming from above the 200-day moving average—a level the pair struggled at earlier this year—such a signal would likely add to the risk of a more meaningful reversal.
AUD/NZD attracted bids beneath 1.0950 earlier this week, so the near-term price action may be instructive. If the price can take out Wednesday’s low, 1.0915 is a level to watch on the downside. If it were to buckle, 1.08400 would be the next target for shorts.
While the momentum picture remains bullish, both RSI (14) and MACD have either curled or are curling over, indicating waning topside momentum.

Open an account in minutes
Experience award-winning platforms with fast and secure execution, and enjoy tight spreads from 0.5 pts on FX and 0.3 pts on indices.
Economic calendar
Web Trader platform
Our sophisticated web-based platform is packed with features.
Related articles

USD/JPY bulls back in business as AI trade roars back
The AI investment boom rolls on, with Anthropic and Meta helping revive enthusiasm across Wall Street. USD/JPY has responded with a bullish reversal pattern, putting its former trading range back in focus ahead of major central bank decisions and technology earnings.

Fed, DXY, EUR/USD, GBP/USD, USD/CAD, Gold Weekly Technical Outlook 10 26 2026
Sr. Technical Strategist Michael Boutros highlights the levels that matter on the USD Majors, commodities, and equity indices charts this week.


EUR/USD Update: Euro Weakness Returns Ahead of Central Bank Decisions
A new trading week is underway and the euro continues to show signs of weakness in the short term. This can be seen in the recent performance of EUR/USD, which has fallen nearly 0.5% over the last three trading sessions, reflecting a relatively consistent loss of momentum in the European currency.
This report is intended for general circulation only. It should not be construed as a recommendation, or an offer (or solicitation of an offer) to buy or sell any financial products. The information provided does not take into account your specific investment objectives, financial situation or particular needs. Before you act on any recommendation that may be contained in this report, independent advice ought to be sought from a financial adviser regarding the suitability of the investment product, taking into account your specific investment objectives, financial situation or particular needs.
StoneX Financial Pte. Ltd., may distribute reports produced by its respective foreign entities or affiliates within the StoneX group of companies or third parties pursuant to an arrangement under Regulation 32C of the Financial Advisers Regulations. Where the report is distributed to a person in Singapore who is not an accredited investor, expert investor or an institutional investor (as defined in the Securities Futures Act), StoneX Financial Pte. Ltd. accepts legal responsibility to such persons for the contents of the report only to the extent required by law. Singapore recipients should contact StoneX Financial Pte. Ltd. at 6826 9988 for matters arising from, or in connection with the report.
In the case of all other recipients of this report, to the extent permitted by applicable laws and regulations neither StoneX Financial Pte. Ltd. nor its associated companies will be responsible or liable for any loss or damage incurred arising out of, or in connection with, any use of the information contained in this report and all such liability is hereby expressly disclaimed. No representation or warranty is made, express or implied, that the content of this report is complete or accurate.
StoneX Financial Pte. Ltd. is not under any obligation to update this report.
Trading CFDs carries a high level of risk that may not be suitable for some investors. Consider your investment objectives, level of experience, financial resources, risk appetite and other relevant circumstances carefully. The possibility exists that you could lose some or all of your investments, including your initial deposits. If in doubt, please seek independent expert advice. Visit www.forex.com/en-sg/terms-and-policies for the complete Risk Disclosure Statement.