



British Pound Price Action Setups: GBP/USD, GBP/JPY, EUR/GBP
It’s a big week for the British Pound, along with the USD, JPY and Euro, as each economy has a central bank rate decision and two of those banks may be looking to hike rates in the coming months.
Share this:


In early April I looked at the British Pound as compared to the Euro, saying that I though Cable looked like a cleaner backdrop for USD-weakness than what had shown in EUR/USD. At the base of that thesis was the EUR/GBP cross pair, which had just made a trip up to a resistance area linked to a Fibonacci retracement level. Since then, GBP strength has taken over and especially over the past few days, with another run of USD weakness hitting, GBP/USD has taken on a brighter tone than the EUR/USD major pair.
In GBP/USD, a falling wedge formation built last week as sellers were slow at support but aggressive on bounces at lower-high resistance. That wedge broke out decisively on Friday, with the run continuing through early trade this week. Price has pushed up toa familiar resistance level of 1.3568, and that’s since produced a pullback with a couple of elongated upper wicks, illustrating sellers’ response to bulls attempt at running up to the 1.3600 level that remains an elusive spot for the pair.
GBP/USD Four-Hour Chart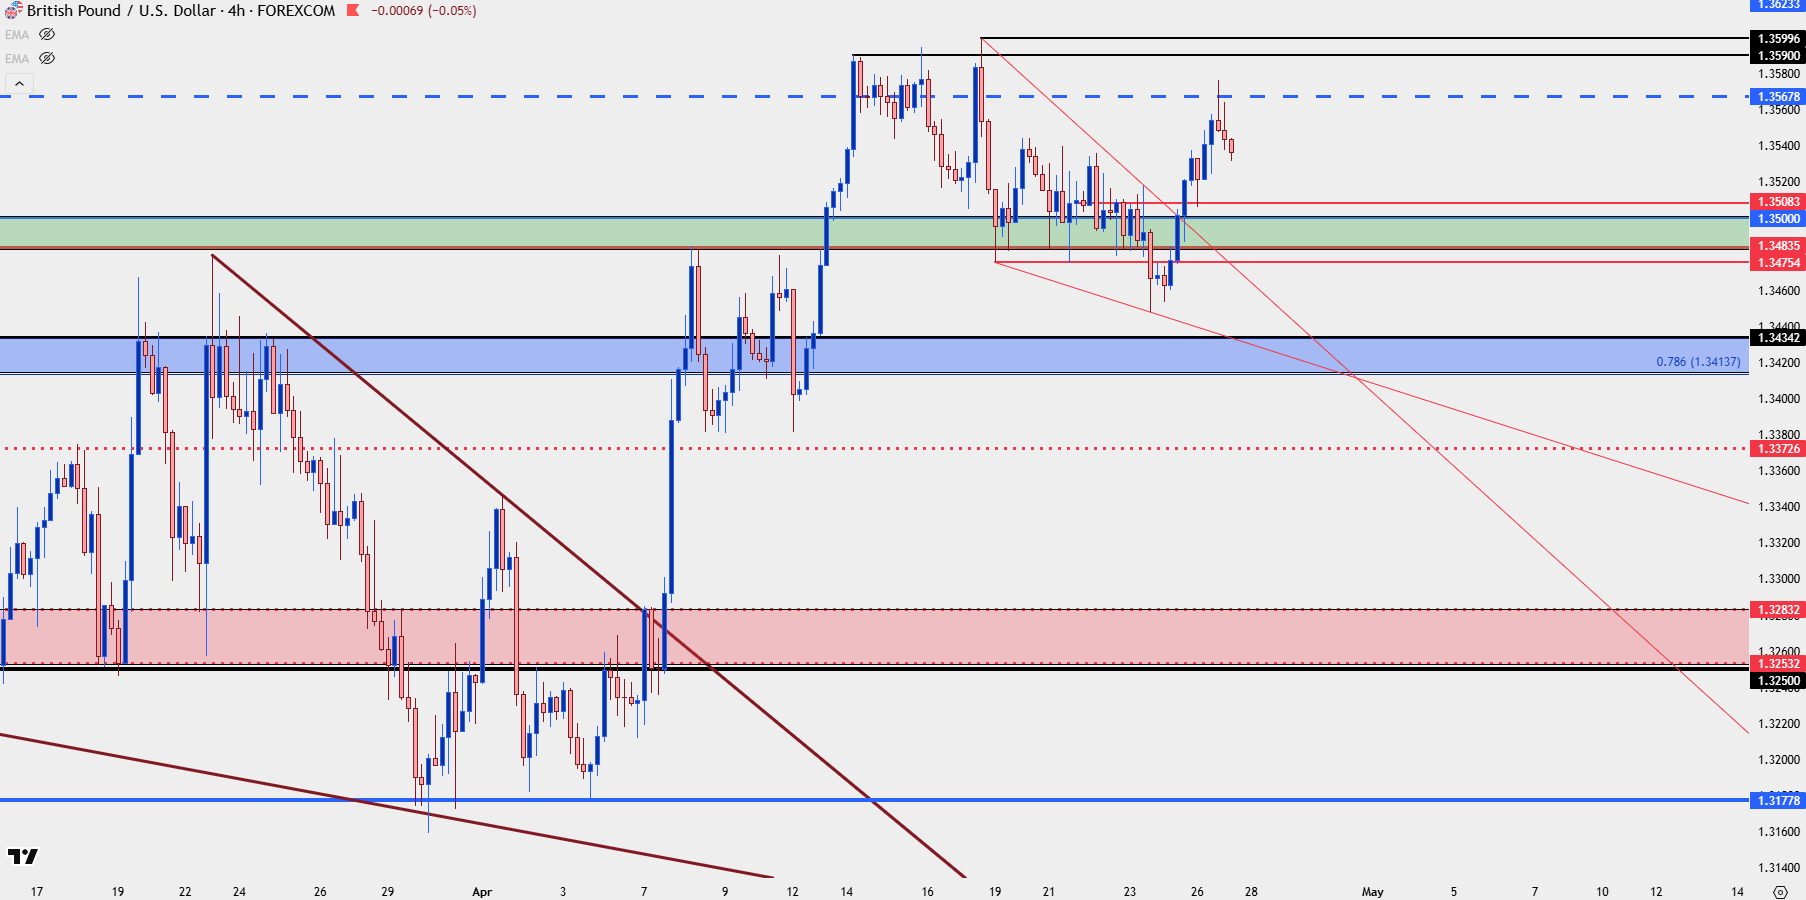
Chart prepared by James Stanley; data derived from Tradingview
From the above chart, we can see that the 1.3484-1.3500 zone remains of interest as this could set up higher-low support on subsequent pullback setups, with buyers showing up to defend last week’s lower-low.
But, for GBP strength there may be another area of note against the Japanese Yen as we approach a Bank of Japan rate decision.
GBP/JPY
I looked into GBP/JPY a couple of times last week as the pair had pushed back above the 215.00 level, and that line-in-the-sand held as support for three consecutive days to finish last week, with buyers making a push up to a fresh 17-year high in early trade for this week.
GBP/JPY Daily Chart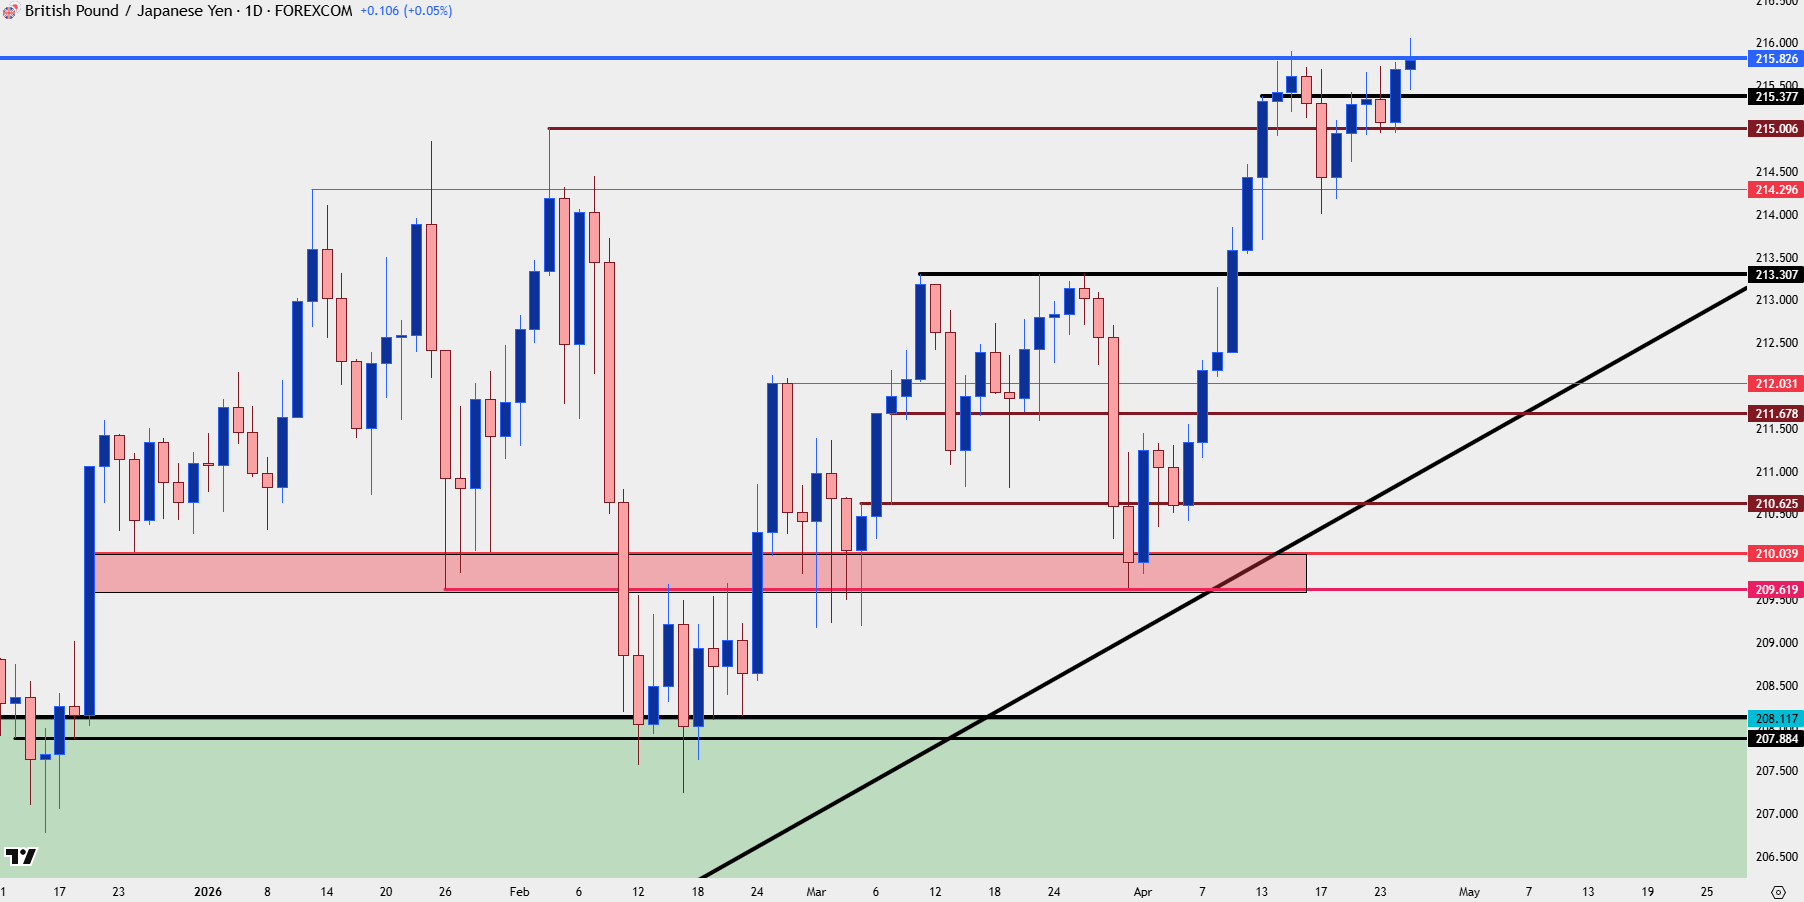
Chart prepared by James Stanley; data derived from Tradingview
GBP/JPY Shorter-Term
From the four-hour we can get better view of that support hold at 215 as there were multiple underside wicks that grasped on to that price, with buyers ultimately prevailing as follow-through hit after the weekly open. So far, however, bulls haven’t been able to sustain the move above the 215.83 level that was also looked at last week and this has reference back to 2008, and given the gravity of headline events in the next few days, if we do see a pullback here there’s now the possibility of higher-low support at the 215.38 level. If that doesn’t hold, 215 is back on the radar and if that gets slipped through, especially if it’s after the BoJ but before the BoE, caution should be utilized as something may be shifting around JPY themes.
GBP/JPY Four-Hour Chart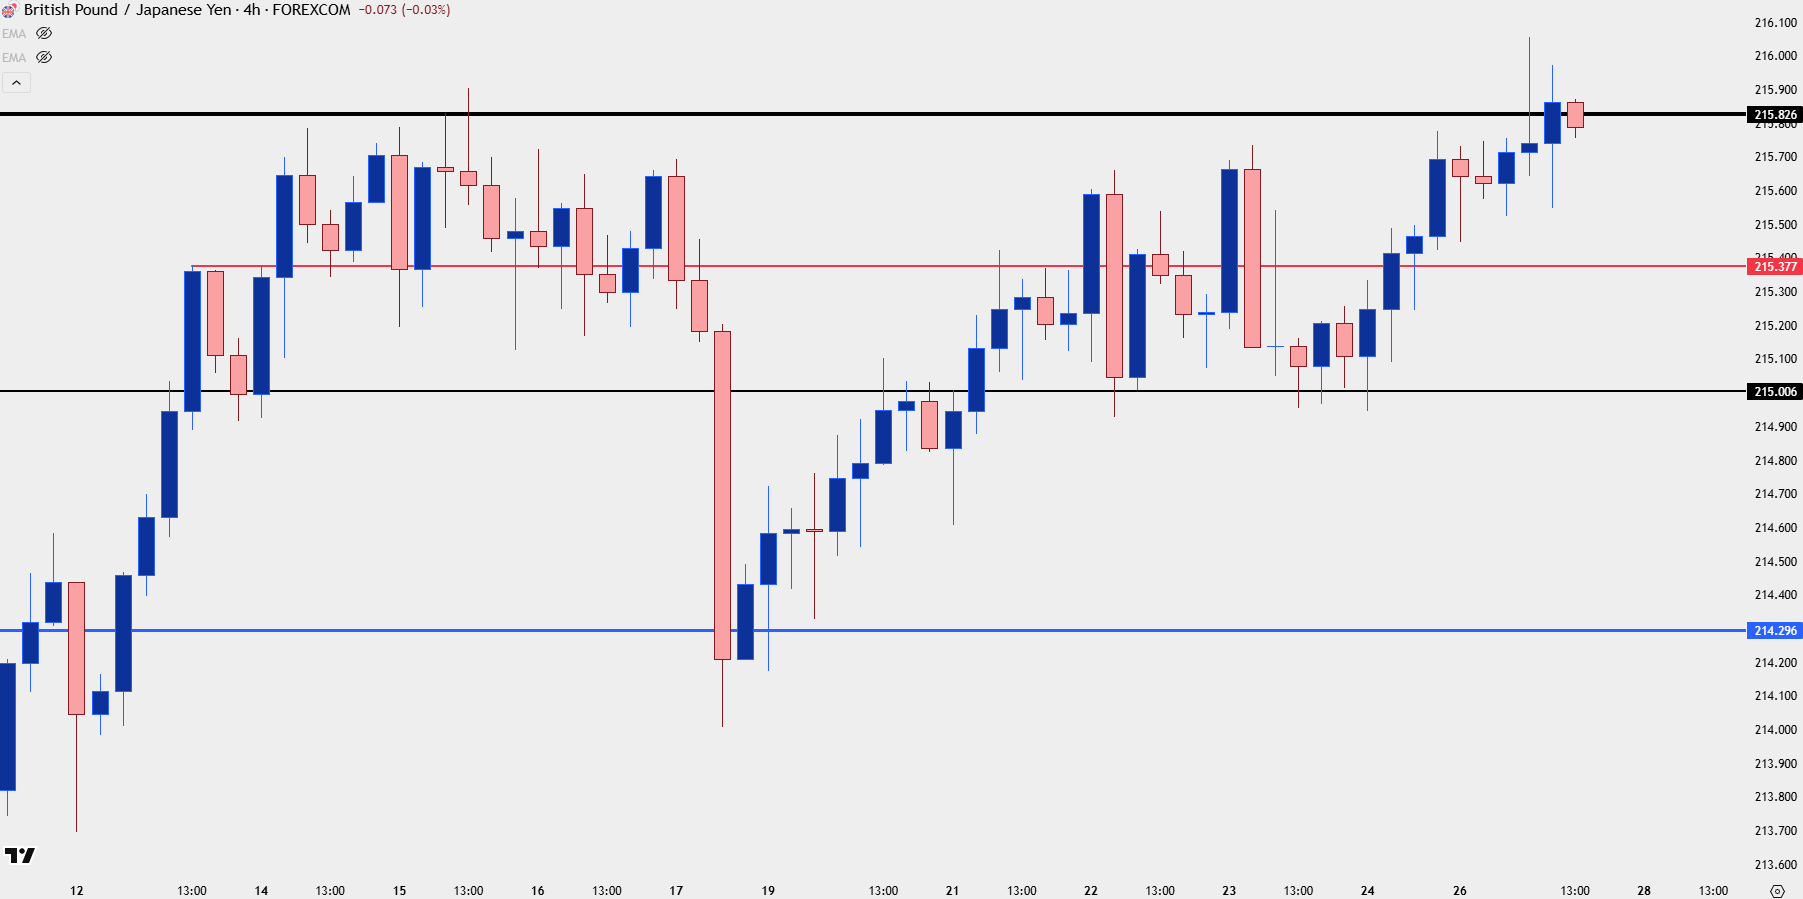
Chart prepared by James Stanley; data derived from Tradingview
EUR/GBP
In the cross pair it was the resistance zone from 0.8739-0.8753 that came into play in early-April and ultimately helped to tip the flow from EUR/USD to GBP/USD.
As looked at closely coming into the month, EUR/USD had retained more viable bullish structure than GBP/USD, but given the resistance in the cross pair the prospect of that shifting was gaining in attraction. That ultimately took place shortly after and at this point, we can see where prices have continued to tip down and there’s now a big spot of possible support a little lower, around 0.8628 that’s getting close by.
If that comes into play, then there may be an attractive point to anticipate a shift, where EUR/USD and EUR/JPY could take preference for strength over GBP/USD and GBP/JPY. We’re not quite there at this point, but if the ECB sounds more-hawkish than expected on Thursday that could definitely begin to show.
Until then, the range remains in play.
EUR/GBP Daily Price Chart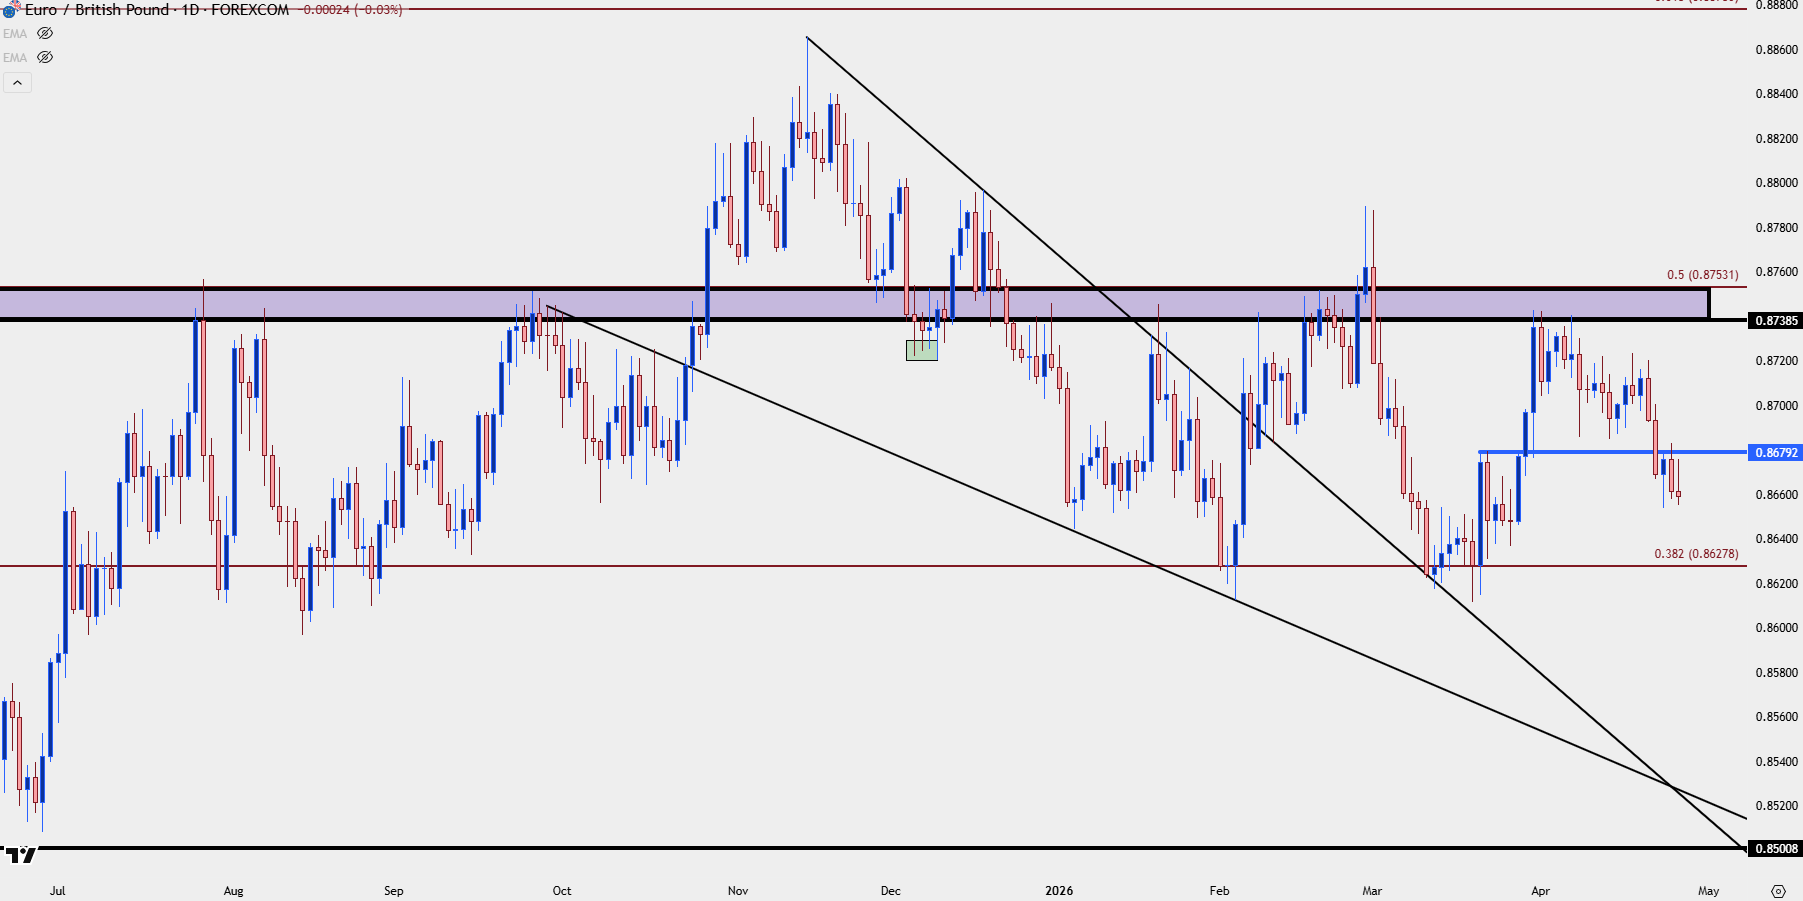
Chart prepared by James Stanley; data derived from Tradingview
--- written by James Stanley, Senior Market Analyst, Global Macro
Related tags:
Latest market news




Open an account in minutes
Experience award-winning platforms with fast and secure execution, and enjoy tight spreads from 0.5 pts on FX and 0.3 pts on indices.
Economic calendar
Web Trader platform
Our sophisticated web-based platform is packed with features.
Related articles

GBP/USD Forecast: BoE Caution Leaves the Pound Searching for Direction
Although GBP/USD has gained close to 0.5% over the last three trading sessions, reflecting a period of relative strength for the British pound, today's session has started to show a more neutral tone and the bullish momentum seen earlier in the week has begun to slow.


GBP/USD forecast: BoE’s hawkish hike, NFP awaited and AI concerns linger
The GBP/USD was holding near the 1.35 handle after the Bank of England raised interest rates to 4% in a unanimous 9-0 vote, against expectations of a 7-2 split. The cable has also benefited from the US dollar's slide after the midterm elections, although Friday's non-farm payrolls report still lies ahead which could have a more meaningful impact.


GBP/USD, GBP/AUD: Sterling Rally Faces a BoE Reality Check
Sterling faces a reality check as the BoE prepares to hike rates. GBP/USD and GBP/AUD approach resistance, leaving bulls vulnerable to dovish guidance.

This report is intended for general circulation only. It should not be construed as a recommendation, or an offer (or solicitation of an offer) to buy or sell any financial products. The information provided does not take into account your specific investment objectives, financial situation or particular needs. Before you act on any recommendation that may be contained in this report, independent advice ought to be sought from a financial adviser regarding the suitability of the investment product, taking into account your specific investment objectives, financial situation or particular needs.
StoneX Financial Pte. Ltd., may distribute reports produced by its respective foreign entities or affiliates within the StoneX group of companies or third parties pursuant to an arrangement under Regulation 32C of the Financial Advisers Regulations. Where the report is distributed to a person in Singapore who is not an accredited investor, expert investor or an institutional investor (as defined in the Securities Futures Act), StoneX Financial Pte. Ltd. accepts legal responsibility to such persons for the contents of the report only to the extent required by law. Singapore recipients should contact StoneX Financial Pte. Ltd. at 6826 9988 for matters arising from, or in connection with the report.
In the case of all other recipients of this report, to the extent permitted by applicable laws and regulations neither StoneX Financial Pte. Ltd. nor its associated companies will be responsible or liable for any loss or damage incurred arising out of, or in connection with, any use of the information contained in this report and all such liability is hereby expressly disclaimed. No representation or warranty is made, express or implied, that the content of this report is complete or accurate.
StoneX Financial Pte. Ltd. is not under any obligation to update this report.
Trading CFDs carries a high level of risk that may not be suitable for some investors. Consider your investment objectives, level of experience, financial resources, risk appetite and other relevant circumstances carefully. The possibility exists that you could lose some or all of your investments, including your initial deposits. If in doubt, please seek independent expert advice. Visit www.forex.com/en-sg/terms-and-policies for the complete Risk Disclosure Statement.