




Canadian Dollar Forecast: USD/CAD Breakout Snaps Back, 1.3750
USD/CAD broke out from an ascending triangle last week and then printed a bearish engulf on Friday after the NFP-fueled sell-off in the USD.
Share this:

Canadian Dollar, USD/CAD Talking Points:
- USD/CAD broke out to a fresh two-month high last week and snapped back aggressively after the Non-farm Payrolls report.
- The Friday bearish engulfing candlestick on the daily has so far continued through the new week but the question now is whether sellers can take out the 1.3750 level of prior resistance following the higher-lows that built in June and July.
- I looked at USD/CAD in the weekend video on the U.S. Dollar and I’ll be looking at an updated setup tomorrow in the webinar. You’re welcome to join, click here to register.
The U.S. Dollar went for a ride late last week. The Fed-fueled breakout ran through the Core PCE report on Thursday but that came tumbling down on Friday on the back of a surprising NFP print. The headline number disappointed but perhaps more shocking was the revision to prior months’ data. This was then followed by President Trump firing he head of the BLS, the department responsible for the NFP report, and then later in the session there were headlines of an early resignation at the Fed.
Collectively, this painted the picture that Trump may have advanced his position with the debate over rate cuts with the FOMC. Just a couple days earlier, Powell didn’t seem so sure about a September rate cut, and there was already debate of dissension within the Fed as two dissenting votes were cast for a rate cut last Wednesday. This was the most dissenting votes at a Fed rate decision in more than 30 years and it was obvious who the two casting votes for cuts were, as they had regularly been in the press over the prior month to broadcast their desire for lower rates.
But with Trump now in a position to name a new Fed governor and a new head of the BLS, markets have again warmed to the idea of a rate cut in September and, in-turn, USD weakness has shown.
In USD/CAD, that led to a bearish engulfing candlestick on the daily chart last Friday. Ahead of the reversal the pair had just set a fresh two-month high following the breakout from the ascending triangle formation, which itself was a counter-trend backdrop.
USD/CAD Daily Price Chart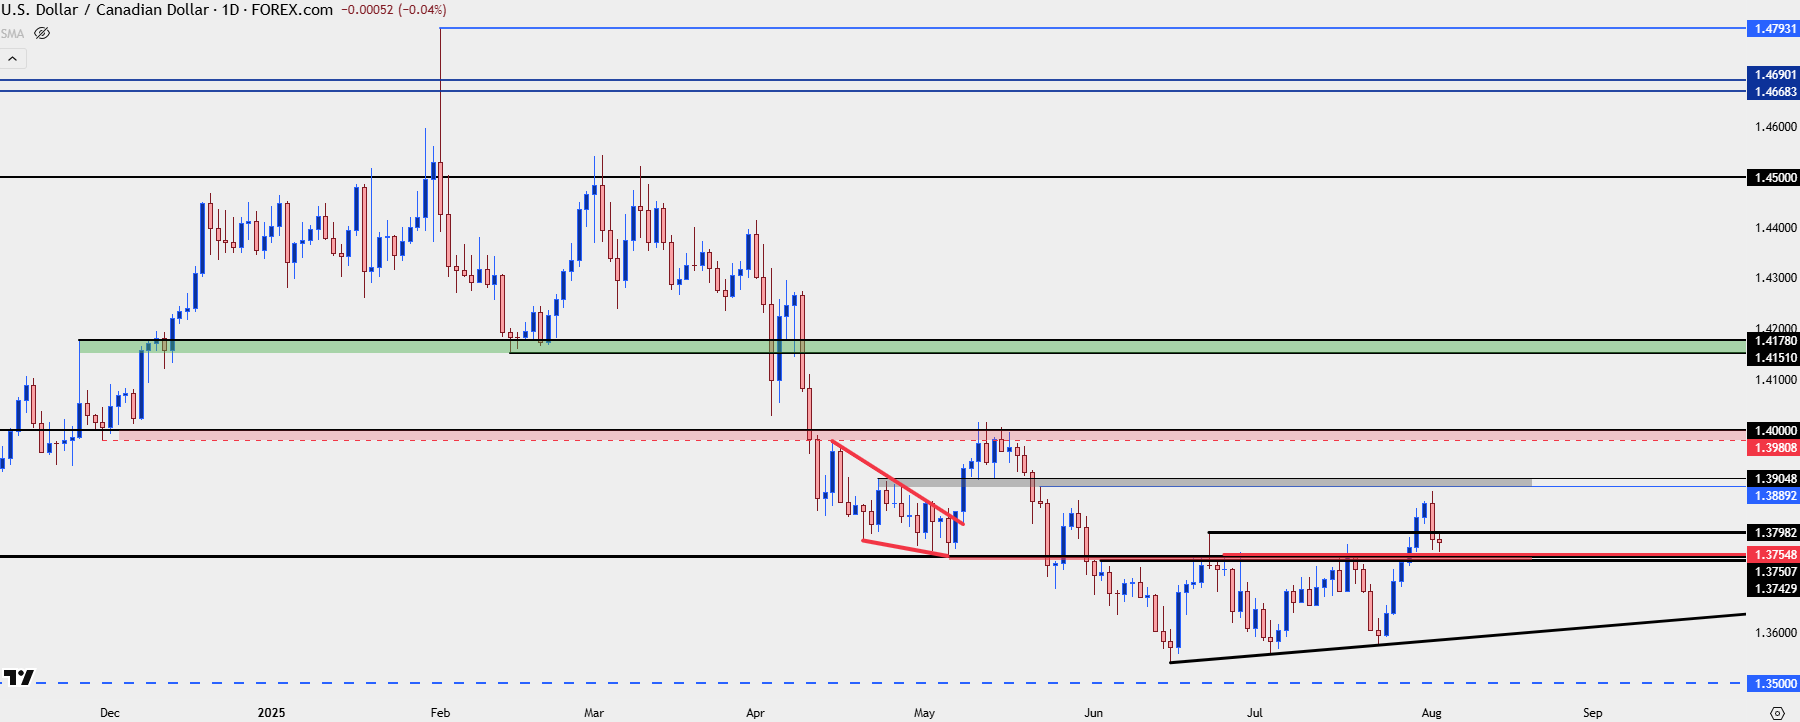
Chart prepared by James Stanley; data derived from Tradingview
USD/CAD Bigger Picture
When the USD was getting hammered in Q2 USD/CAD was a big mover, breaking below the 1.4000 psychological level and driving lower for much of the quarter.
The initial breakdown found support at the 1.3750 psychological level, which led to a pullback to 1.4000, after which bears went for another lower-low leading to a build of resistance at 1.3750.
On the other side of the matter, however, sellers could not evoke a test of the 1.3500 level in June. And then in July, sellers again shuttered away from 1.3500 and this time left a higher-low. The trendline produced from that higher-low was in-play a few weeks later, again helping to set another higher-low and this is what created the support side of the ascending triangle.
USD/CAD Weekly Chart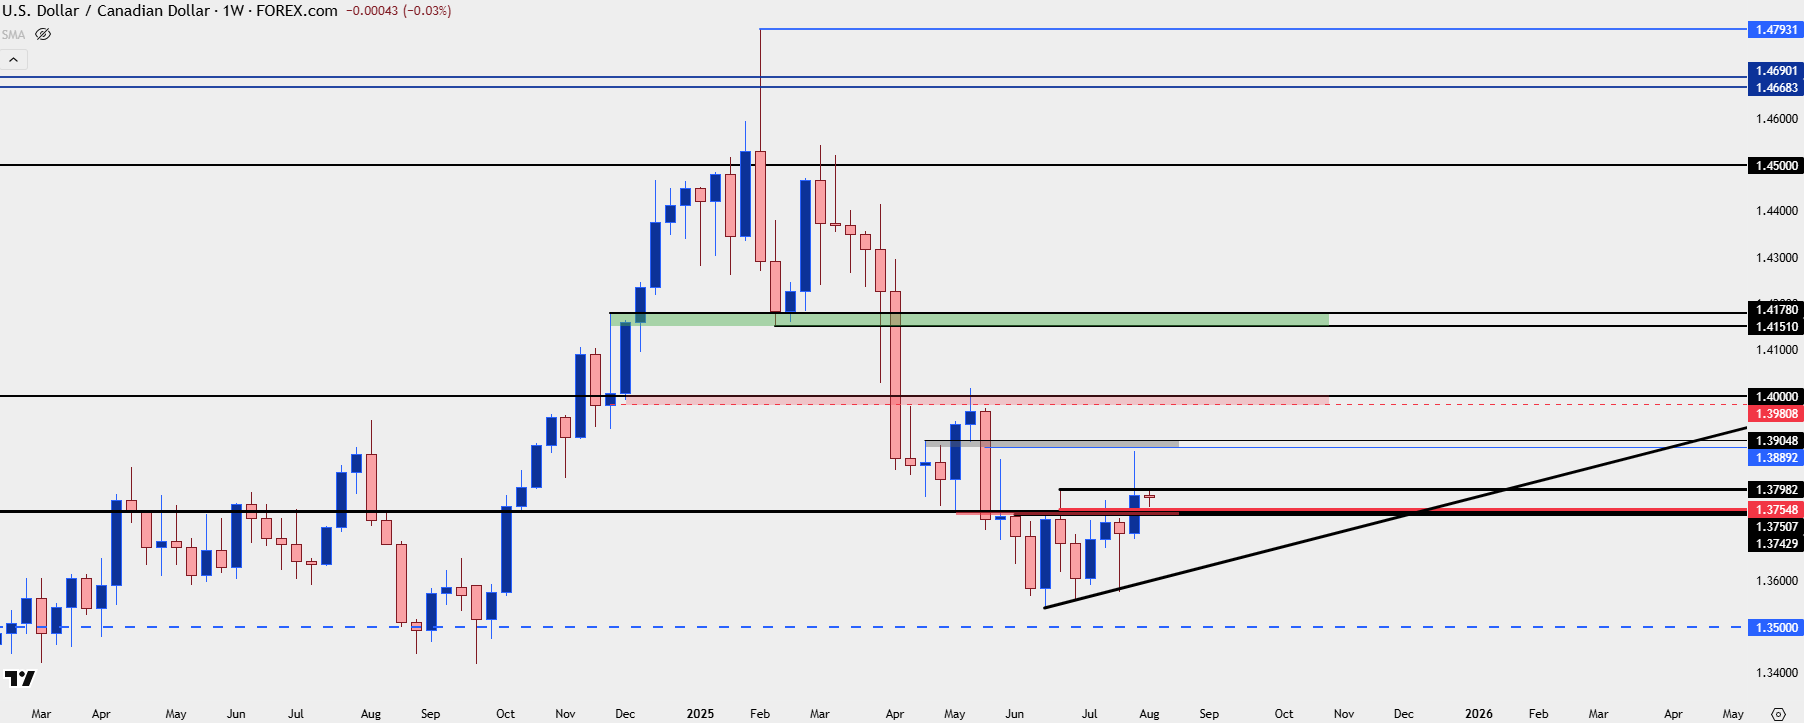
Chart prepared by James Stanley; data derived from Tradingview
USD/CAD Shorter-Term Strategy
The big question now is whether USD bears can re-take control of the trend following the July rally. The USD set a fresh lower-low on the first day of Q3 and both weekly and daily RSI were oversold at the time, which contributed to the snap back in DXY last month. While US data retained a degree of strength via both CPI and PCE, the Fed seemed in no hurry to cut rates and that may remain, as Powell had said during the press conference that it was the unemployment rate that the bank was tracking. In Friday’s NFP report, that printed right at the expectation of 4.2%, so the question remains as to whether Powell’s insinuation from Wednesday, that this is an economy not desperately in need of a rate cut has changed?
In USD/CAD, the 1.3750 spot remains huge as this spot of support from May has been resistance multiple times in June and July. At this point, approximately 38.2% of the recent rally has been erased and the 50% mark of that Fibonacci retracement plots at 1.3728, which gives a big more reference to short-term bullish continuation scenarios.
USD/CAD Four-Hour Chart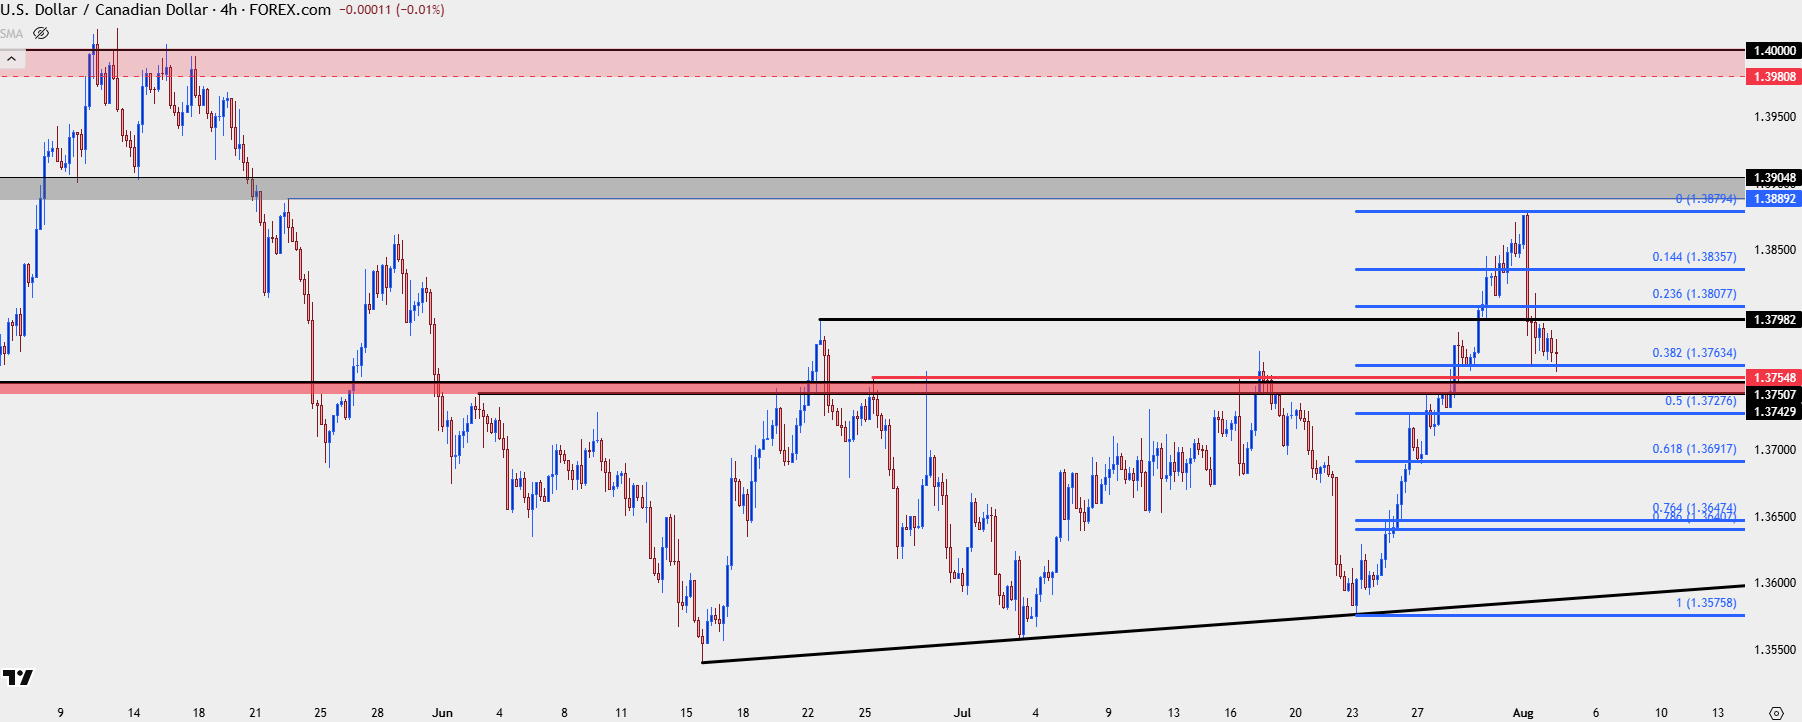
Chart prepared by James Stanley; data derived from Tradingview
--- written by James Stanley, Senior Strategist
Related tags:



Open an account in minutes
Experience award-winning platforms with fast and secure execution, and enjoy tight spreads from 0.5 pts on FX and 0.3 pts on indices.
Economic calendar
Web Trader platform
Our sophisticated web-based platform is packed with features.
Related articles

Canadian Dollar Analysis: USD/CAD Returns to July Highs Ahead of NFP
The Canadian dollar continues to face one of its most challenging environments in recent months when it comes to maintaining strength against the U.S. dollar. The weakness of the Canadian currency is clearly reflected in USD/CAD, which has now recorded nine consecutive bullish sessions and gained more than 1.7% during that period.


Gold Price Outlook: XAU/USD Resistance at $4200 Sets Up for NFP
It was a strong sell-off to start the week in gold and despite a Tuesday bounce, sellers are continuing to push following a resistance hit at the $4200 level.

Canadian Dollar Forecast: USD/CAD Four-Week Rally Eyes Yearly Highs 9 30 2026
USD/CAD has advanced in 14 of the past 15 sessions, but stretched momentum raises the stakes as major resistance and NFP come into focus.

This report is intended for general circulation only. It should not be construed as a recommendation, or an offer (or solicitation of an offer) to buy or sell any financial products. The information provided does not take into account your specific investment objectives, financial situation or particular needs. Before you act on any recommendation that may be contained in this report, independent advice ought to be sought from a financial adviser regarding the suitability of the investment product, taking into account your specific investment objectives, financial situation or particular needs.
StoneX Financial Pte. Ltd., may distribute reports produced by its respective foreign entities or affiliates within the StoneX group of companies or third parties pursuant to an arrangement under Regulation 32C of the Financial Advisers Regulations. Where the report is distributed to a person in Singapore who is not an accredited investor, expert investor or an institutional investor (as defined in the Securities Futures Act), StoneX Financial Pte. Ltd. accepts legal responsibility to such persons for the contents of the report only to the extent required by law. Singapore recipients should contact StoneX Financial Pte. Ltd. at 6826 9988 for matters arising from, or in connection with the report.
In the case of all other recipients of this report, to the extent permitted by applicable laws and regulations neither StoneX Financial Pte. Ltd. nor its associated companies will be responsible or liable for any loss or damage incurred arising out of, or in connection with, any use of the information contained in this report and all such liability is hereby expressly disclaimed. No representation or warranty is made, express or implied, that the content of this report is complete or accurate.
StoneX Financial Pte. Ltd. is not under any obligation to update this report.
Trading CFDs carries a high level of risk that may not be suitable for some investors. Consider your investment objectives, level of experience, financial resources, risk appetite and other relevant circumstances carefully. The possibility exists that you could lose some or all of your investments, including your initial deposits. If in doubt, please seek independent expert advice. Visit www.forex.com/en-sg/terms-and-policies for the complete Risk Disclosure Statement.