





Canadian Dollar Forecast: USD/CAD Jump, CAD Punished by Trump Tariffs
USD/CAD rallied this week as the Trump tariff topic has dominated headlines. The big question now is whether Trump will enact tariffs on Canada next week, which could carry with a negative reaction in U.S. equity markets.
Share this:

Canadian Dollar Talking Points:
- While the first half of February saw USD/CAD ease as the tariff topic led to profit taking, the past week has seen considerable strength as Trump has pointed to an earlier implementation date on Canadian and Mexican tariffs.
- There’s still quite a bit that’s unknown but as we saw coming into February, investors abhor uncertainty, and that can take a toll on a market such as we saw in the USD/CAD breakout to fresh 21-year highs.
- USD/CAD is still very much driven by timing of Trump tariffs, and as I showed on the Tuesday webinar, bullish potential was building via higher-highs and lows in the pair.
- If tariffs do get implemented, there’s a host of repercussions to consider, such as U.S. equity market performance or the Canadian response. Previously Canadian leadership had pledged ‘pandemic-level financial support’ for the economy in that scenario, which would seem to carry even more potential for Canadian Dollar weakness.
Coming into the month of February there was still quite a bit unknown around President Trump’s planned tariffs. We knew that Canada and Mexico were two of the first economies in his focus and the initial starting date of February 1st had many on edge. The Friday before those tariffs were set to come into play, which was January 31st, we saw that confusion on full display as a report from Reuters earlier in the day indicated that tariffs on Canada and Mexico had been pushed back for a month, to come into effect on March 1st.
But that same weekend that tariffs were set to come into play was also when President Trump started to talk about tariffs on Europe. And then the next week, the topic of reciprocal tariffs came into the picture, and then tariffs on automobiles. As the focus shifted away from Canada and on to the rest of the world, USD/CAD pulled back, eventually testing the 1.4200 level. As I had warned at the time, the saga was far from over as another impending tariff date was on the calendar for a couple of weeks later.
Well, that date is now here and there’s probably even less clarity now than there was then. But a recent statement from President Trump on social media drove a strong breakout in the pair as he indicated that tariffs were set to come into effect next Tuesday, on March the 4th. And he once again tied those tariffs to the flow of migrants and drugs across American borders.
That late-month movement in USD/CAD saw the bearish engulfing candlestick that had built on the monthly chart pare back considerably, and now, the monthly bar holds more of a ‘long-legged spinning top’ formation. The body is too wide to be a doji but it’s also in the middle of two elongated wicks, following the early-February breakout and the pullback that followed.
Nonetheless, the monthly chart still does retain mean reversion potential, as continued failure at 1.4500 speaks to the similar episodes of resistance that played out in both 2016 and 2020.
USD/CAD Monthly Chart
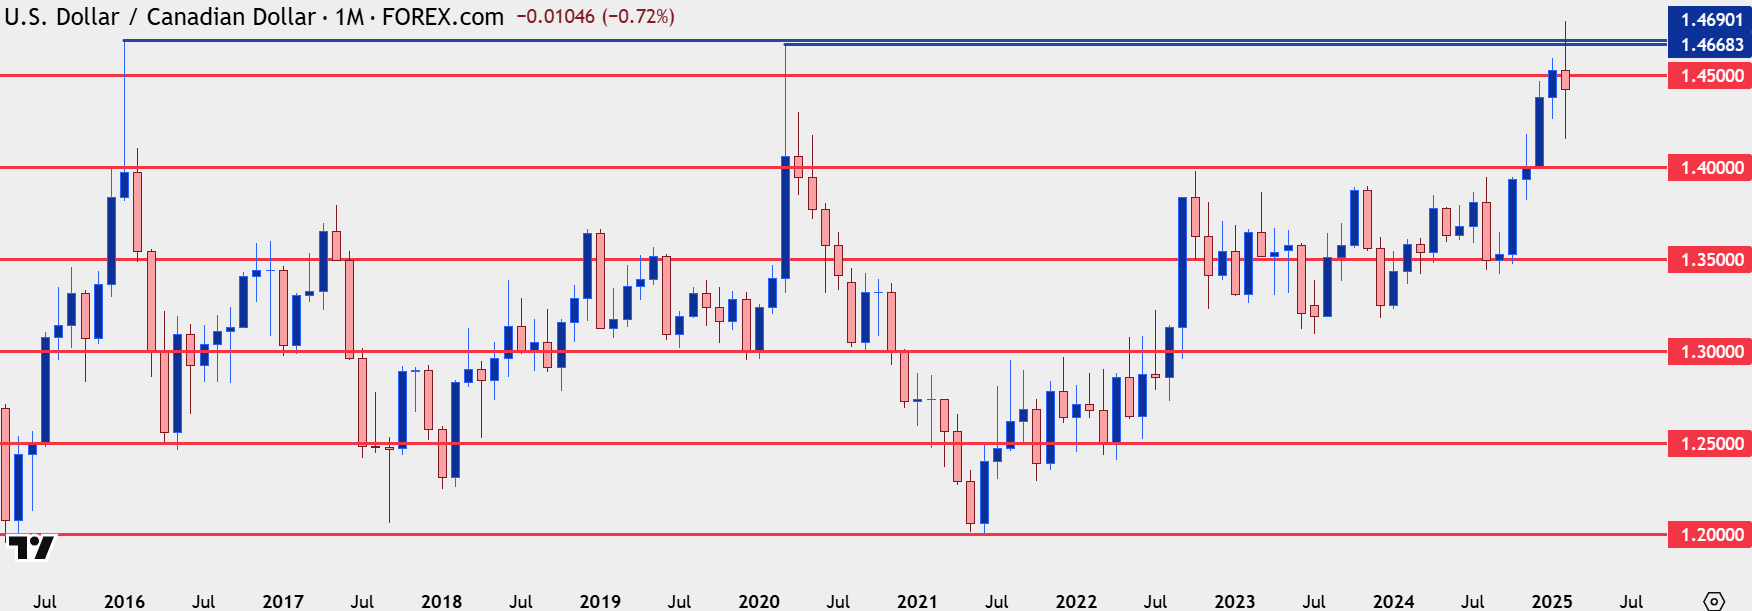
USD/CAD 1.4500
I had looked into this scenario last weekend when I asked whether USD/CAD had topped. The answer that question is still inconclusive, and following the rally over the past week, it looks less likely for that to be the case.
But – prices still matter, and the true test will be as the pair re-approaches prior highs. While there’s still considerable confusion around Trump tariffs on Canada and whether they’ll come into play, there could be an open door for bears to retain the longer-term mean reversion theme.
Sitting overhead is a contentious level at 1.4500. So far there’s only been one daily close above this price in the past four years, and that was from the date that the Trump White House walked back the Reuters report on whether tariffs were coming into play on February 1st. As the White House refuted that support, USD/CAD broke out and closed the week above that level – followed by a strong breakout on the next weekly open as several questions were left unanswered, such as what products tariffs would apply to and how they would be enforced. As a truce was announced with a later start date, the pair relaxed and quickly drove down to support at the 1.4300 handle.
The next week’s open may not be as contentious as the early-February outlay given that tariffs are set to go into effect on Tuesday, but there’s still considerable confusion – and room for a deal or truce to be announced.
There’s also the prospect of consequences should tariffs actually get put into place as U.S. equities have had a rough week on the back of that tariff threat. If it actually comes to fruition, that could mean more pain for stocks which is a repercussion that the Trump administration may not want to deal with at this point.
From the weekly chart in USD/CAD, the 1.4500 area of resistance is quite clear and if that holds, it would be a lower-high inside of the February breakout. But given the confusion around the driver we have to widen the options around the scenario, and it’s the 1.4668-1.4690 zone that’s also of interest. These levels were the swing highs in 2016 and 2020 and they showed as short-term support and resistance back in early-February when the breakout in the pair hit.
USD/CAD Weekly Chart
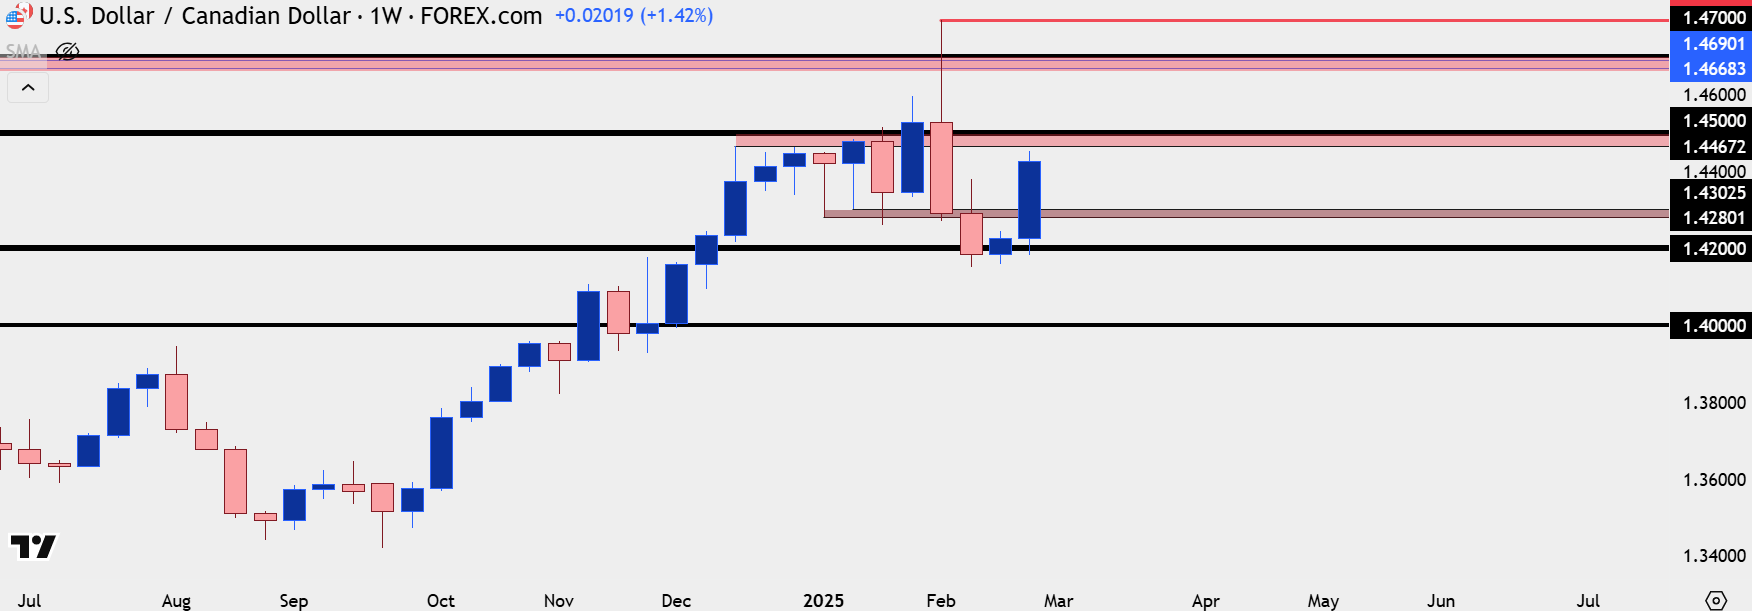 Chart prepared by James Stanley; data derived from Tradingview
USD/CAD Near-Term Strategy
Perhaps one of the best parts of price action is that it will incorporate sentiment and headlines at any given point in time. And when there is some new uncertainty that’s getting priced-in, such as the tariff topic that’s been pushing USD/CAD since late-November, that uncertainty will tend to show via price, like we saw with last month’s breakout.
But perhaps even more interesting is when the two don’t seem to fit together, or, as the old saying goes, ‘when a stock falls on good news, look out below.’
In the first half of February that seemed to be the case for USD/CAD. Trump tariffs were still there, and were still a threat, yet the pair was hurriedly pulling back and selling off. This was likely driven at least in part by profit taking from the earlier month breakout.
And then later in the month, as I looked at on the webinar on Tuesday, price action had started to show bullish tendencies in USD/CAD even though the U.S. Dollar still had bearish potential. The rally in USD/CAD continued as support held at prior resistance, and bulls continued to push until the Thursday breakout on the back of the Trump tariff remark for next Tuesday.
From the four-hour chart, that bullish potential remains as it’s been a continued sequence of higher-highs and higher-lows. Bulls have so far stalled ahead of a resistance test at the 1.4467-1.4500 zone, which is what keeps the door open for reversal setups next week. But, for now, if buyers can retain support above 1.4280-1.4300 and preferably 1.4371, they can keep an open door to bullish breakouts over 1.4500.
USD/CAD Four-Hour Price Chart
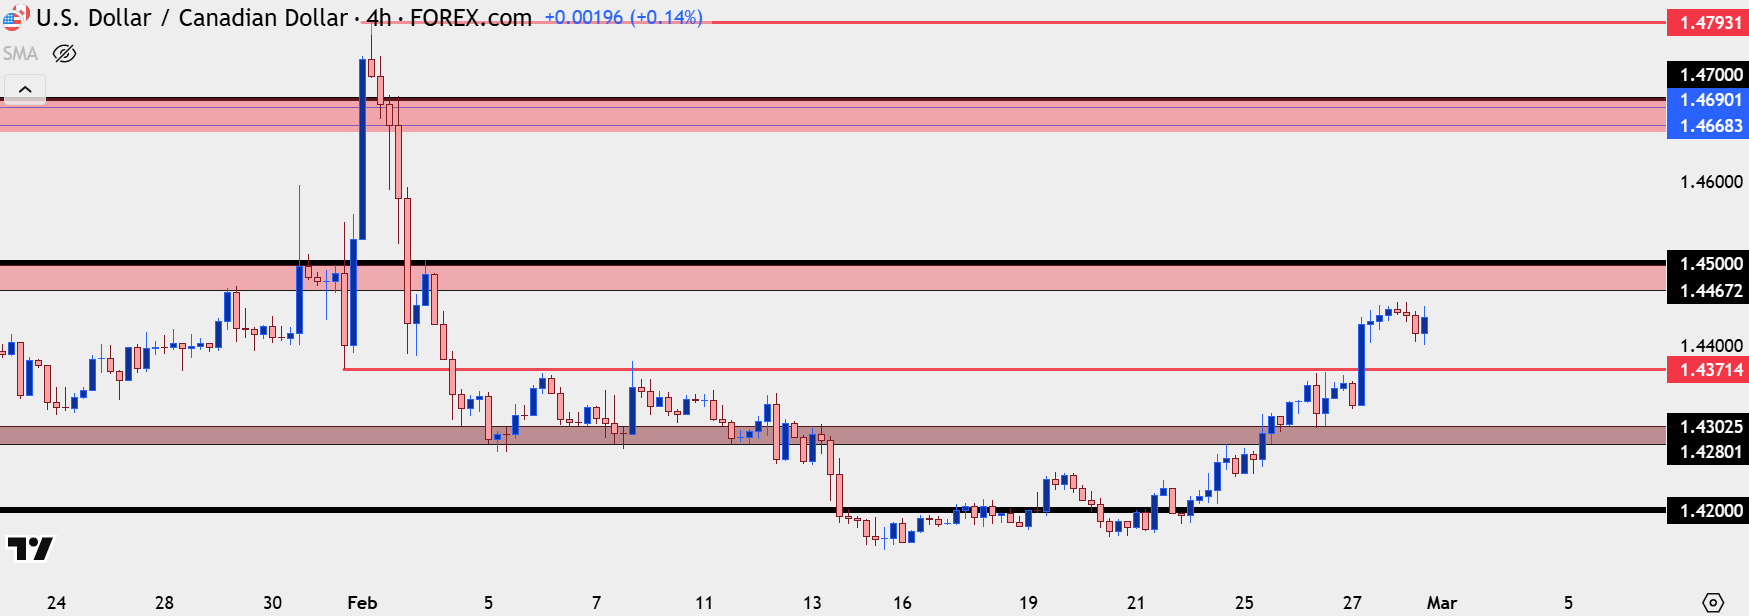 Chart prepared by James Stanley; data derived from Tradingview
USD/CAD Reversal Potential
For the pair to reverse, it would seem that some progress would need to be made in U.S.-Canada discussions around tariffs. President Trump has been insistent on progress in shoring up the northern border, and Mexico appears to be in process of trying to appease the President’s concerns. If Canada can do the same, there’s opportunity for a deal.
But also of concern is the repercussion of tariffs on Canada, and as we saw over the past week, U.S. equities underperformed as this risk dominated the headlines. Perhaps those themes could diverge, but, again, markets abhor uncertainty and actually implementing tariffs would be a heavy dose of that.
Going back to the monthly chart at the beginning of this article, and the indecision that showed in February even as tariffs dominated the discussion, and USD/CAD would retain mean reversion, range continuation potential until that high is broken. And if March can produce a lower-high, that scenario would seem even more attractive. Now, predicting such an agreement and that type of reversal can be a challenge. But given price action from the prior breakout, there’s three very attractive zones to look for resistance to play out.
The 1.4500 area is obvious and this has some historical appeal. The initial breakout over 1.4500 stalled just below the 1.4600 level, at 1.4596, and then the longer-term group of swing highs plots right around 1.4700, which was a key level in the shorter-term backdrop when the early-February breakout was hitting.
A hold of resistance at any of those three zones, particularly on a four-hour or daily bar close basis, opens the door for deeper pullback potential and that’s something that could possibly turn into reversal, particularly if the headlines point towards a delay in tariff implementation.
As to whether a pullback turns into something more, the question will be that shorter-term bullish structure looked at above, and whether bears can begin taking out supports from the four-hour chart.
USD/CAD Daily Price Chart
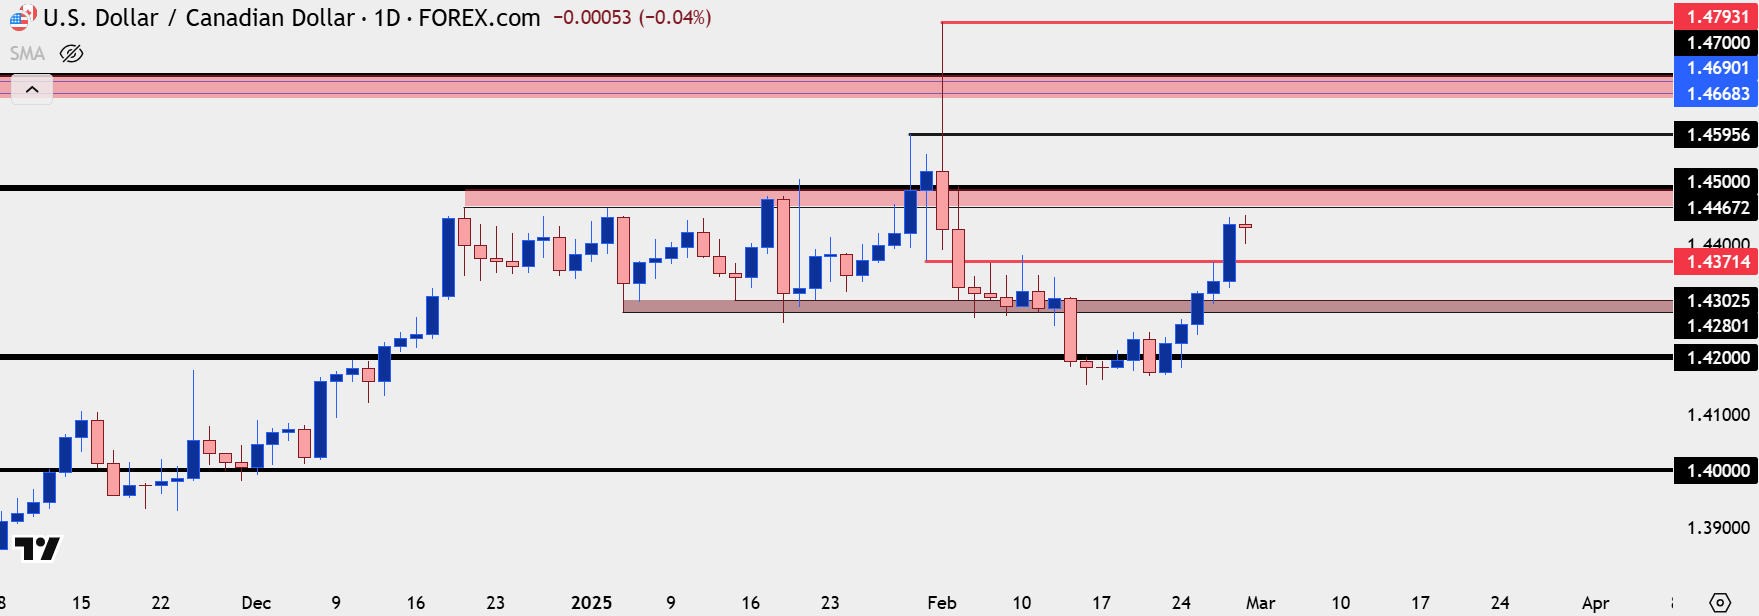 Chart prepared by James Stanley; data derived from Tradingview
--- written by James Stanley, Senior Strategist
Canadian Dollar Talking Points:
- While the first half of February saw USD/CAD ease as the tariff topic led to profit taking, the past week has seen considerable strength as Trump has pointed to an earlier implementation date on Canadian and Mexican tariffs.
- There’s still quite a bit that’s unknown but as we saw coming into February, investors abhor uncertainty, and that can take a toll on a market such as we saw in the USD/CAD breakout to fresh 21-year highs.
- USD/CAD is still very much driven by timing of Trump tariffs, and as I showed on the Tuesday webinar, bullish potential was building via higher-highs and lows in the pair.
- If tariffs do get implemented, there’s a host of repercussions to consider, such as U.S. equity market performance or the Canadian response. Previously Canadian leadership had pledged ‘pandemic-level financial support’ for the economy in that scenario, which would seem to carry even more potential for Canadian Dollar weakness.
Coming into the month of February there was still quite a bit unknown around President Trump’s planned tariffs. We knew that Canada and Mexico were two of the first economies in his focus and the initial starting date of February 1st had many on edge. The Friday before those tariffs were set to come into play, which was January 31st, we saw that confusion on full display as a report from Reuters earlier in the day indicated that tariffs on Canada and Mexico had been pushed back for a month, to come into effect on March 1st.
But that same weekend that tariffs were set to come into play was also when President Trump started to talk about tariffs on Europe. And then the next week, the topic of reciprocal tariffs came into the picture, and then tariffs on automobiles. As the focus shifted away from Canada and on to the rest of the world, USD/CAD pulled back, eventually testing the 1.4200 level. As I had warned at the time, the saga was far from over as another impending tariff date was on the calendar for a couple of weeks later.
Well, that date is now here and there’s probably even less clarity now than there was then. But a recent statement from President Trump on social media drove a strong breakout in the pair as he indicated that tariffs were set to come into effect next Tuesday, on March the 4th. And he once again tied those tariffs to the flow of migrants and drugs across American borders.
That late-month movement in USD/CAD saw the bearish engulfing candlestick that had built on the monthly chart pare back considerably, and now, the monthly bar holds more of a ‘long-legged spinning top’ formation. The body is too wide to be a doji but it’s also in the middle of two elongated wicks, following the early-February breakout and the pullback that followed.
Nonetheless, the monthly chart still does retain mean reversion potential, as continued failure at 1.4500 speaks to the similar episodes of resistance that played out in both 2016 and 2020.
USD/CAD Monthly Chart
USD/CAD 1.4500
I had looked into this scenario last weekend when I asked whether USD/CAD had topped. The answer that question is still inconclusive, and following the rally over the past week, it looks less likely for that to be the case.
But – prices still matter, and the true test will be as the pair re-approaches prior highs. While there’s still considerable confusion around Trump tariffs on Canada and whether they’ll come into play, there could be an open door for bears to retain the longer-term mean reversion theme.
Sitting overhead is a contentious level at 1.4500. So far there’s only been one daily close above this price in the past four years, and that was from the date that the Trump White House walked back the Reuters report on whether tariffs were coming into play on February 1st. As the White House refuted that support, USD/CAD broke out and closed the week above that level – followed by a strong breakout on the next weekly open as several questions were left unanswered, such as what products tariffs would apply to and how they would be enforced. As a truce was announced with a later start date, the pair relaxed and quickly drove down to support at the 1.4300 handle.
The next week’s open may not be as contentious as the early-February outlay given that tariffs are set to go into effect on Tuesday, but there’s still considerable confusion – and room for a deal or truce to be announced.
There’s also the prospect of consequences should tariffs actually get put into place as U.S. equities have had a rough week on the back of that tariff threat. If it actually comes to fruition, that could mean more pain for stocks which is a repercussion that the Trump administration may not want to deal with at this point.
From the weekly chart in USD/CAD, the 1.4500 area of resistance is quite clear and if that holds, it would be a lower-high inside of the February breakout. But given the confusion around the driver we have to widen the options around the scenario, and it’s the 1.4668-1.4690 zone that’s also of interest. These levels were the swing highs in 2016 and 2020 and they showed as short-term support and resistance back in early-February when the breakout in the pair hit.
USD/CAD Weekly Chart
USD/CAD Near-Term Strategy
Perhaps one of the best parts of price action is that it will incorporate sentiment and headlines at any given point in time. And when there is some new uncertainty that’s getting priced-in, such as the tariff topic that’s been pushing USD/CAD since late-November, that uncertainty will tend to show via price, like we saw with last month’s breakout.
But perhaps even more interesting is when the two don’t seem to fit together, or, as the old saying goes, ‘when a stock falls on good news, look out below.’
In the first half of February that seemed to be the case for USD/CAD. Trump tariffs were still there, and were still a threat, yet the pair was hurriedly pulling back and selling off. This was likely driven at least in part by profit taking from the earlier month breakout.
And then later in the month, as I looked at on the webinar on Tuesday, price action had started to show bullish tendencies in USD/CAD even though the U.S. Dollar still had bearish potential. The rally in USD/CAD continued as support held at prior resistance, and bulls continued to push until the Thursday breakout on the back of the Trump tariff remark for next Tuesday.
From the four-hour chart, that bullish potential remains as it’s been a continued sequence of higher-highs and higher-lows. Bulls have so far stalled ahead of a resistance test at the 1.4467-1.4500 zone, which is what keeps the door open for reversal setups next week. But, for now, if buyers can retain support above 1.4280-1.4300 and preferably 1.4371, they can keep an open door to bullish breakouts over 1.4500.
USD/CAD Four-Hour Price Chart
USD/CAD Reversal Potential
For the pair to reverse, it would seem that some progress would need to be made in U.S.-Canada discussions around tariffs. President Trump has been insistent on progress in shoring up the northern border, and Mexico appears to be in process of trying to appease the President’s concerns. If Canada can do the same, there’s opportunity for a deal.
But also of concern is the repercussion of tariffs on Canada, and as we saw over the past week, U.S. equities underperformed as this risk dominated the headlines. Perhaps those themes could diverge, but, again, markets abhor uncertainty and actually implementing tariffs would be a heavy dose of that.
Going back to the monthly chart at the beginning of this article, and the indecision that showed in February even as tariffs dominated the discussion, and USD/CAD would retain mean reversion, range continuation potential until that high is broken. And if March can produce a lower-high, that scenario would seem even more attractive. Now, predicting such an agreement and that type of reversal can be a challenge. But given price action from the prior breakout, there’s three very attractive zones to look for resistance to play out.
The 1.4500 area is obvious and this has some historical appeal. The initial breakout over 1.4500 stalled just below the 1.4600 level, at 1.4596, and then the longer-term group of swing highs plots right around 1.4700, which was a key level in the shorter-term backdrop when the early-February breakout was hitting.
A hold of resistance at any of those three zones, particularly on a four-hour or daily bar close basis, opens the door for deeper pullback potential and that’s something that could possibly turn into reversal, particularly if the headlines point towards a delay in tariff implementation.
As to whether a pullback turns into something more, the question will be that shorter-term bullish structure looked at above, and whether bears can begin taking out supports from the four-hour chart.
USD/CAD Daily Price Chart
--- written by James Stanley, Senior Strategist
Latest market news




Open an account in minutes
Experience award-winning platforms with fast and secure execution, and enjoy tight spreads from 0.5 pts on FX and 0.3 pts on indices.
Economic calendar
Web Trader platform
Our sophisticated web-based platform is packed with features.
Related articles
Australian Dollar Outlook: AUD/USD Screams Sentiment Extreme Into Fed, CPI
AUD/USD rebounds despite record bearish futures positioning, with Australian Q3 CPI and the Fed meeting threatening to trigger another short squeeze.
EUR/USD weekly outlook: FOMC and ECB to set the tone
The current backdrop is modestly bearish. On Friday, the EUR/USD closed modestly lower, down for the third consecutive day. The pair also posted a weekly decline after staging a modest recovery attempt in the previous week. Out of the past 8 weeks, the EUR/USD has fallen on 6 occasions. There is not much supporting factors for the single currency right now. So, the upside remains capped.


Gold Does Something it Hasn’t Done in a Year, is Larger Risk-Off Afoot?
With tech stocks getting hit harder last week there was collateral damage elsewhere, including gold as the metal closed below the $4k level for the week and that’s the first time that’s happened to spot gold in more than a year.
This report is intended for general circulation only. It should not be construed as a recommendation, or an offer (or solicitation of an offer) to buy or sell any financial products. The information provided does not take into account your specific investment objectives, financial situation or particular needs. Before you act on any recommendation that may be contained in this report, independent advice ought to be sought from a financial adviser regarding the suitability of the investment product, taking into account your specific investment objectives, financial situation or particular needs.
StoneX Financial Pte. Ltd., may distribute reports produced by its respective foreign entities or affiliates within the StoneX group of companies or third parties pursuant to an arrangement under Regulation 32C of the Financial Advisers Regulations. Where the report is distributed to a person in Singapore who is not an accredited investor, expert investor or an institutional investor (as defined in the Securities Futures Act), StoneX Financial Pte. Ltd. accepts legal responsibility to such persons for the contents of the report only to the extent required by law. Singapore recipients should contact StoneX Financial Pte. Ltd. at 6826 9988 for matters arising from, or in connection with the report.
In the case of all other recipients of this report, to the extent permitted by applicable laws and regulations neither StoneX Financial Pte. Ltd. nor its associated companies will be responsible or liable for any loss or damage incurred arising out of, or in connection with, any use of the information contained in this report and all such liability is hereby expressly disclaimed. No representation or warranty is made, express or implied, that the content of this report is complete or accurate.
StoneX Financial Pte. Ltd. is not under any obligation to update this report.
Trading CFDs carries a high level of risk that may not be suitable for some investors. Consider your investment objectives, level of experience, financial resources, risk appetite and other relevant circumstances carefully. The possibility exists that you could lose some or all of your investments, including your initial deposits. If in doubt, please seek independent expert advice. Visit www.forex.com/en-sg/terms-and-policies for the complete Risk Disclosure Statement.