











Crude Cracks, Gold Glitters, USD/JPY Drifts as Soft US Data Hammers Yields
Big downside surprises in US producer prices, retail sales, and factory output fuelled hopes the Fed could cut sooner, knocking yields and lifting equities. Gold loved it, crude didn’t—but FX markets stayed aloof, clinging to the charts over fundamentals.
Share this:

- US PPI fell 0.5% vs 0.2% gain expected—biggest drop in over a year
- Retail control group and factory output also undershot forecasts
- Yields dropped sharply; markets priced in two Fed cuts by year-end
- Crude slumped on Iran nuclear deal talk
- Gold bounced off trend support as dip-buyers stepped in aggressively
Summary
A string of softer-than-expected U.S. economic data prints on Thursday revived expectations for more rate cuts from the Federal Reserve, resulting in a big reversal in interest rate markets following heavy losses earlier in the week. Rather than fret about a potential U.S. recession, cyclical stocks rallied, with capital shifting out of growth names that had outperformed in previous days. While the rates and equities world were enthusiastic, the FX universe was disinterested—seemingly taking its lead from technicals rather than anything resembling fundamentals. Gold staged a dramatic bounce after hitting multi-week lows, while crude did the opposite on the prospect of even more supply hitting an already saturated market.
Downbeat Data Revives Rate Cut Bets
Source: TradingView
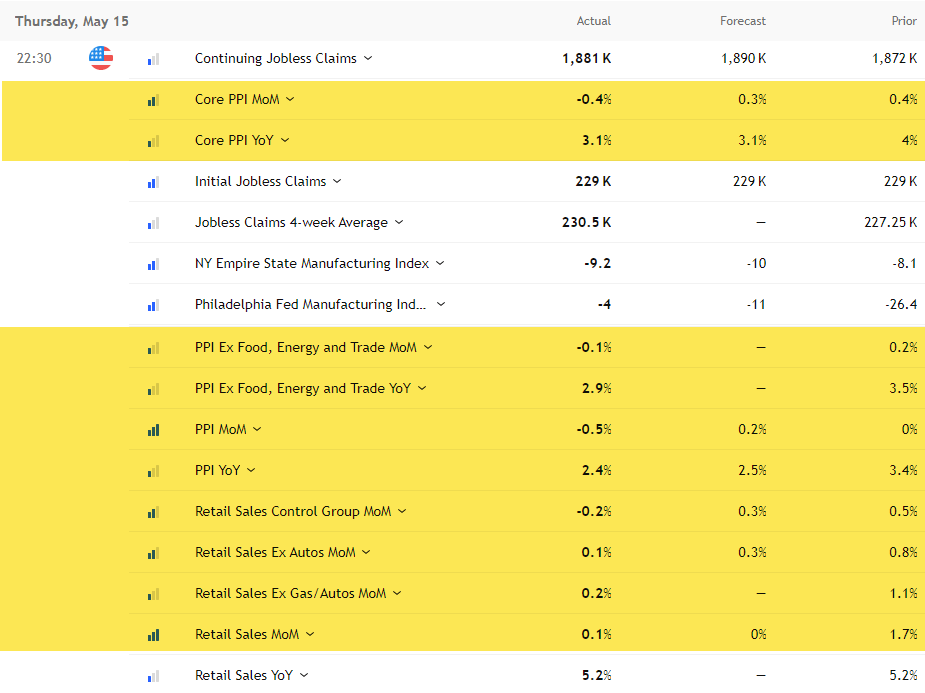
Treasury yields fell sharply overnight as a batch of weaker-than-expected U.S. data pointed to a cooling economy and firmer prospects for Fed rate cuts. The standout miss came from producer prices, with final demand PPI unexpectedly falling 0.5% in April—well below the 0.2% rise expected. It was the largest drop in over a year. Core readings also undershot, hinting upstream producers may be absorbing the impact of higher import tariffs, at least for now.
Factory output added to the gloom, slipping 0.4%—double the drop expected. The U.S. retail sales control group—which feeds into GDP calculations—slumped 0.2%, suggesting the threat of higher tariffs saw consumers bring forward spending into Q1. All up, the data painted a picture of flagging demand and weakening momentum at the start of Q2, increasing the risk the Fed may have to deliver a string of rate cuts should it begin to drag on the labour market.
Source: TradingView
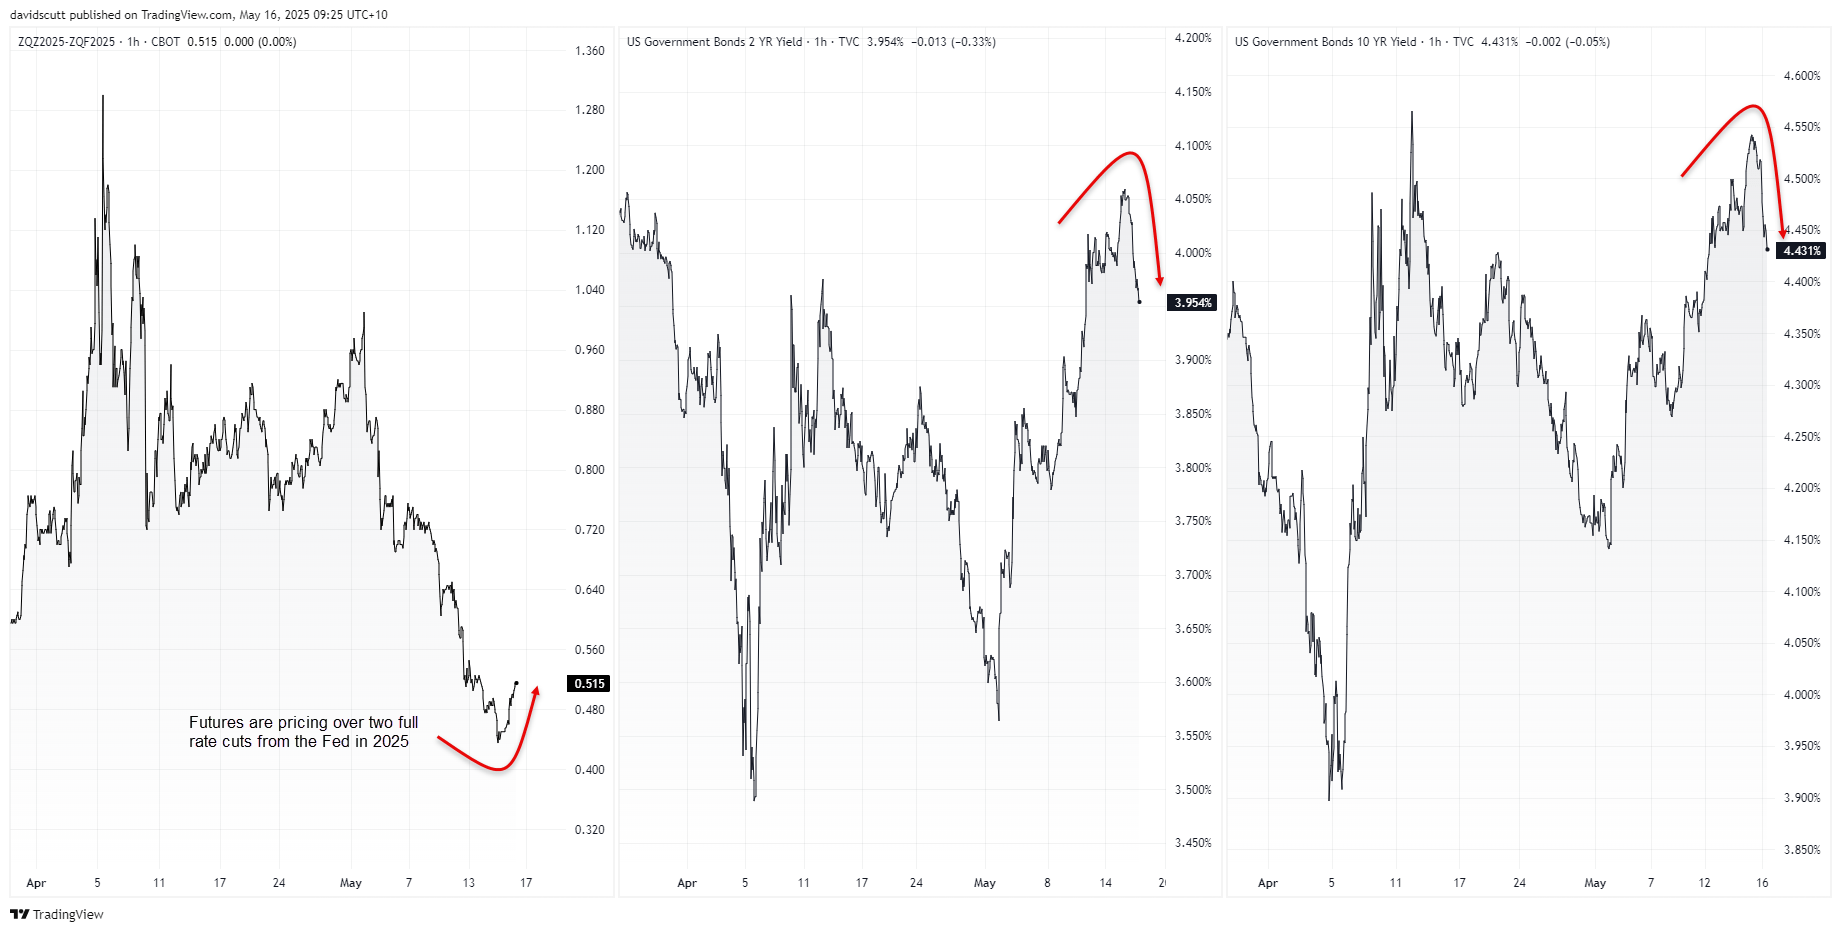
Rate markets were bid on the back of the data, with the 2-year yield tumbling over 9bps to dip below 4%, the 10-year down nearly 8bps to 4.45%, and the curve steepening modestly as traders priced in two Fed cuts this year—most likely starting in September. Equities didn’t need a second invitation to rally on the back of the rates move, led by cyclical sectors. Unusually, the FX universe showed little interest in the data, seemingly preferring to take its cues from technical rather than fundamental factors.
Outside of rates, the other big move on Thursday came from crude oil. WTI slid more than 2% as reports surfaced of a potential nuclear deal between the U.S. and Iran. A breakthrough could unlock sanctioned Iranian supply, giving oil bears fresh ammunition at a time when demand signals are softening.
USD/JPY Unwind Gathers Steam
Source: TradingView
USD/JPY remains one of the more interesting FX pairs out there right now, showing little relationship with traditional drivers like interest rate differentials and performance of riskier assets. Instead, technicals appear to be playing a bigger role in the yen’s movements, suggesting that should be the initial reference point for anyone contemplating setups involving the pair.
Having eked marginally into bullish territory, RSI (14) and MACD are now threatening to roll over, hinting momentum may be starting to shift to the downside. For now, both indicators sit in neutral territory, favouring a neutral bias that puts more emphasis on price action.
On the downside, levels to watch include 145, the uptrend dating back to the April lows, 144 and 141.65. Above, the 50DMA is found near 146 today—a level that has seen plenty of action over the past week. A break and close above the 50DMA may shift near-term directional risks higher, putting a potential retest of 148.70 on the table.
While Japanese Q1 GDP data will be released today, if recent form is any guide, it’s unlikely to deliver any meaningful market response. March quarter data looks like something from the distant past given how rapidly the macro environment is changing.
Crude Crunched on Possible Iran Deal
Source: TradingView
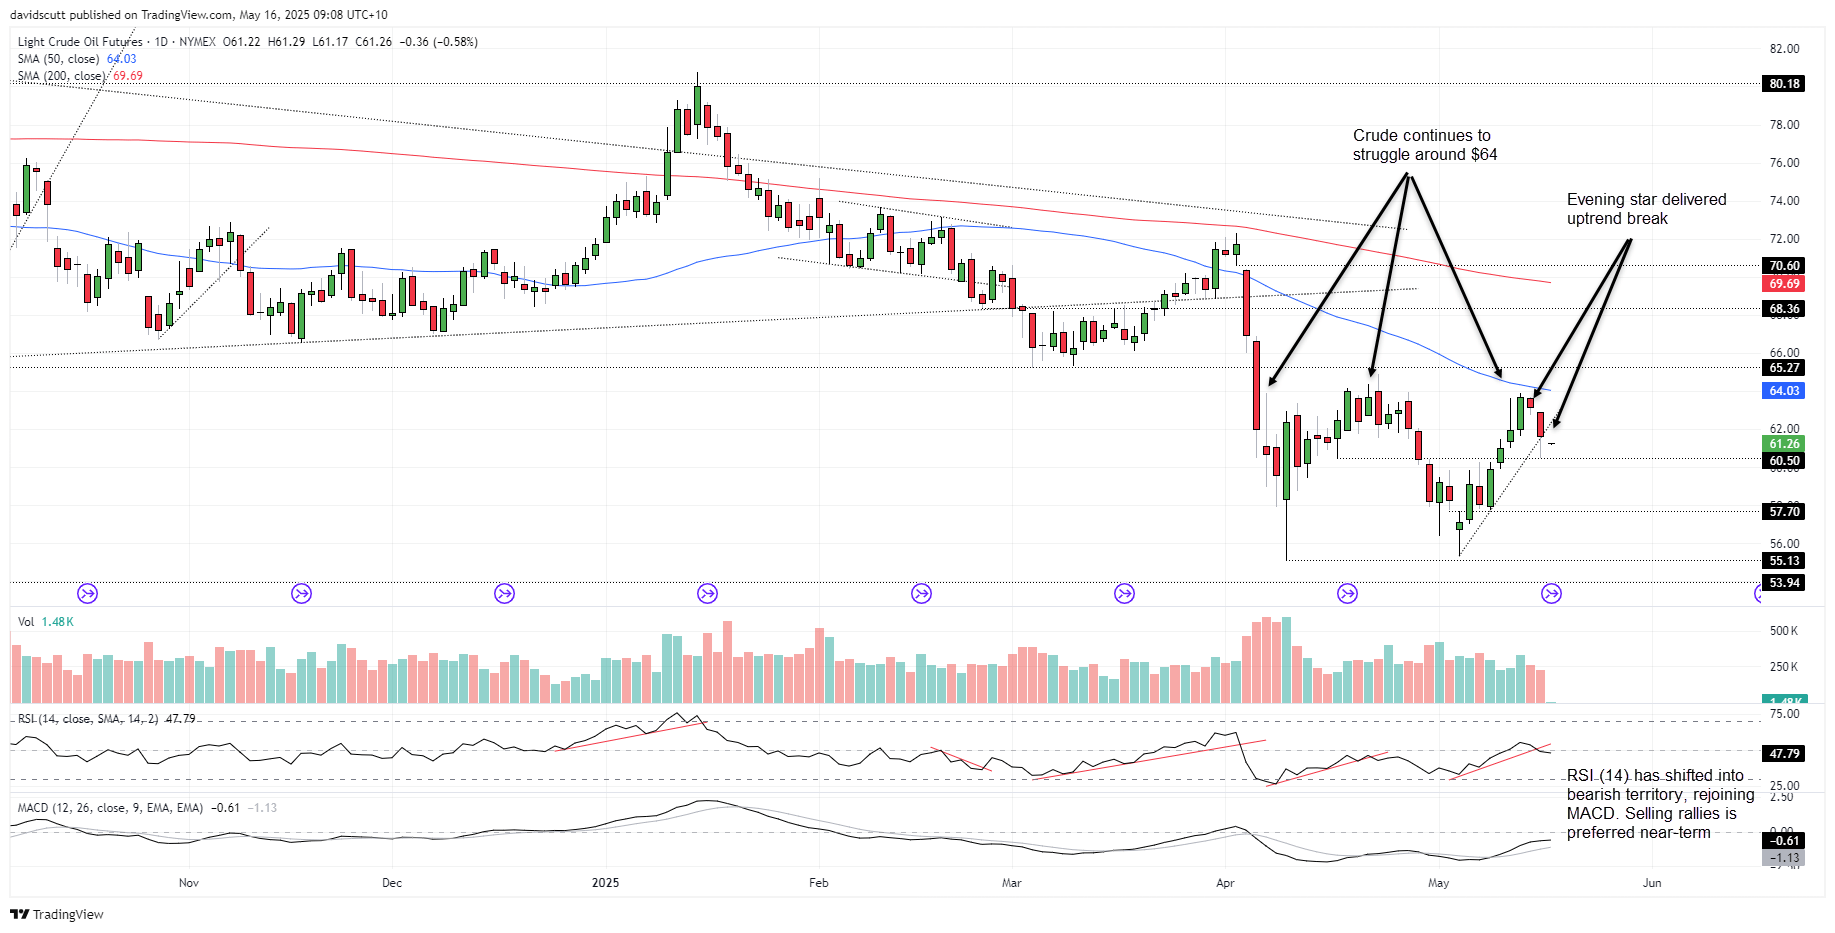
Crude oil delivered an obvious topping pattern on Thursday, completing a three-candle evening star while simultaneously breaking the uptrend dating back to the lows set on May 5. With momentum indicators looking heavy and shifting marginally into bearish territory, the bounce over the past fortnight may be on its last legs.
On the downside, $60.50, $57.70 and $55.13 are levels to watch. Above, crude has consistently struggled over the past month either side of $64, making it a level to watch should we see an unlikely squeeze higher.
Gold Bulls Deliver Powerful Signal
Source: TradingView
Gold staged a powerful bounce off the December 2024 uptrend on Thursday, erasing losses of nearly 2% to close up nearly 2%. The scale of the move leaves little doubt that bullion remains a buy-on-dips play for now, putting greater emphasis on upside levels than down as we move towards the weekend.
$3270 looms as a barrier for those looking to extend the bullish move, with a break of that level putting $3367 potentially on the table. On the downside, $3168 remains a relevant level with the uptrend and 50DMA located just beneath it.
Thursday’s thrust has seen RSI (14) break the downtrend it was sitting in, pushing it back to neutral territory. MACD continues to trend lower but remains well above zero, providing a combined momentum signal that leans marginally bullish overall. Price action carries more weight at this juncture.
Have a great weekend!
Scutty
-- Written by David Scutt
Follow David on Twitter @scutty
How to trade with City Index
You can trade with City Index by following these four easy steps:
- Open an account, or log in if you’re already a customer
• Open an account in the UK
• Open an account in Australia
• Open an account in Singapore
- Search for the market you want to trade in our award-winning platform
- Choose your position and size, and your stop and limit levels
- Place the trade
Related tags:
Latest market news




Open an account in minutes
Experience award-winning platforms with fast and secure execution, and enjoy tight spreads from 0.5 pts on FX and 0.3 pts on indices.
Economic calendar
Web Trader platform
Our sophisticated web-based platform is packed with features.
Related articles
USD/MXN Analysis: Is Super Peso Starting to Fade?
Over recent trading sessions, the Mexican peso has continued to show signs of weakness against the U.S. dollar. This can already be seen in USD/MXN, which has gained more than 1.7% over the last three sessions, highlighting sustained buying pressure in favor of the dollar in the short term.
Canadian Dollar Analysis: USD/CAD Returns to July Highs Ahead of NFP
The Canadian dollar continues to face one of its most challenging environments in recent months when it comes to maintaining strength against the U.S. dollar. The weakness of the Canadian currency is clearly reflected in USD/CAD, which has now recorded nine consecutive bullish sessions and gained more than 1.7% during that period.
Gold Price Forecast: XAU/USD Plunges 12.4% Toward Critical Support 10 1 2026
Softer inflation has revived expectations for a Fed pause, but Friday’s payrolls could put gold’s recovery prospects to the test.

This report is intended for general circulation only. It should not be construed as a recommendation, or an offer (or solicitation of an offer) to buy or sell any financial products. The information provided does not take into account your specific investment objectives, financial situation or particular needs. Before you act on any recommendation that may be contained in this report, independent advice ought to be sought from a financial adviser regarding the suitability of the investment product, taking into account your specific investment objectives, financial situation or particular needs.
StoneX Financial Pte. Ltd., may distribute reports produced by its respective foreign entities or affiliates within the StoneX group of companies or third parties pursuant to an arrangement under Regulation 32C of the Financial Advisers Regulations. Where the report is distributed to a person in Singapore who is not an accredited investor, expert investor or an institutional investor (as defined in the Securities Futures Act), StoneX Financial Pte. Ltd. accepts legal responsibility to such persons for the contents of the report only to the extent required by law. Singapore recipients should contact StoneX Financial Pte. Ltd. at 6826 9988 for matters arising from, or in connection with the report.
In the case of all other recipients of this report, to the extent permitted by applicable laws and regulations neither StoneX Financial Pte. Ltd. nor its associated companies will be responsible or liable for any loss or damage incurred arising out of, or in connection with, any use of the information contained in this report and all such liability is hereby expressly disclaimed. No representation or warranty is made, express or implied, that the content of this report is complete or accurate.
StoneX Financial Pte. Ltd. is not under any obligation to update this report.
Trading CFDs carries a high level of risk that may not be suitable for some investors. Consider your investment objectives, level of experience, financial resources, risk appetite and other relevant circumstances carefully. The possibility exists that you could lose some or all of your investments, including your initial deposits. If in doubt, please seek independent expert advice. Visit www.forex.com/en-sg/terms-and-policies for the complete Risk Disclosure Statement.