



Crude Oil Analysis: WTI barrel remains weak after OPEC+ announcements
Crude oil continues to face difficult trading sessions in the short term. Over the last 5 trading sessions on average, WTI remains down close to -3.5%, with consistent movements below the 70-dollar area. This continues to highlight a selling bias that has remained in place for several weeks.
Share this:

Crude oil continues to face difficult trading sessions in the short term. Over the last 5 trading sessions on average, WTI remains down close to -3.5%, with consistent movements below the 70-dollar area. This continues to highlight a selling bias that has remained in place for several weeks.
For now, price has struggled to show a consistent recovery, even after the latest announcements from OPEC+, which point to potential production increases. This dynamic could continue to weigh on demand around the barrel and maintain relevant selling pressure over the next few trading sessions.


New comments from OPEC+
On July 5, a virtual meeting took place among the main oil-producing countries that are part of OPEC+, one of the most relevant oil producer organizations in the world. In the general conclusions of the meeting, the group decided to resume its strategy of increasing daily oil production, with a new adjustment of 188 thousand additional barrels per day that would begin to apply from August 2026.
This measure is part of the strategy to continue removing the voluntary cuts established during 2023, allowing a larger amount of crude oil to enter the global market. Although the organization will meet again on August 2, it also mentioned that these measures are necessary in view of a possible reduction in the conflict in the Middle East and with the aim of stabilizing global production.
With this, it becomes clear that the organization remains focused on gradually increasing oil production and returning it to levels closer to normal, before the voluntary reductions of previous years began.
The event becomes relevant again because, despite the conflicts seen around the Strait of Hormuz during much of 2026, OPEC is expected to recover close to 30% of total global oil production by early 2027. This continues to position the organization as one of the most important players to watch, since any decision made by the group could have a relevant impact on crude oil production expectations over the coming months.
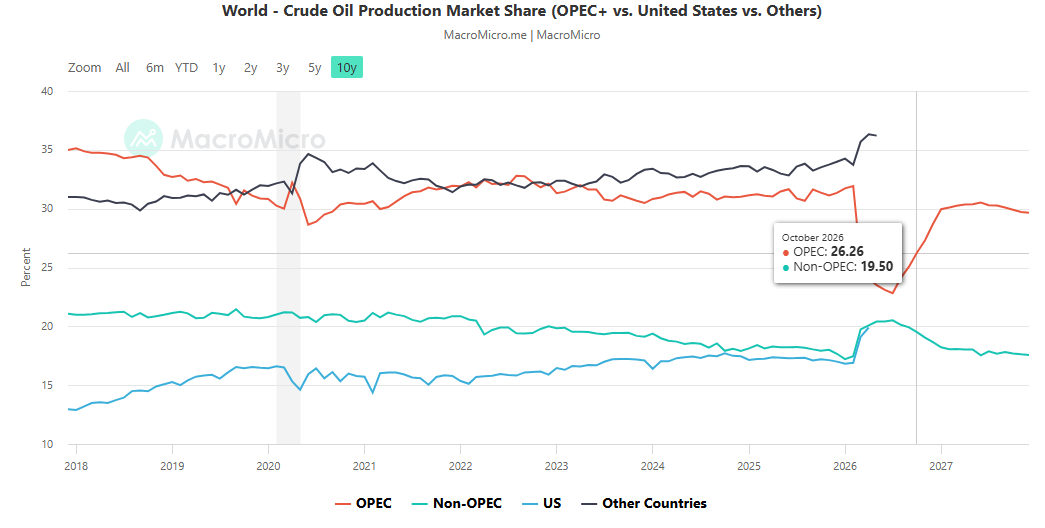
Source: Macromicro
Taking all of this into account, the dynamic of consistent production increases from one of the world’s most important producer blocs could continue to pressure the WTI barrel in the short term. As higher production is announced for August, greater availability of barrels could generate selling pressure on prices if demand does not manage to balance at the same pace.
If these announcements of relevant increases, which have been part of the OPEC+ agenda for months, continue to move forward, the risk of a potential crude oil oversupply scenario could remain an important factor for the market. This could also remain relevant for oil’s selling pressure over the coming trading weeks.
How is the situation in the Middle East evolving?
Now, the conflict situation in the Middle East continues with the United States and Iran negotiating indirectly. The most critical points of the talks remain focused on the Strait of Hormuz, through which more than 20% of global oil trade passes.
So far, there have been some advances, such as an initial agreement to open the strait and extensions of the suspension of military activities. However, there is still no official announcement regarding the signing of a more consistent peace agreement in the short term.
The important point here is that, although a final agreement has not yet been reached, the market has started to price in a lower risk premium in the oil barrel. Over the last few weeks, there have been no clear signs of additional escalation in the conflict, and the fact that both countries continue to hold steady negotiations has increased optimism around an eventual peace agreement.
For this reason, bearish pressure on the oil barrel has managed to remain in place, amid expectations of a possible normalization of the global trade situation.
However, oil has proven to be highly sensitive to this issue, which has acted as one of the main catalysts during 2026. The market remains subject to two scenarios. If the conflict extends and there are no clear signs of trade normalization, a forgotten bullish bias could become relevant again. But if calm points to a closer peace agreement and no new military risk scenarios emerge, this could reflect a normalization of supply activity and maintain significant selling pressure on WTI over the next few trading sessions.
Technical outlook for WTI
Source: StoneX, Tradingview
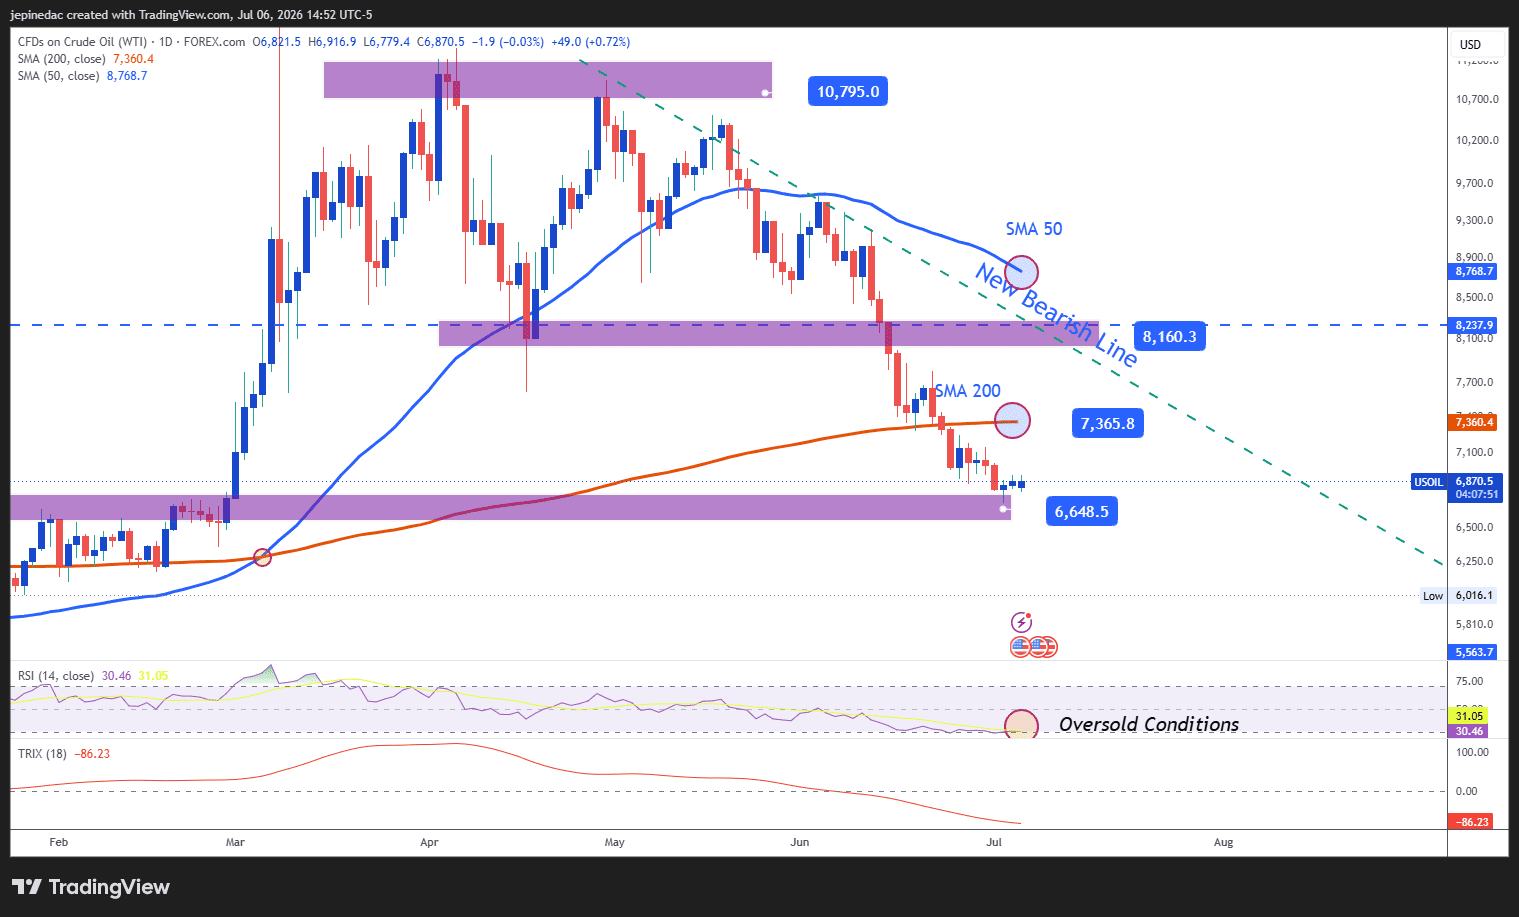
- Bearish trend line begins to dominate: Since the first days of May, average movements in the WTI barrel began to form a new medium-term bearish trend line. So far, given the lack of significant recoveries in oil prices, this structure remains the most important technical reference on the chart. If selling pressure continues to be relevant over the next few trading sessions, this bearish trend line could continue to guide price movements over the following trading weeks.
- RSI: Now, the RSI indicator continues to hold relevant movements below the neutral 50 line, reflecting the dominance of selling impulses in the market. However, the line remains close to the oversold level marked by the 30 area, which could indicate excessive selling pressure and open room for potential bullish corrections over the next few sessions.
- TRIX: The TRIX indicator line continues to show a consistent bearish slope below the neutral 0 level. This suggests that the average bearish strength of long-term exponential moving averages remains relevant. If this dynamic continues over the next few sessions, selling pressure could remain an important factor for the chart’s average movements over the following weeks.
Key levels:
- 81 USD – Relevant resistance: This zone remains an important bullish barrier and coincides with relevant retracements from previous weeks. If price manages to return near this level, it could begin to put the bearish trend line at risk and open room for a new buying bias in the medium term.
- 73 USD – Near-term barrier: This zone coincides with the barrier formed by the 200-period simple moving average. It could act as a tentative reference in the event of potential bullish corrections in the short term.
- 66 USD – Key support: This level corresponds to price lows not seen since February 2026 and currently represents the most important bearish barrier to watch. Consistent movements below this level could reinforce the idea of a dominant selling bias and open room for a relevant extension of the bearish trend line over the coming weeks.
Written by Julian Pineda, CFA, CMT – Market Analyst
Follow him on: @julianpineda25
Latest market news




Open an account in minutes
Experience award-winning platforms with fast and secure execution, and enjoy tight spreads from 0.5 pts on FX and 0.3 pts on indices.
Economic calendar
Web Trader platform
Our sophisticated web-based platform is packed with features.
Related articles
Crude Oil, DXY Outlook: Geopolitical Risks Halt Sell-Offs in the Dollar and Oil
The U.S. Dollar Index, Brent and WTI are rebounding from key support levels and oversold conditions after steep sell-offs. U.S.–Iran tensions, inflation risks and rate expectations remain in focus.


Silver's bullish breakout case builds as bond yields retreat
The Democratic blue wave has sent crude and Treasury yields sharply lower, improving the outlook for precious metals. With gold already breaking higher, could silver be next?


Gold Reclaims $4,000, Bulls Eye Reversal with Seasonality Tailwind
Gold futures rebound above $4,000 as falling US yields, improving sentiment and bullish seasonality raise hopes of a significant reversal.

This report is intended for general circulation only. It should not be construed as a recommendation, or an offer (or solicitation of an offer) to buy or sell any financial products. The information provided does not take into account your specific investment objectives, financial situation or particular needs. Before you act on any recommendation that may be contained in this report, independent advice ought to be sought from a financial adviser regarding the suitability of the investment product, taking into account your specific investment objectives, financial situation or particular needs.
StoneX Financial Pte. Ltd., may distribute reports produced by its respective foreign entities or affiliates within the StoneX group of companies or third parties pursuant to an arrangement under Regulation 32C of the Financial Advisers Regulations. Where the report is distributed to a person in Singapore who is not an accredited investor, expert investor or an institutional investor (as defined in the Securities Futures Act), StoneX Financial Pte. Ltd. accepts legal responsibility to such persons for the contents of the report only to the extent required by law. Singapore recipients should contact StoneX Financial Pte. Ltd. at 6826 9988 for matters arising from, or in connection with the report.
In the case of all other recipients of this report, to the extent permitted by applicable laws and regulations neither StoneX Financial Pte. Ltd. nor its associated companies will be responsible or liable for any loss or damage incurred arising out of, or in connection with, any use of the information contained in this report and all such liability is hereby expressly disclaimed. No representation or warranty is made, express or implied, that the content of this report is complete or accurate.
StoneX Financial Pte. Ltd. is not under any obligation to update this report.
Trading CFDs carries a high level of risk that may not be suitable for some investors. Consider your investment objectives, level of experience, financial resources, risk appetite and other relevant circumstances carefully. The possibility exists that you could lose some or all of your investments, including your initial deposits. If in doubt, please seek independent expert advice. Visit www.forex.com/en-sg/terms-and-policies for the complete Risk Disclosure Statement.