


Crude Oil Q2 2026 Outlook: Hormuz Risks Dominate WTI Price Forecasts
Crude Oil Q2 2026 Outlook: crude oil prices are entering Q2 2026 at a critical inflection point, with Brent and WTI forecasts increasingly driven by US–Middle East tensions and risks to the Strait of Hormuz.
Share this:
Crude oil prices are entering Q2 2026 at a critical inflection point, with Brent and WTI forecasts increasingly driven by US–Middle East tensions and risks to the Strait of Hormuz. As of March 27, 2026, oil prices remain elevated near the $100 range, reflecting persistent supply disruption fears, rising geopolitical risk premiums, and tightening global energy markets. This crude oil outlook explores key price scenarios, technical levels, and macro drivers shaping the oil market in the second quarter of 2026.
The Strait of Hormuz, a 21-mile chokepoint through which an estimated 20 million barrels per day, roughly 20% of global oil consumption, transits, has been effectively closed to most commercial shipping traffic since late February, triggering one of the most severe supply shocks in modern energy markets. The impact now extends beyond crude into natural gas, refined products, and fertilizers, amplifying inflationary pressures across global supply chains.
Where Prices Stand Today
As of this writing, Brent crude trades near $106 while WTI hovers around $100, supported by a combination of geopolitical risk premiums, force majeure declarations, and tightening LNG markets.
Brent has rallied sharply year-to-date, rebounding from early-year lows near $60 to above $100, outperforming traditional hedges and moving inversely to equities, with the S&P 500 down approximately 9% year-to-date.
Asia, and to a lesser extent Europe, remain at the epicenter of this shock. Several Asian economies rely on the Middle East for 60–80% of their crude imports, while Europe remains indirectly exposed through global LNG and refined product markets.
Macro Backdrop: From Energy Shock to Commodity Chain Reaction
Unlike previous cycles, the current oil market is not operating in isolation. The March 2026 escalation has introduced a multi-layered supply shock, with broader implications across:
• Energy markets (crude oil, LNG, refined fuels)
• Fertilizer supply chains (linked to natural gas flows)
• Agricultural production and food prices
• Shipping, freight, and insurance costs
The inclusion of fertilizers transforms this from an energy shock into a broader commodity chain reaction, extending inflation pressures from fuel into food. This shift increases the risk of a commodity-driven inflation regime, raising concerns around stagflation, where inflation remains elevated while growth slows.
With this critical confluence, traders are advised to manage risk in proportion to portfolio diversification, liquidity conditions, and gap risk, given the sensitivity of price action to ongoing developments and the heightened eagerness to capitalize on volatile market opportunities.
Key Events to Watch in Q2 2026
US–Iran Negotiations
Diplomatic developments remain the primary driver of sentiment:
- Alignment and de-escalation are likely to pressure crude lower while supporting global equities
- Continued divergence in narratives and war escalations would sustain upward pressure on oil and reinforce risk-off conditions
Strait of Hormuz Developments
- Extended disruption → structural supply shock
- Gradual reopening → delayed normalization in shipping flows and insurance premiums
Markets are repricing faster than physical supply chains can adjust, creating persistent dislocations between financial pricing and real-world flows.
Inflation and Macro Spillovers
Markets will closely monitor:
- US CPI and PCE data
- Treasury yields and inflation expectations
- US dollar strength
Persistent inflation driven by energy and fertilizer costs could delay monetary easing and weigh on global risk assets.
Crude Oil Q2 2026 Scenarios
Scenario 1: Escalation (Bullish Tail Risk)
- Extended disruption in the Strait of Hormuz
- Continued strikes on economic and energy infrastructure
- No diplomatic alignment between the US and Iran
- Potential WTI break above $115, targeting the $120–$150 range
This scenario appears most probable for April, given the recent involvement of the Houthis in the conflict. It reflects a high-volatility, supply-driven rally supported by hedging demand and tightening physical markets.
Scenario 2: Base Case (Volatility and Consolidation)
- Ongoing geopolitical uncertainty
- No full-scale disruption, but no resolution either
- Crude prices are expected to remain bullish range-bound with elevated volatility, reflecting headline-driven sentiment
- Resistance levels between $93 and $110, support between $88 and $75
The $75 level remains particularly significant, aligning with prior support during the 2025 Middle East escalation phase. This scenario reflects a transitional environment where energy markets outperform while broader risk assets remain sensitive to macro developments.
Scenario 3: De-escalation (Bearish Repricing)
- A diplomatic breakthrough and regional stabilization would likely unwind the geopolitical risk premium
- Technical trigger: sustained break below $75–$73
This scenario aligns with a disinflationary environment, easing pressure on central banks and supporting risk assets and global growth expectations.
Crude Oil Q2 2026 Outlook: Weekly Time Frame – Log Scale
Source: Trading view
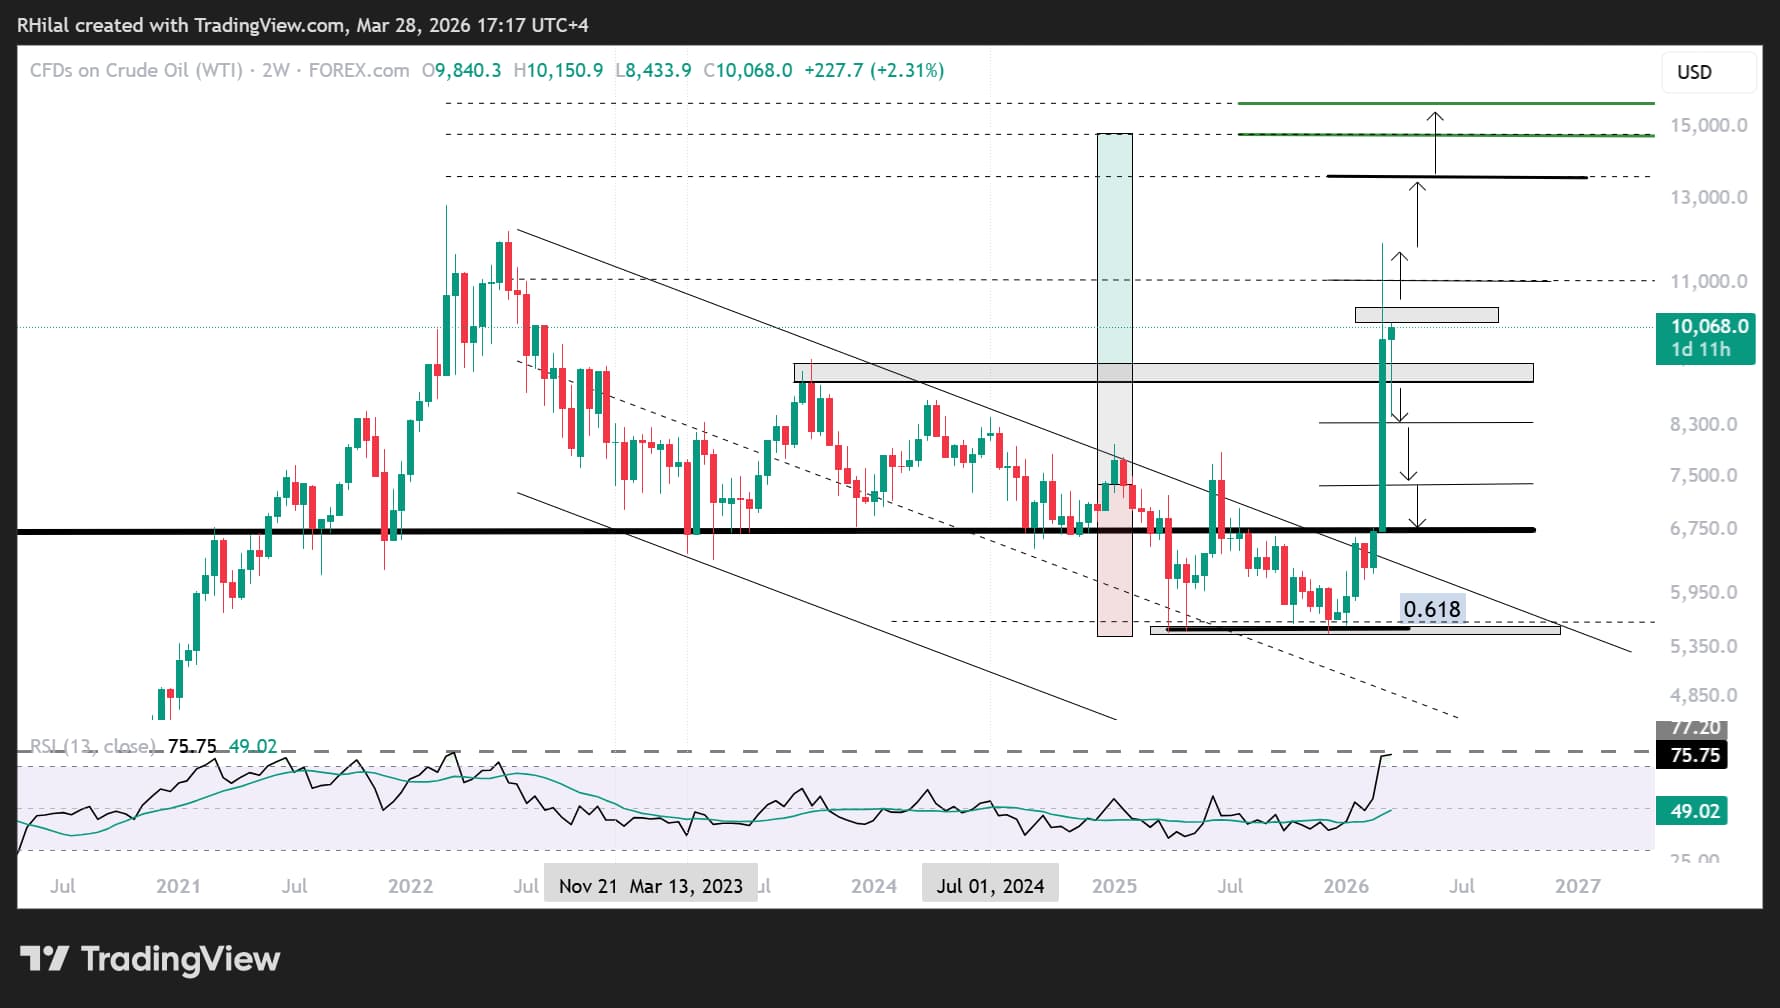
From a weekly perspective, crude oil price action is attempting to hold near the $100 mark while remaining above the September 2023 highs around $91, keeping risks tilted toward the bullish scenario.
A close above $105, $110, and $118 on WTI would extend upside projections toward the $135 and $157 zones, respectively. These levels are derived from Fibonacci extensions based on the 2020 lows, 2022 highs, and 2025 lows, defined with the monthly chart below.
Base Case Scenario
Current price action reflects ongoing ceasefire uncertainty, with fluctuations between the $100 and $80 levels. Continued uncertainty is expected to maintain consolidation, with resistance at $91, $93, and $105, and support at $89, $80, and $75.
The $75 level aligns with the highs of the 2025 Middle East escalation, acting as a key support during the initial pullback from the $120 zone, and is expected to remain relevant while the conflict persists.
Bearish Scenario
A sustained break below the $75–$73 zone, supported by clear de-escalation and firm diplomatic progress, would likely push prices toward the $66–$50 consolidation range, aligning with broader disinflation dynamics.
Crude Oil Q2 2026 Outlook: Monthly Time Frame – Log Scale
Source: Trading view
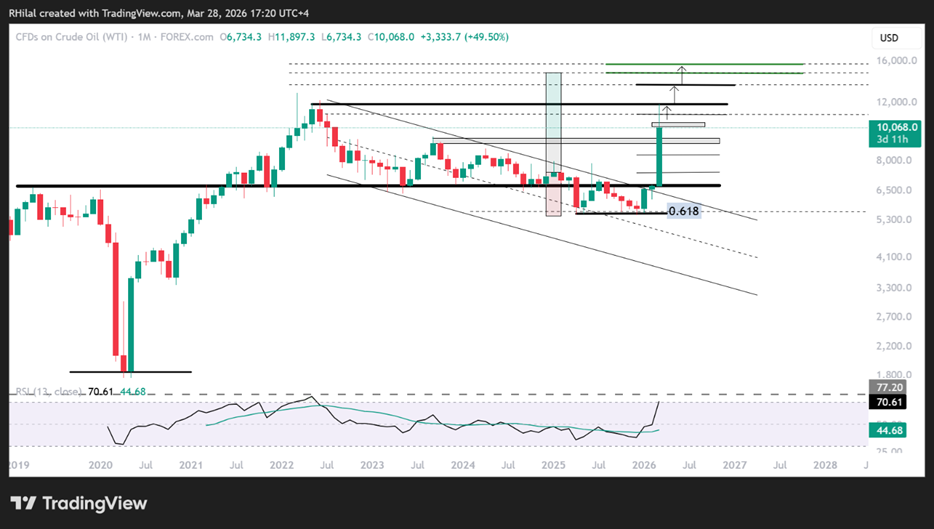
From a monthly perspective, crude oil initially broke below the 2019–2025 trendline in the second half of 2025, in line with the broader downtrend from the 2022 highs. Prices have since reclaimed this level and broken above the descending channel, supported by ongoing supply disruptions.
Using Fibonacci extensions based on the 2020 low, 2022 high, and 2025 low:
• 0.618 extension → $118 (recent high)
• 0.786 extension → $135
• Extension → $150–$157 (extended conflict scenario)
On the downside, a de-escalation-driven move could realign prices with the 2022–2026 downtrend channel, with the 0.618 retracement near $50 acting as a key long-term support.
Crude Oil Q2 2026 Outlook: 3-Month Time Frame – Log Scale
Source: Trading view
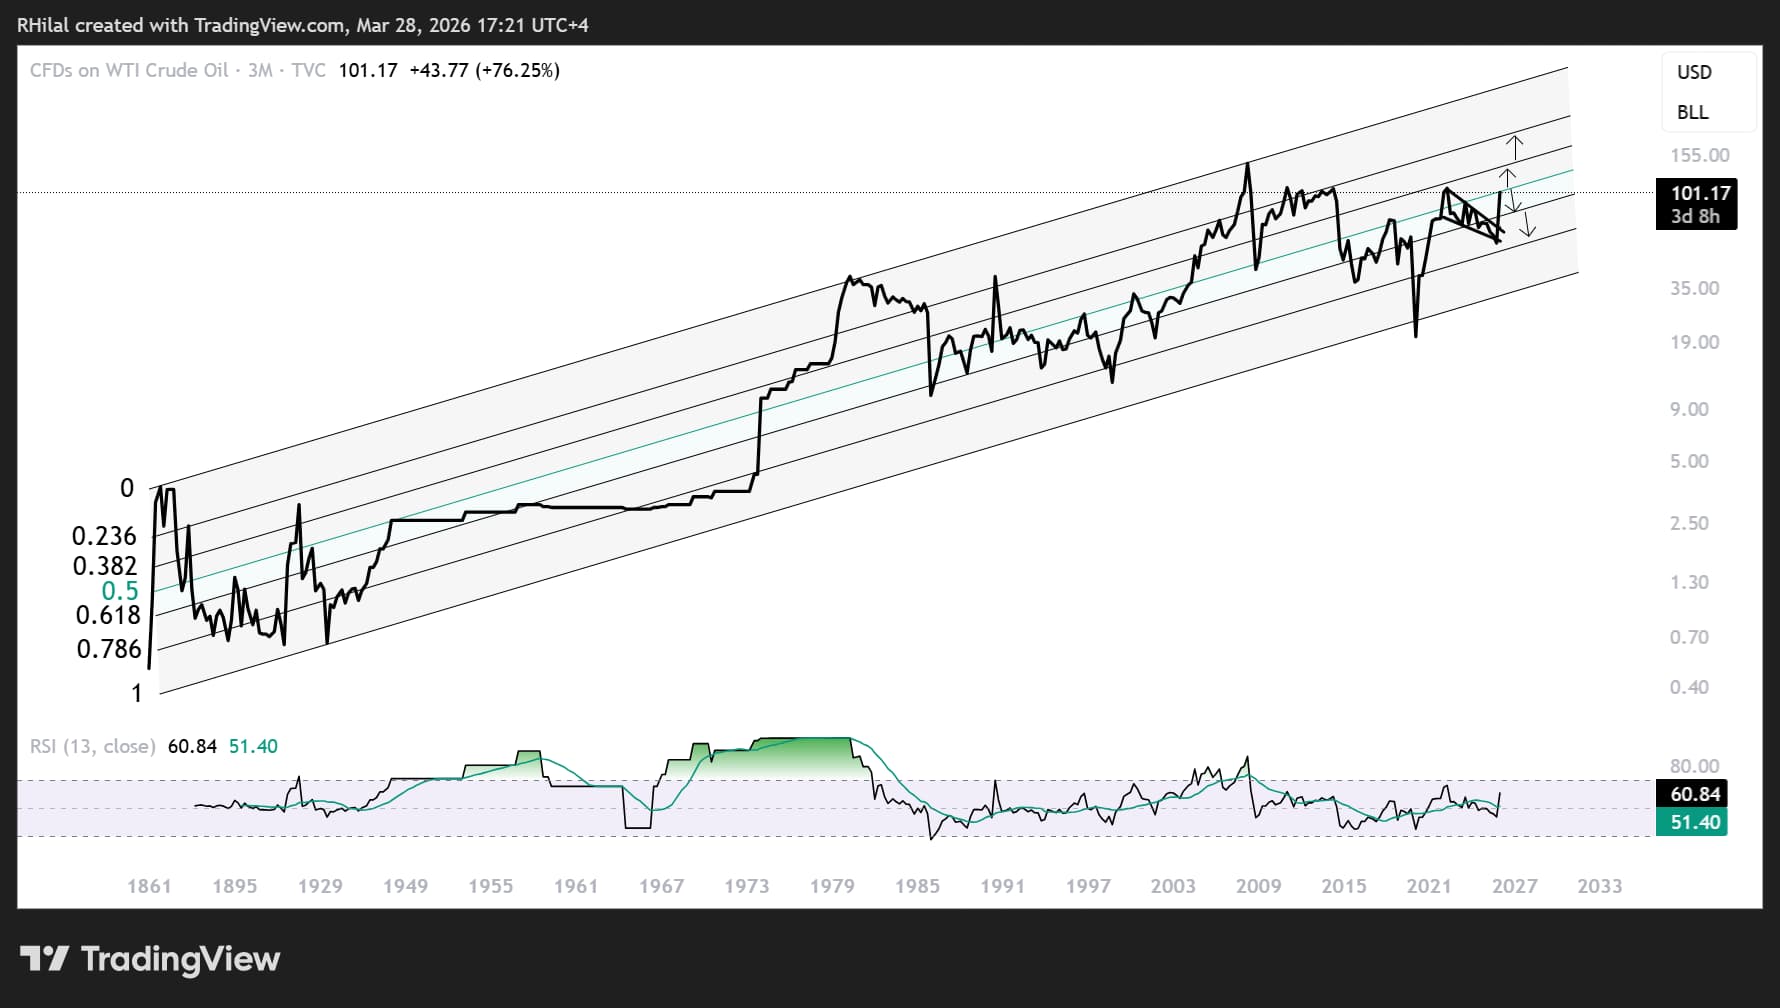
Finally, the 3-month chart highlights crude oil’s long-term trend since the 1860s, trading within a broad upward-sloping channel spanning over 160 years. A line chart is used here to emphasize closing price trends and reduce short-term volatility noise. The Fibonacci channel highlights key support and resistance levels across this timeframe.
The rebound from the April–December 2025 lows aligns with the 0.786 support level. The $80–$75 zone represents the 0.618 level, while the recent high near $118 aligns with the mid-channel 0.5 level.
Bullish Scenario:
The mid-channel zone near $118 acts as a key pivot. A sustained break above this level would extend projections toward $135, $157, and $200, signaling a potential structural shift in energy markets and increasing reliance on alternative energy sources. Markets are increasingly turning to EVs and fuel alternatives to navigate what could evolve into a prolonged upward trend in crude and broader energy markets. This scenario also raises margin risks for crude oil positions, similar to those observed in gold positions in early February.
Bearish Scenario:
A move back below the 0.618 zone near $80 would shift focus toward the $70–$50 range, suggesting an extended consolidation phase aligned with easing inflation pressures and the Trump administration’s agenda.
With multiple scenarios in play and sentiment driven by headlines, long-term trends and key levels remain essential to distinguish structural shifts from short-term noise, supporting defensive positioning and diversified trade setups in an uncertain market environment.
Written by Razan Hilal, CMT
Follow on X: @Rh_waves



Open an account in minutes
Experience award-winning platforms with fast and secure execution, and enjoy tight spreads from 0.5 pts on FX and 0.3 pts on indices.
Economic calendar
Web Trader platform
Our sophisticated web-based platform is packed with features.
Related articles
What Stretched 10-Year Yields Mean for Major Currency Pairs in Q4
U.S. 10-year Treasury yields are nearing a long-term resistance zone with overbought RSI readings, raising near-term pullback risk for the dollar.

USD/CAD shooting star puts September surge on notice
USD/CAD has printed a clear bearish reversal pattern after an extraordinary September surge, but confirmation may depend heavily on how US Treasury yields react to Friday’s payrolls report.


Gold Price Forecast: XAU/USD Plunges 12.4% Toward Critical Support 10 1 2026
Softer inflation has revived expectations for a Fed pause, but Friday’s payrolls could put gold’s recovery prospects to the test.

This report is intended for general circulation only. It should not be construed as a recommendation, or an offer (or solicitation of an offer) to buy or sell any financial products. The information provided does not take into account your specific investment objectives, financial situation or particular needs. Before you act on any recommendation that may be contained in this report, independent advice ought to be sought from a financial adviser regarding the suitability of the investment product, taking into account your specific investment objectives, financial situation or particular needs.
StoneX Financial Pte. Ltd., may distribute reports produced by its respective foreign entities or affiliates within the StoneX group of companies or third parties pursuant to an arrangement under Regulation 32C of the Financial Advisers Regulations. Where the report is distributed to a person in Singapore who is not an accredited investor, expert investor or an institutional investor (as defined in the Securities Futures Act), StoneX Financial Pte. Ltd. accepts legal responsibility to such persons for the contents of the report only to the extent required by law. Singapore recipients should contact StoneX Financial Pte. Ltd. at 6826 9988 for matters arising from, or in connection with the report.
In the case of all other recipients of this report, to the extent permitted by applicable laws and regulations neither StoneX Financial Pte. Ltd. nor its associated companies will be responsible or liable for any loss or damage incurred arising out of, or in connection with, any use of the information contained in this report and all such liability is hereby expressly disclaimed. No representation or warranty is made, express or implied, that the content of this report is complete or accurate.
StoneX Financial Pte. Ltd. is not under any obligation to update this report.
Trading CFDs carries a high level of risk that may not be suitable for some investors. Consider your investment objectives, level of experience, financial resources, risk appetite and other relevant circumstances carefully. The possibility exists that you could lose some or all of your investments, including your initial deposits. If in doubt, please seek independent expert advice. Visit www.forex.com/en-sg/terms-and-policies for the complete Risk Disclosure Statement.