



Crude Oil Update: WTI crude attempts to stabilize around the $90 level
Recent sessions have been quite volatile for WTI crude prices, as the price has fallen sharply below the $100 level, which had held at the beginning of the trading week. Currently, WTI is trading slightly above $90 per barrel, marking a decline of more than 13% during the latest trading session.
Share this:

Recent sessions have been quite volatile for WTI crude prices, as the price has fallen sharply below the $100 level, which had held at the beginning of the trading week. Currently, WTI is trading slightly above $90 per barrel, marking a decline of more than 13% during the latest trading session.
The strong selling pressure emerged after comments from Trump pointed to a potential truce in the Middle East conflict. However, more recent remarks do not fully support a clear end-of-conflict scenario, which has allowed the decline in prices to slow in the short term. In this context, as long as no concrete actions emerge to fully ease uncertainty, a bias of indecision may begin to dominate WTI price action in the coming sessions.


The temporary truce
After several weeks of escalation in the conflict, a two-week ceasefire was announced during yesterday’s session, along with the possibility of starting formal negotiations in the short term. While this does not imply a definitive peace scenario, it has been significant enough to reduce short-term uncertainty around oil supply.
This development triggered a sharp wave of selling pressure in crude prices, pushing WTI below the $100 level during the session.
However, it is important to note that the situation is not fully resolved. The Strait of Hormuz has not been fully reopened, and Iran has begun to partially restrict maritime traffic in response to attacks in Lebanon, suggesting that the truce could be fragile and only partially respected.
Although recent downside pressure is explained by the truce, the sustainability of this move will depend on whether it holds. If markets perceive a lack of real progress or persistent tensions, an uncertainty-driven scenario could re-emerge, favoring a phase of indecision in WTI prices in the coming sessions.
Is higher volatility expected?
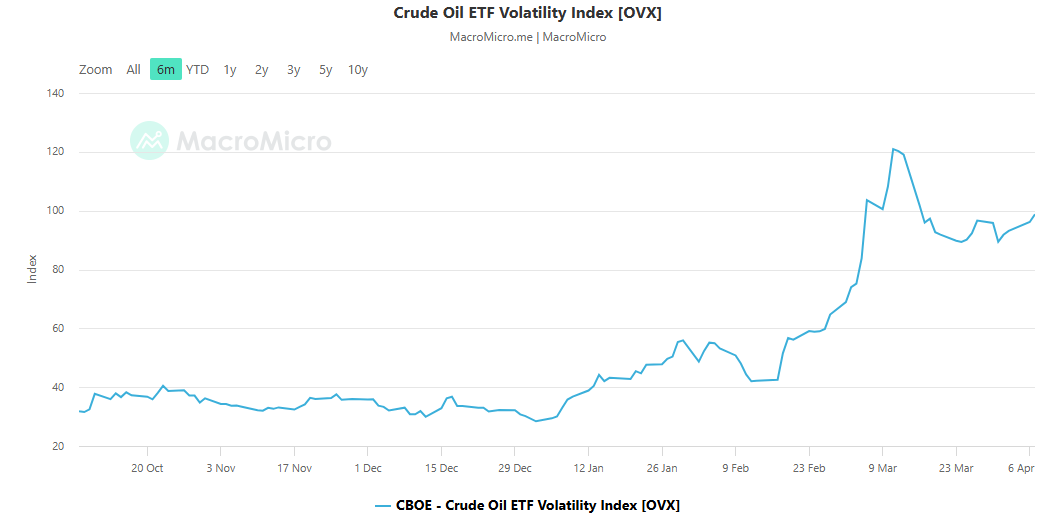
The OVX index, which measures implied volatility in oil options, remains a key reference. The indicator has declined from levels near 120 points, but still holds around 98 points, reflecting that expectations for volatility remain elevated.
Source: Macromicro
The fact that OVX remains at elevated levels suggests that the market continues to anticipate significant price sensitivity, maintaining a premium tied to geopolitical uncertainty. This implies that hedging demand has not disappeared and that oil prices could continue to show erratic movements.
In this context, as long as OVX remains elevated, a more pronounced indecision bias may develop in WTI, particularly as markets remain highly attentive to any new developments in the Middle East that could shift risk perception again.
WTI Technical Outlook
Source: StoneX, Tradingview
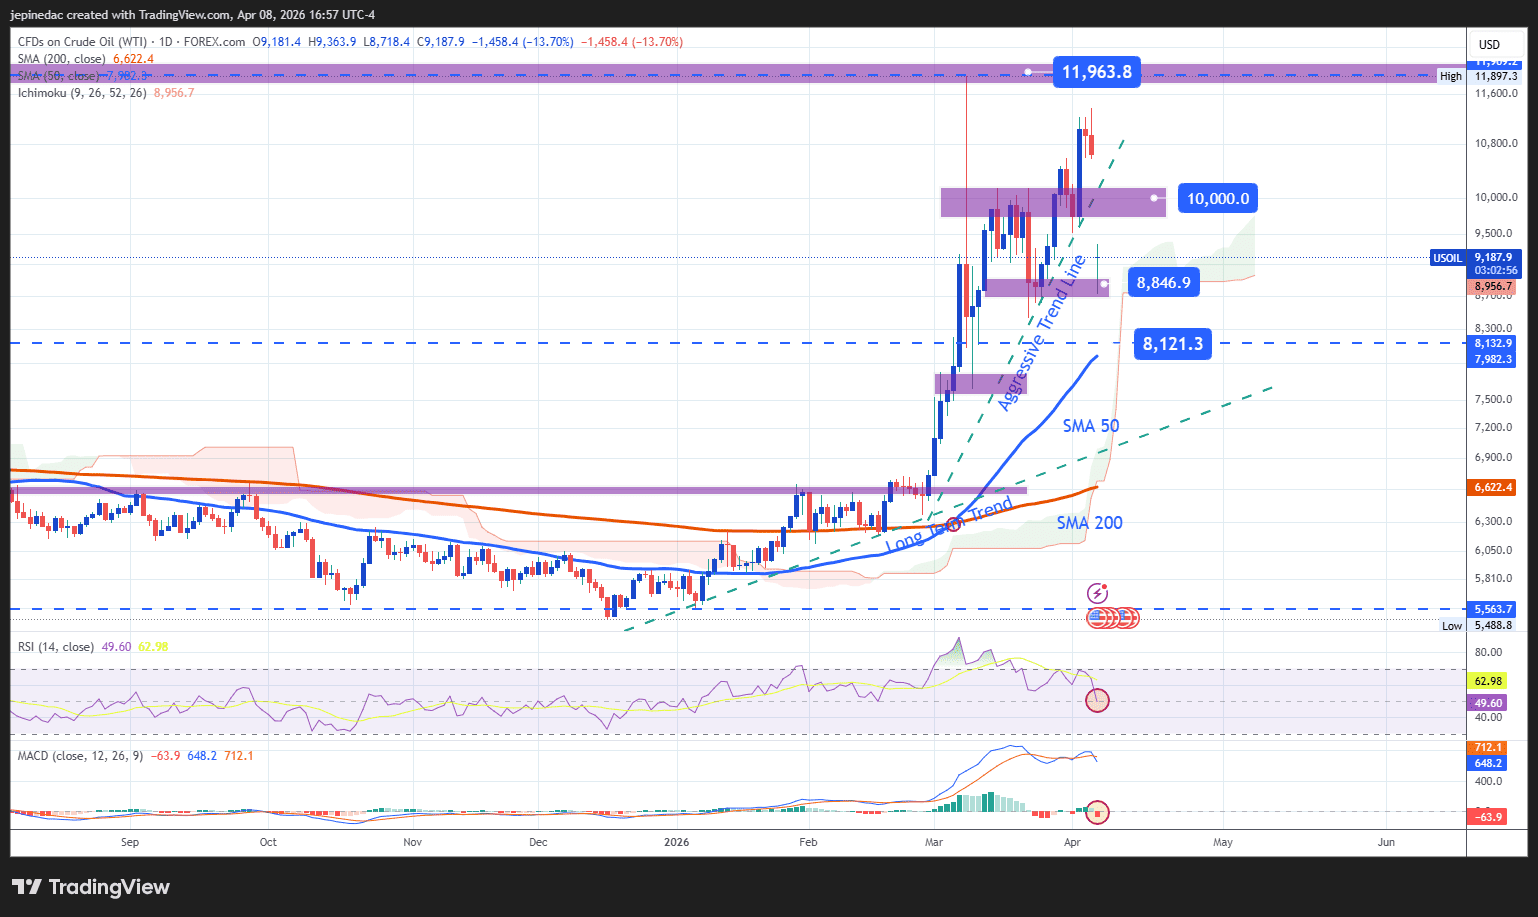
- Selling pressure emerges quickly: The latest session has been particularly relevant, as WTI broke below a short-term upward trendline and moved back toward the $88 support area. Although this move invalidates the recent bullish structure, the downside momentum is not yet strong enough to confirm a fully developed bearish trend. In fact, the price still remains within a broader long-term uptrend, in place since late 2025. Therefore, if selling pressure fails to consolidate, the market may transition into a broader phase of indecision, rather than a clearly defined bearish trend.
- RSI: The indicator has declined toward the 50 neutral level, reflecting a loss of bullish momentum. However, unless a deeper decline occurs, bearish dominance may not fully establish itself in the short term.
- MACD: The histogram remains slightly below the zero line, indicating some degree of selling pressure. However, as it remains close to neutral levels, a clear directional strength has not yet been confirmed, reinforcing the indecision scenario.
Key Levels:
- $100 – Key resistance: A critical psychological level. A sustained move above this zone could reinforce a more dominant bullish bias and extend the previous upward trend.
- $88 – Near-term barrier: A key neutral zone observed in recent sessions. Price action around this level could support a more consistent range-bound scenario in the short term.
- $80 – Key support: A recent low that also aligns with the 50-period moving average on the daily chart. A break below this level could signal a change in market structure and open the door to a new short-term bearish trend.
Written by Julian Pineda, CFA, CMT – Market Analyst
Follow him on: @julianpineda25
Latest market news




Open an account in minutes
Experience award-winning platforms with fast and secure execution, and enjoy tight spreads from 0.5 pts on FX and 0.3 pts on indices.
Economic calendar
Web Trader platform
Our sophisticated web-based platform is packed with features.
Related articles

Crude Oil, DXY Outlook: Geopolitical Risks Halt Sell-Offs in the Dollar and Oil
The U.S. Dollar Index, Brent and WTI are rebounding from key support levels and oversold conditions after steep sell-offs. U.S.–Iran tensions, inflation risks and rate expectations remain in focus.


Silver's bullish breakout case builds as bond yields retreat
The Democratic blue wave has sent crude and Treasury yields sharply lower, improving the outlook for precious metals. With gold already breaking higher, could silver be next?


Gold Reclaims $4,000, Bulls Eye Reversal with Seasonality Tailwind
Gold futures rebound above $4,000 as falling US yields, improving sentiment and bullish seasonality raise hopes of a significant reversal.

This report is intended for general circulation only. It should not be construed as a recommendation, or an offer (or solicitation of an offer) to buy or sell any financial products. The information provided does not take into account your specific investment objectives, financial situation or particular needs. Before you act on any recommendation that may be contained in this report, independent advice ought to be sought from a financial adviser regarding the suitability of the investment product, taking into account your specific investment objectives, financial situation or particular needs.
StoneX Financial Pte. Ltd., may distribute reports produced by its respective foreign entities or affiliates within the StoneX group of companies or third parties pursuant to an arrangement under Regulation 32C of the Financial Advisers Regulations. Where the report is distributed to a person in Singapore who is not an accredited investor, expert investor or an institutional investor (as defined in the Securities Futures Act), StoneX Financial Pte. Ltd. accepts legal responsibility to such persons for the contents of the report only to the extent required by law. Singapore recipients should contact StoneX Financial Pte. Ltd. at 6826 9988 for matters arising from, or in connection with the report.
In the case of all other recipients of this report, to the extent permitted by applicable laws and regulations neither StoneX Financial Pte. Ltd. nor its associated companies will be responsible or liable for any loss or damage incurred arising out of, or in connection with, any use of the information contained in this report and all such liability is hereby expressly disclaimed. No representation or warranty is made, express or implied, that the content of this report is complete or accurate.
StoneX Financial Pte. Ltd. is not under any obligation to update this report.
Trading CFDs carries a high level of risk that may not be suitable for some investors. Consider your investment objectives, level of experience, financial resources, risk appetite and other relevant circumstances carefully. The possibility exists that you could lose some or all of your investments, including your initial deposits. If in doubt, please seek independent expert advice. Visit www.forex.com/en-sg/terms-and-policies for the complete Risk Disclosure Statement.