



Crude Oil Weekly Outlook: Hormuz Risks, Key Levels to Watch
Crude oil Weekly Outlook: Crude oil remains supported as markets balance recovering supply against persistent Strait of Hormuz risks. Key WTI levels define escalation and de-escalation scenarios.
Share this:

Crude oil's technical structure remains tilted to the upside, while geopolitical uncertainty continues to cloud the broader outlook. Markets are balancing recovering supply against persistent uncertainty surrounding the future governance and security of the Strait of Hormuz, helping keep a geopolitical risk premium embedded in energy prices.
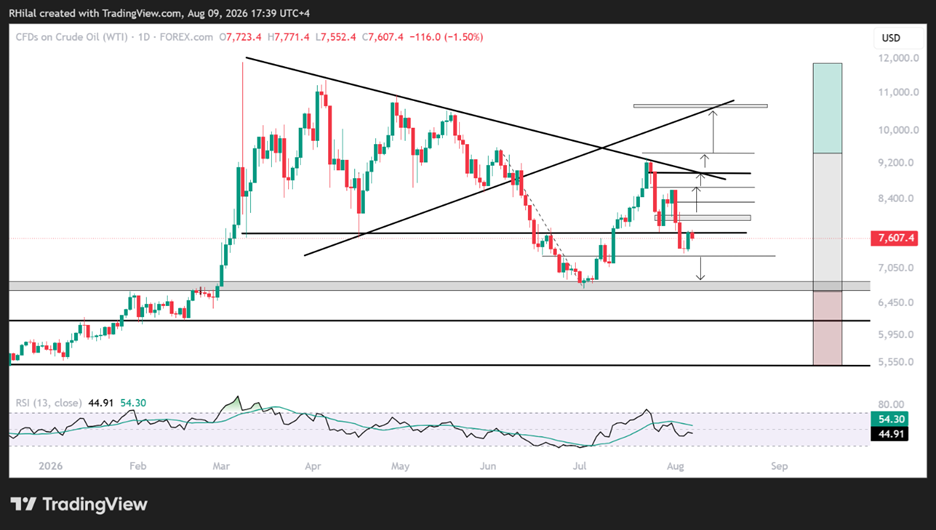
Key technical levels remain in focus:
- WTI crude oil continues to hold above short-term support near $72, with longer-term support concentrated around the $66.50–68 region.
- Brent crude oil continues to hold above the $77 region, with longer-term support concentrated around the $70 region, maintaining the broader geopolitical risk premium embedded in energy markets.
The main geopolitical uncertainty continues to revolve around the future administration and security framework of the Strait of Hormuz. Iran's demands surrounding transit arrangements, potential tolls, reconstruction costs and broader concessions have raised the bar for a lasting agreement, while President Trump has signalled a willingness to move away from the conflict without securing a broader nuclear agreement if the strait is fully reopened.
This content was created by an affiliate of FOREX.com and represents the views and opinions of the author/speakers, not the views and opinions of Forex.com, StoneX Group Inc., or its subsidiaries. The content has not been independently reviewed by Forex.com.
As these negotiations unfold, a durable framework governing the strait remains critical to restoring longer-term energy market security. As discussed in my previous article, the current environment may draw parallels with historical energy shocks such as the 1973 oil embargo, when geopolitical risk premiums remained elevated until longer-term political and energy-security arrangements helped restore confidence. Crude Oil Outlook: What the 1973 Oil Embargo Tells Us About the 2026 Hormuz Crisis
For markets, however, the direction of price action remains more important than individual geopolitical headlines.
Escalation and de-escalation scenarios should ultimately be reflected in crude oil prices, providing not only potential trading setups but also an important signal for broader intermarket analysis, as changes in energy risk premiums ripple through inflation expectations, bond yields, currencies and global risk sentiment.
The macro backdrop has also shifted following the latest US NFP report, which came in materially weaker than expected at -23k and helped push expectations for a September Federal Reserve rate hike back below 50%. This came despite stronger ISM manufacturing and services indicators pointing to continued economic expansion.
Attention now turns to next week's US CPI report. An upside inflation surprise could revive expectations for additional Fed tightening, particularly if elevated energy prices continue to reinforce inflationary pressures. Conversely, softer inflation alongside weaker labour-market conditions could further reduce expectations for a September hike and improve broader risk sentiment.
Against this backdrop, crude oil remains one of the clearest market gauges for distinguishing between another phase of geopolitical escalation and a more durable transition toward de-escalation.
Crude Oil Price Outlook: Weekly Time Frame – Log Scale
Source: Trading view
WTI crude oil's latest pullback found support at $72, corresponding to the 78.6% Fibonacci retracement of July's advance. Persistent US-Iran tensions helped stabilize prices above that level.
Price action continues to hold above the 70-72 zone, reinforcing risk premium and the broader bullish structure. A sustained move above $77, the multi month support since March 2026 tunred into resistance would expose the next Fibonacci extension levels from July's advance:
- $80.40 – 27.2% Fibonacci extension.
- $83.30 – 38.2% Fibonacci extension
- $86.50 – 50% Fibonacci extension
- $89.60 – 61.8% Fibonacci extension and major zone for a pullback risk given the realignment with the multi-month trendline spanning from the lower bound of the march-June consolidation that gave way to the latest July selloff between 93-77
Such a move would likely coincide with Persistent Hormuz tensions and crude oil refinery strikes, where a sustained hold above the86.50-89 zone prices in another escalation phase for the markets and drawdown risks.
Bearish Scenario
Should crude oil fall back below $72, attention would immediately shift to the $68-66.50 support zone, This area continues to define the broader escalation versus de-escalation narrative for 2026, having repeatedly acted as both support and resistance since 2019. A weekly close below $66.50 would expose the 2026 lows near $55, suggesting markets are beginning to price a longer-term geopolitical de-escalation scenario. Such a development would likely support broader risk appetite across financial markets while easing inflationary pressures.
Written by Razan Hilal, CMT
Follow on X: @rh_waves
Latest market news




Open an account in minutes
Experience award-winning platforms with fast and secure execution, and enjoy tight spreads from 0.5 pts on FX and 0.3 pts on indices.
Economic calendar
Web Trader platform
Our sophisticated web-based platform is packed with features.
Related articles
Swiss Franc Forecast: USD/CHF Seven-Week Rally Reverses From Yearly Highs 10 16 2026
A sharp rejection from fresh highs has shifted momentum in favor of USD/CHF bears, raising the stakes for a critical support test.
S&P 500 Forecast: SPX set for a weekly decline led lower by tech as AI worries linger
U.S. stocks have opened mixed as investors continue to worry about the financing behind the AI trade while also looking ahead to more earnings next week.

EUR/USD, GBP/USD Price Outlook: Can the Dollar Pullback Fuel a Bullish Rebound?
Could EUR/USD and GBP/USD be confirming a bullish rebound? The DXY’s pullback from the 103 resistance level may support a recovery in both pairs, although confirmation is still needed.
This report is intended for general circulation only. It should not be construed as a recommendation, or an offer (or solicitation of an offer) to buy or sell any financial products. The information provided does not take into account your specific investment objectives, financial situation or particular needs. Before you act on any recommendation that may be contained in this report, independent advice ought to be sought from a financial adviser regarding the suitability of the investment product, taking into account your specific investment objectives, financial situation or particular needs.
StoneX Financial Pte. Ltd., may distribute reports produced by its respective foreign entities or affiliates within the StoneX group of companies or third parties pursuant to an arrangement under Regulation 32C of the Financial Advisers Regulations. Where the report is distributed to a person in Singapore who is not an accredited investor, expert investor or an institutional investor (as defined in the Securities Futures Act), StoneX Financial Pte. Ltd. accepts legal responsibility to such persons for the contents of the report only to the extent required by law. Singapore recipients should contact StoneX Financial Pte. Ltd. at 6826 9988 for matters arising from, or in connection with the report.
In the case of all other recipients of this report, to the extent permitted by applicable laws and regulations neither StoneX Financial Pte. Ltd. nor its associated companies will be responsible or liable for any loss or damage incurred arising out of, or in connection with, any use of the information contained in this report and all such liability is hereby expressly disclaimed. No representation or warranty is made, express or implied, that the content of this report is complete or accurate.
StoneX Financial Pte. Ltd. is not under any obligation to update this report.
Trading CFDs carries a high level of risk that may not be suitable for some investors. Consider your investment objectives, level of experience, financial resources, risk appetite and other relevant circumstances carefully. The possibility exists that you could lose some or all of your investments, including your initial deposits. If in doubt, please seek independent expert advice. Visit www.forex.com/en-sg/terms-and-policies for the complete Risk Disclosure Statement.