



EUR/USD, GBP/USD Price Outlook: Can the Dollar Pullback Fuel a Bullish Rebound?
Could EUR/USD and GBP/USD be confirming a bullish rebound? The DXY’s pullback from the 103 resistance level may support a recovery in both pairs, although confirmation is still needed.
Share this:

The intermarket setup I’m watching includes:
-
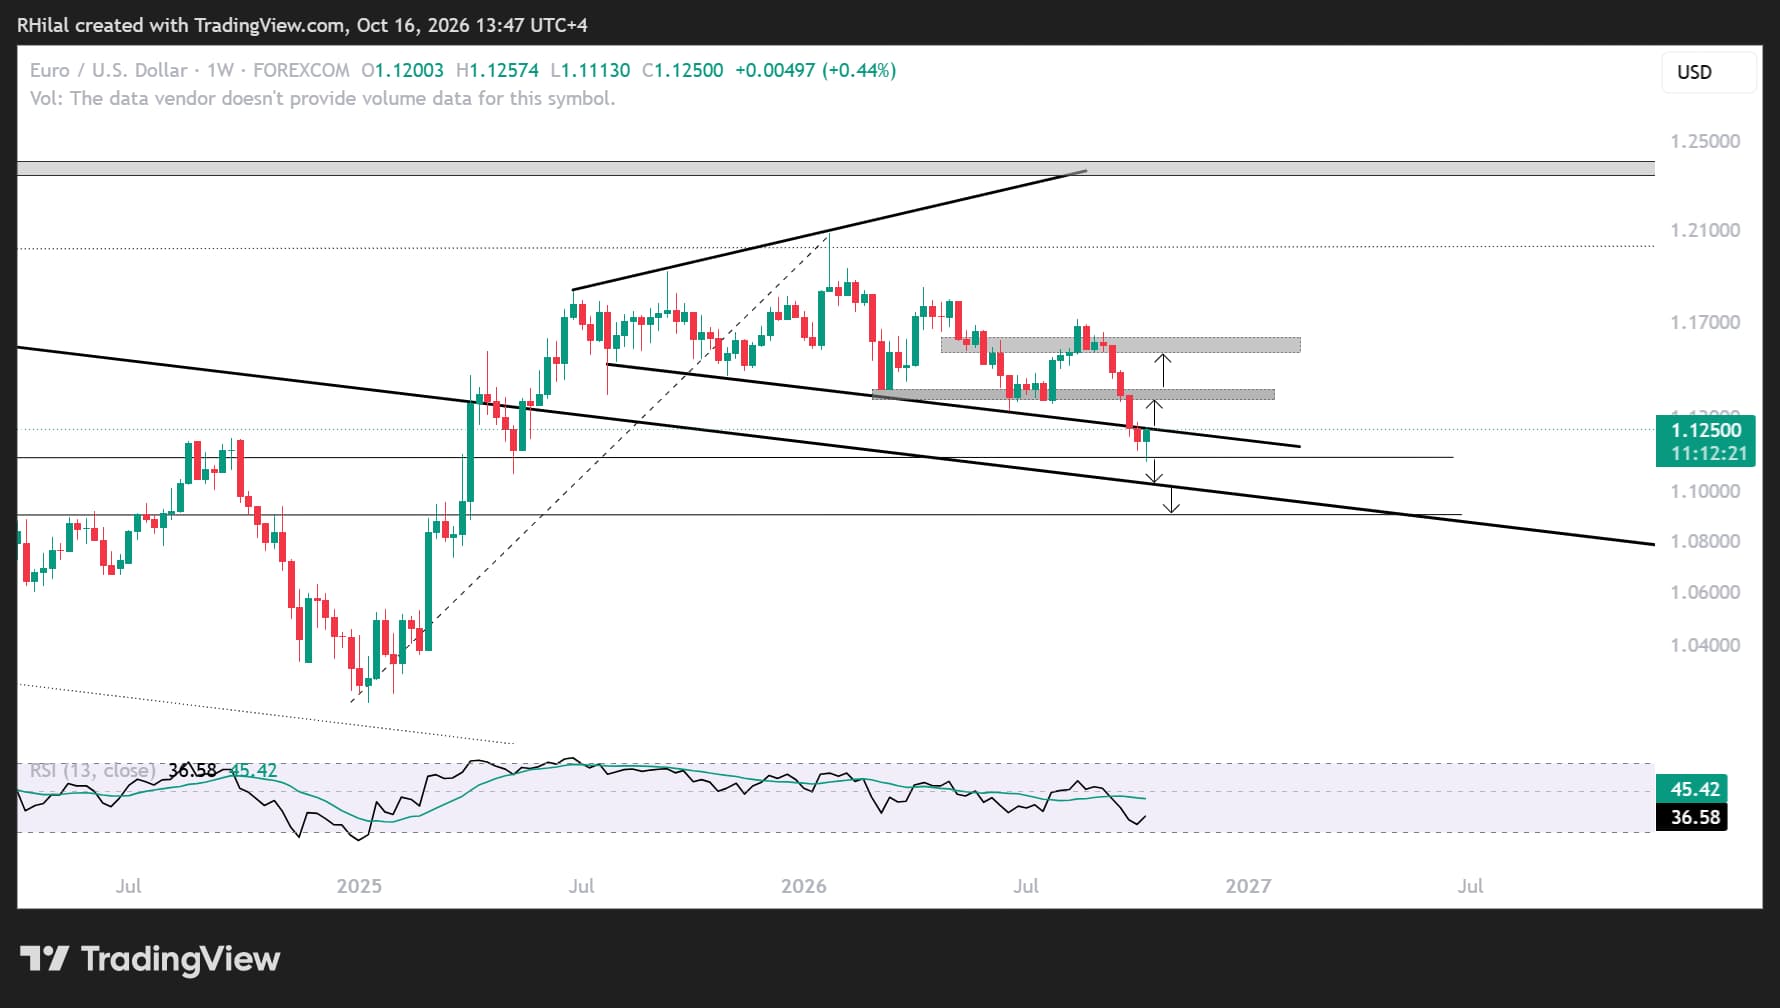
EUR/USD holding above the psychological 1.11 support level, alongside a daily RSI rebound from oversold conditions last seen in 2015. The recovery remains restrained below 1.1260.
-
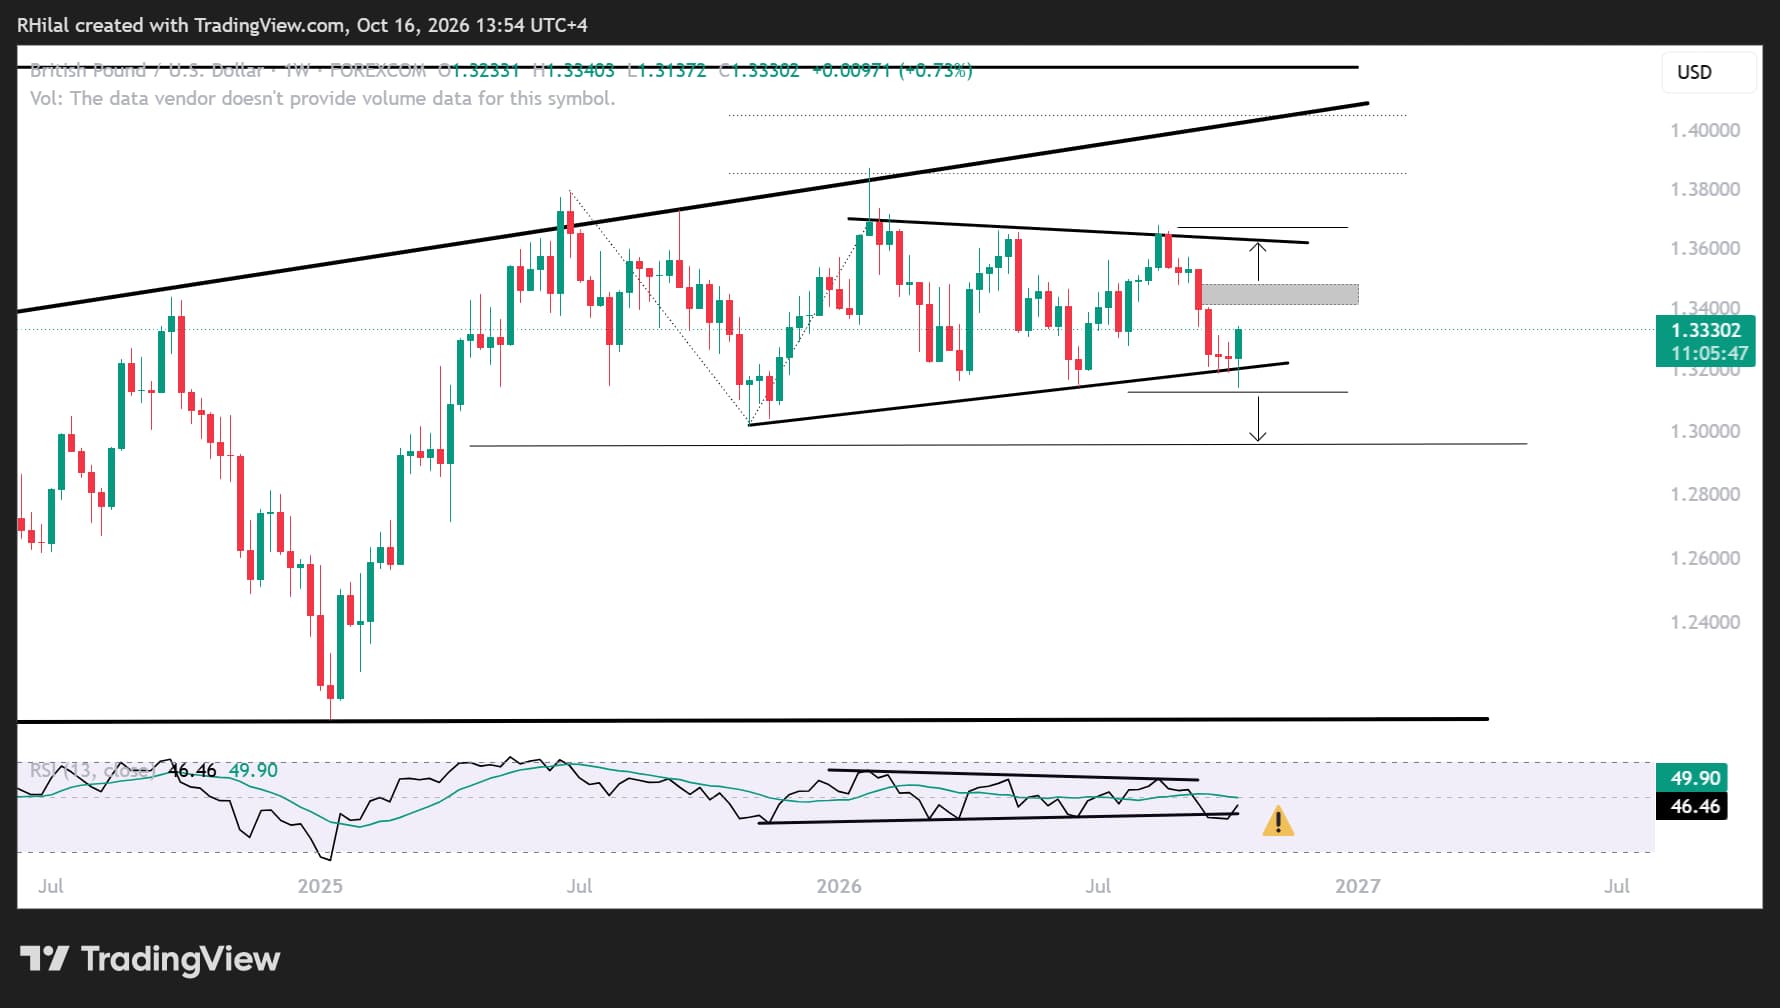
GBP/USD holding above the 1.3130 support and within the boundaries of a sideways consolidation that has been in place since November 2025.
-
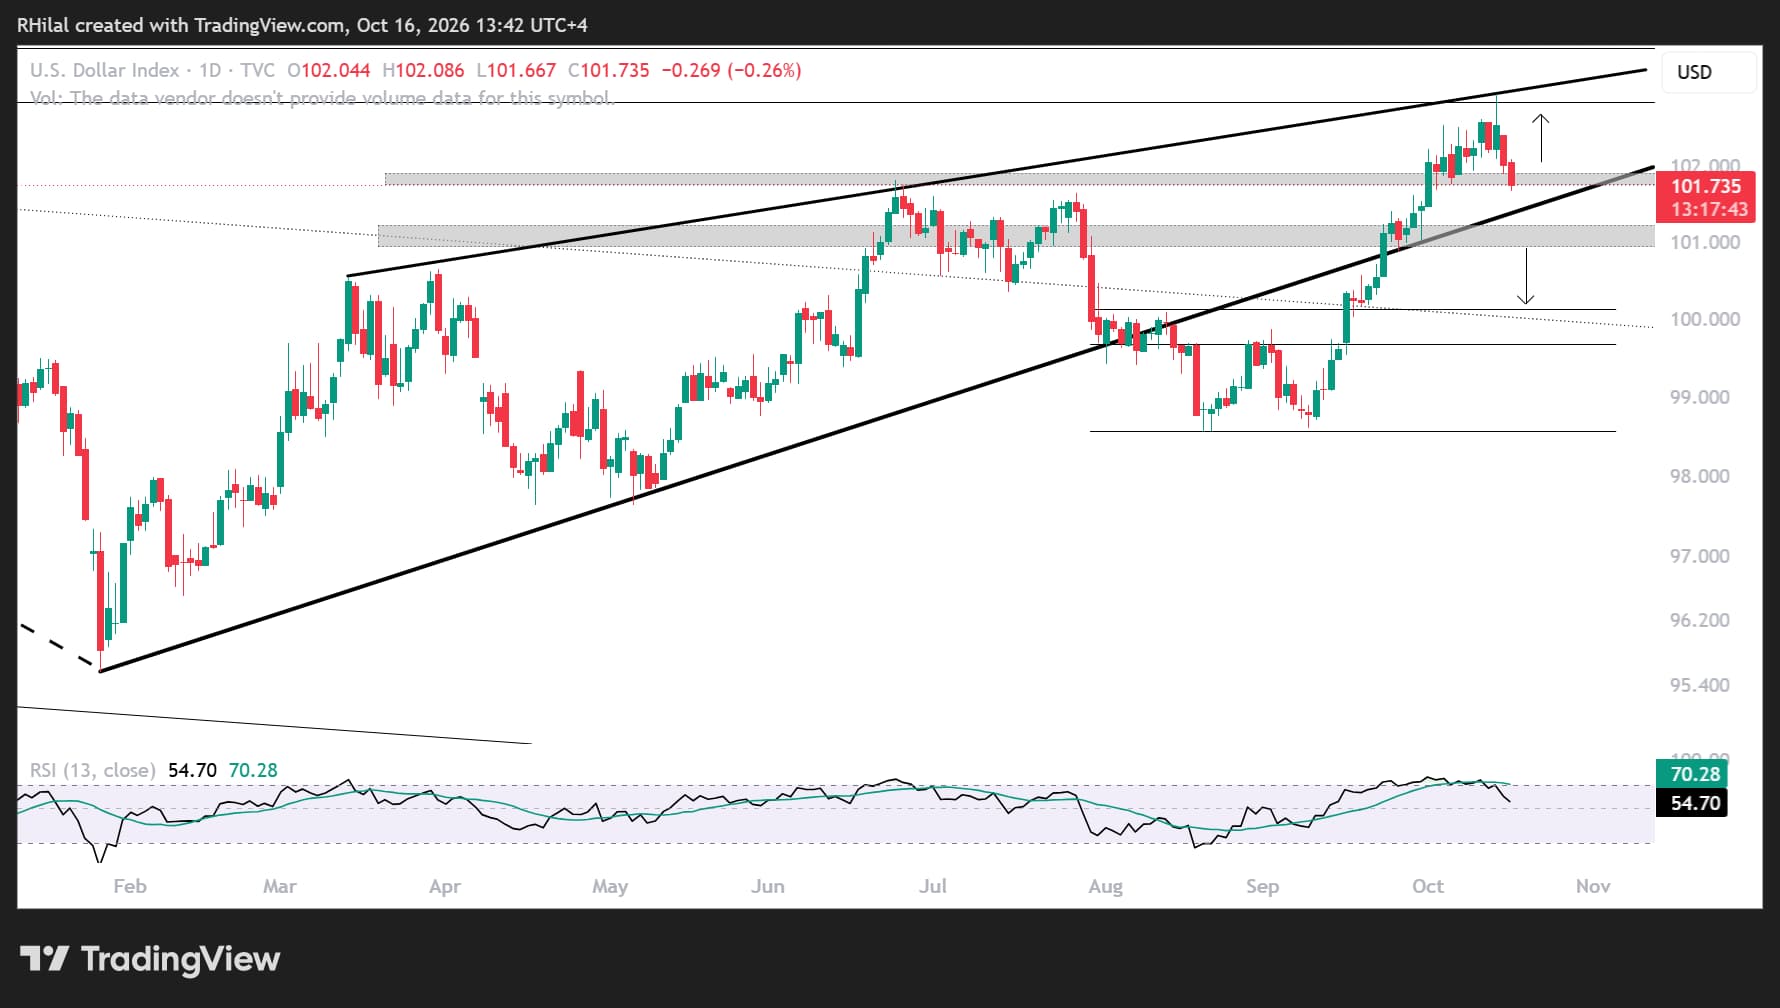
The DXY pulling back from an 8-month resistance and the psychological 103 level after daily RSI reached overbought conditions last seen in 2023.
Together, these signals highlight key confirmation and invalidation levels for potential rebounds across the FX market. The outlook remains sensitive to inflation and energy prices, with US CPI rising to 3.7% in September and crude oil holding in neutral-to-bullish territory above $90.
DXY Outlook: Weekly Time Frame – Log Scale
Source: TradingView
After forming a bearish divergence alongside daily RSI overbought conditions last seen in 2023, the DXY pulled back from the 103 resistance level and resistance connecting higher highs since March 2026. This may confirm potential bullish rebound setups in EUR/USD and GBP/USD.
For the DXY, the key confirmation zone for a sustainable bearish reversal is around 101–100.80. This area aligns with the rising support connecting higher lows from January to August 2026. A break below this support zone would strengthen the case for a neutral-to-bullish outlook across the currency pairs.
For now, the outlook remains neutral, given the risks from crude oil, geopolitics and inflation.
On the upside, a move back above 102.60 and 103 would reassert the bullish bias, with 103.50 and 105 as the next potential levels.
Dollar Pairs in Perspective: USD/CHF, USD/CAD, USD/JPY and DXY
Source: TradingView
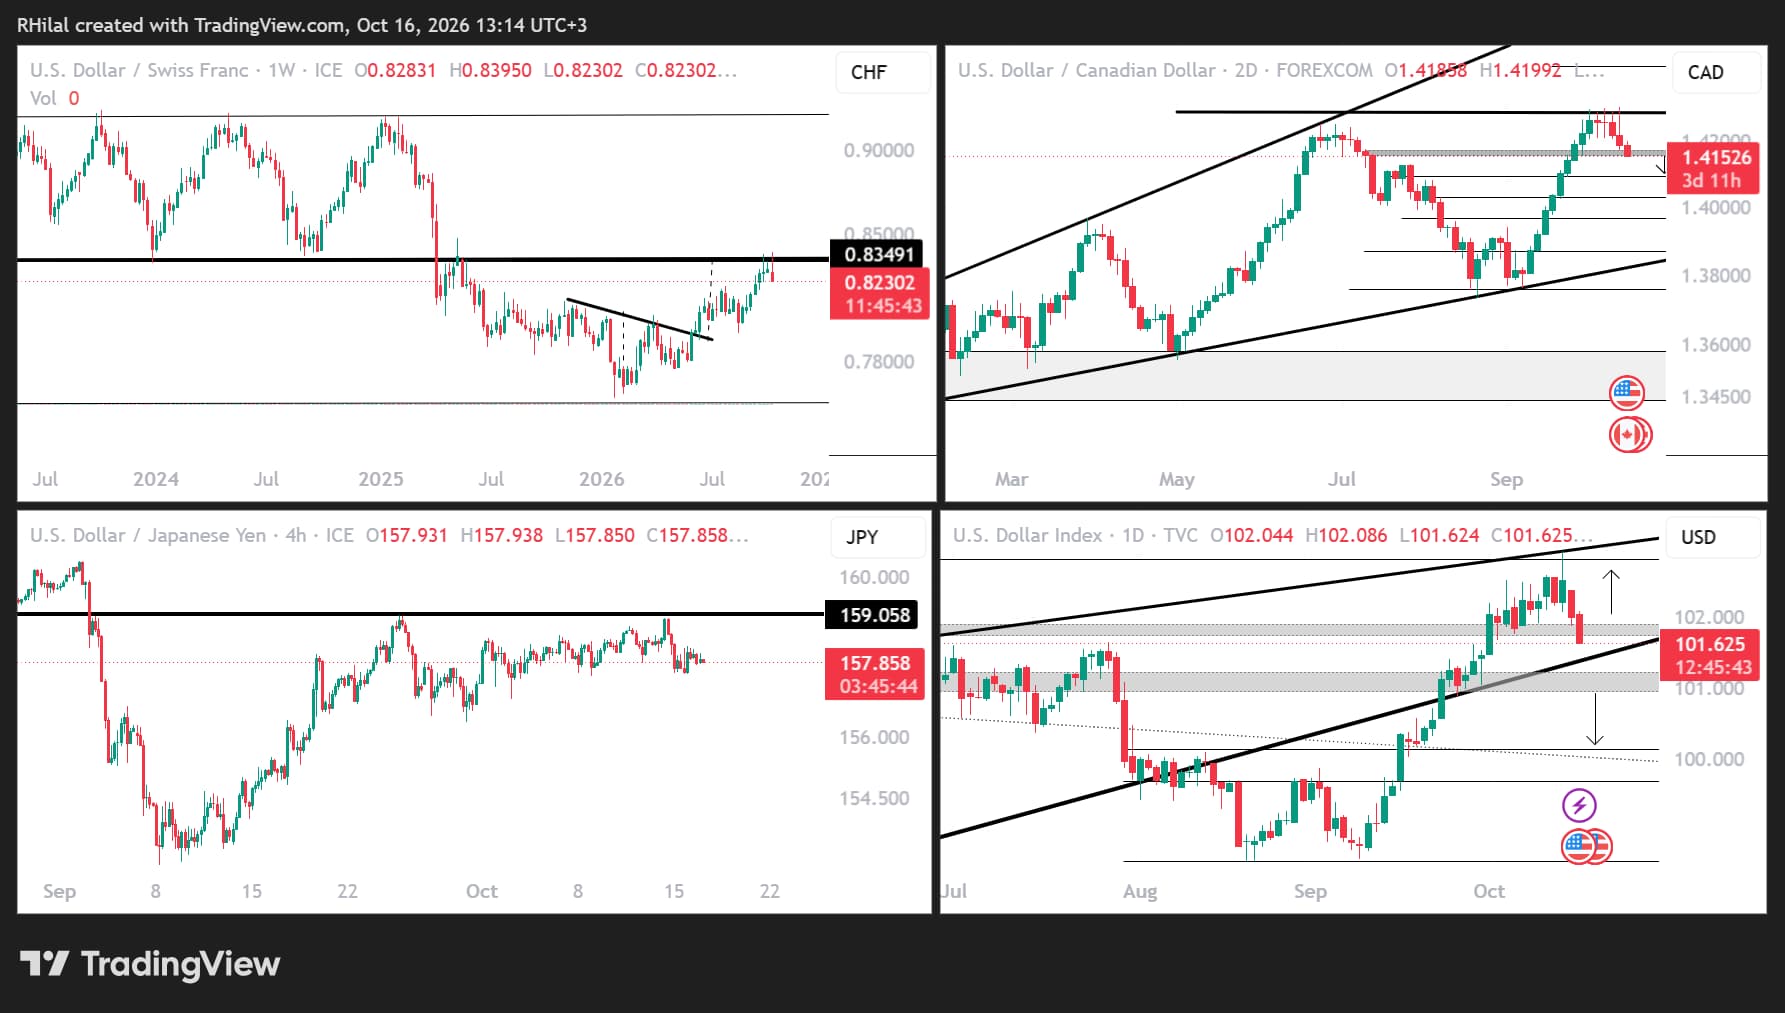
Several short-term reversal setups across the major dollar pairs may help put the DXY’s pullback into perspective:
-
USD/CHF: Price is pulling back from the 2023–2026 support-turned-resistance zone, which also aligns with the target of an inverse head-and-shoulders pattern on the weekly chart, near 0.84.
-
USD/CAD: The pair has consolidated after briefly stretching above its yearly highs below 1.43. A break above the psychological 1.43 level would discard the bearish reversal setup.
-
USD/JPY: The pair is consolidating below 159, raising the risk of a double-top reversal on the four-hour chart.
The respective invalidation levels for these bearish reversal setups are 0.84 for USD/CHF, 1.43 for USD/CAD and 159 for USD/JPY. For the DXY, the key invalidation level is 103.
EUR/USD Outlook: Weekly Time Frame – Log Scale
Source: TradingView
EUR/USD is struggling to recover above the descending trendline near 1.1260, drawn across the lower lows from July 2025 to September 2026. Weekly RSI is rebounding from oversold conditions last seen in 2025, while daily RSI is recovering from oversold conditions last seen in 2015. These signals are lifting the potential for a sustainable bullish reversal, but price confirmation is still needed.
A break back above 1.1260 would bring the 1.1380–1.1400 zone into focus as the next key resistance. Clearing that area would strengthen the case for a move toward the August highs and help sustain the broadening formation that has been developing since July 2025.
On the downside, a break below 1.11—the 50% retracement of the 2022–2026 advance—would expose 1.09. This level represents the 61.8% retracement and aligns with multi-decade resistance-turned-support, making it a potential area to watch for a rebound.
GBP/USD Outlook: Weekly Time Frame – Log Scale
Source: TradingView
GBP/USD is also showing a neutral-to-bullish setup, with both price action and RSI holding within the boundaries of a sideways consolidation that has been in place since November 2025.
Key support is near 1.3130, aligning with the 78.6% extension of the June 2025–November 2025–January 2026 cycle. A break below this level would expose 1.29 as the next potential support. It would also mark a bearish break below the nearly year-long consolidation, strengthening the pair’s longer-term bearish bias.
As long as GBP/USD holds above 1.3130 and within the consolidation, the neutral-to-bullish outlook remains intact across the charts. The midpoint of the range, around 1.3400–1.3480, is the next potential resistance zone, followed by the upper boundary near 1.36.
Written by Razan Hilal, CMT
Follow on X: @Rh_waves
Related tags:

Open an account in minutes
Experience award-winning platforms with fast and secure execution, and enjoy tight spreads from 0.5 pts on FX and 0.3 pts on indices.
Economic calendar
Web Trader platform
Our sophisticated web-based platform is packed with features.
Related articles

EUR/USD, GBP/USD Price Outlook: Can the Dollar Pullback Fuel a Bullish Rebound?
Could EUR/USD and GBP/USD be confirming a bullish rebound? The DXY’s pullback from the 103 resistance level may support a recovery in both pairs, although confirmation is still needed.

ASX 200 Outlook: A Rates Trade Disguised as a Stock Market?
Australian bond futures have exhibited a far stronger relationship with the ASX 200 than Wall Street over recent months. Now both markets are displaying remarkably similar price structures.


AUD/USD Bulls Fight Back After Australian Jobs Shock
AUD/USD has been hit by another ugly Australian employment report, sending RBA rate hike expectations sharply lower. Yet the relationships driving the currency have shifted since quarter-end, and improving risk appetite could provide the fuel for a recovery.
This report is intended for general circulation only. It should not be construed as a recommendation, or an offer (or solicitation of an offer) to buy or sell any financial products. The information provided does not take into account your specific investment objectives, financial situation or particular needs. Before you act on any recommendation that may be contained in this report, independent advice ought to be sought from a financial adviser regarding the suitability of the investment product, taking into account your specific investment objectives, financial situation or particular needs.
StoneX Financial Pte. Ltd., may distribute reports produced by its respective foreign entities or affiliates within the StoneX group of companies or third parties pursuant to an arrangement under Regulation 32C of the Financial Advisers Regulations. Where the report is distributed to a person in Singapore who is not an accredited investor, expert investor or an institutional investor (as defined in the Securities Futures Act), StoneX Financial Pte. Ltd. accepts legal responsibility to such persons for the contents of the report only to the extent required by law. Singapore recipients should contact StoneX Financial Pte. Ltd. at 6826 9988 for matters arising from, or in connection with the report.
In the case of all other recipients of this report, to the extent permitted by applicable laws and regulations neither StoneX Financial Pte. Ltd. nor its associated companies will be responsible or liable for any loss or damage incurred arising out of, or in connection with, any use of the information contained in this report and all such liability is hereby expressly disclaimed. No representation or warranty is made, express or implied, that the content of this report is complete or accurate.
StoneX Financial Pte. Ltd. is not under any obligation to update this report.
Trading CFDs carries a high level of risk that may not be suitable for some investors. Consider your investment objectives, level of experience, financial resources, risk appetite and other relevant circumstances carefully. The possibility exists that you could lose some or all of your investments, including your initial deposits. If in doubt, please seek independent expert advice. Visit www.forex.com/en-sg/terms-and-policies for the complete Risk Disclosure Statement.