





Crude Oil Weekly Outlook: OPEC+ to Unwind Cuts as Oil Faces Tariff Pressures
Crude Oil Weekly Outlook: Oil prices are trading near multi-year lows, facing significant pressure from OPEC+'s planned supply cut unwind, the upcoming FOMC outlook, and ongoing trade war developments. Will the $55 support hold?
Share this:

Key Events
- OPEC+ is expected to accelerate the unwinding of supply cuts as oil trades near critical price levels
- The FOMC outlook on Wednesday may spark heightened market volatility following a series of weak economic indicators
- Crude oil’s $55 support is under pressure and may face renewed bearish threats this week
OPEC+ faces increasing pressure from weaker global oil demand and breaches in production compliance. In response, the group is expected to further unwind output cuts — a move aimed at penalizing non-compliant members while restoring revenue share and overall production capacity, even as oil hovers near key support levels.
While some of the excess supply may be offset by adjustments from overproducing members, the broader plan to gradually and fully unwind the 2.2 million bpd cut by year-end — if market conditions allow — underscores OPEC’s intent to reclaim market share and return closer to full capacity.
Although the news may appear to be priced in, the market reaction could intensify if oversupply concerns worsen and recession risks persist. A decisive break below the $55 support could push oil toward the next critical level at $49.
Looking at the broader picture, escalating tariff tensions in 2025 have pushed major producers to adopt more defensive strategies focused on long-term market positioning — even at the cost of short-term volatility and price pressure.
Sanctions on Iran and Venezuela may increase the probability of near-term oil price spikes, but any sustainable upside will likely require support from long-term demand recovery, trade deal resolutions, and a stabilization in global economic activity.
Broadened market volatility risks may be expected with the FOMC outlook on Wednesday given alarming economic reports with
Macro Outlook and FOMC Volatility Risk
Wednesday’s FOMC statement may inject further volatility into the energy and FX markets, especially given the latest wave of weak economic data:
- Advance GDP: down to -0.3%
- Unemployment claims: up to 241,000
- Non-Farm Payrolls (NFP): dropped from 185K to 177K
- ISM PMI: fell further into contraction at 48.7
- Core PCE: dropped to 0.0% — the first time since 2020
Technical Analysis
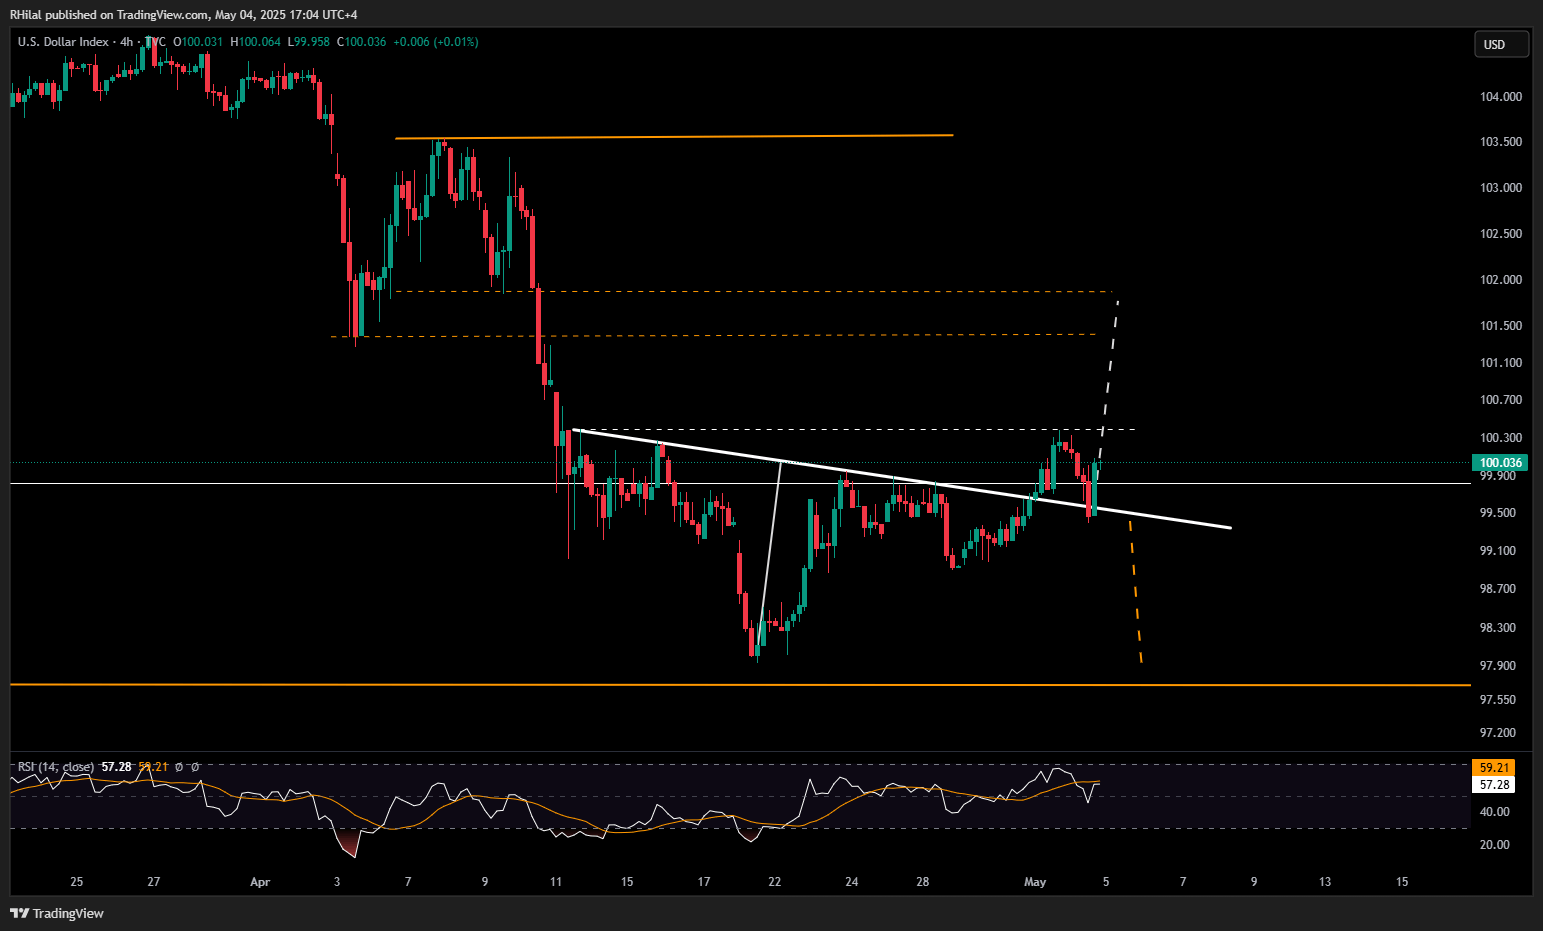
DXY Outlook: 4H Time Frame – Log Scale
Source: Tradingview
The U.S. Dollar Index (DXY), along with U.S. equity indices, appears to be staging a rebound from April’s lows around 98.00, breaking out and retesting the neckline of an inverted head-and-shoulders pattern — despite recessionary warning signs.
If DXY holds firmly above 100.30, it may reflect renewed optimism in the U.S. economy and support for current correlated assets like oil. However, failure to hold this level could confirm a false breakout, with bearish momentum spilling over into oil prices — especially amid supply and demand imbalances.
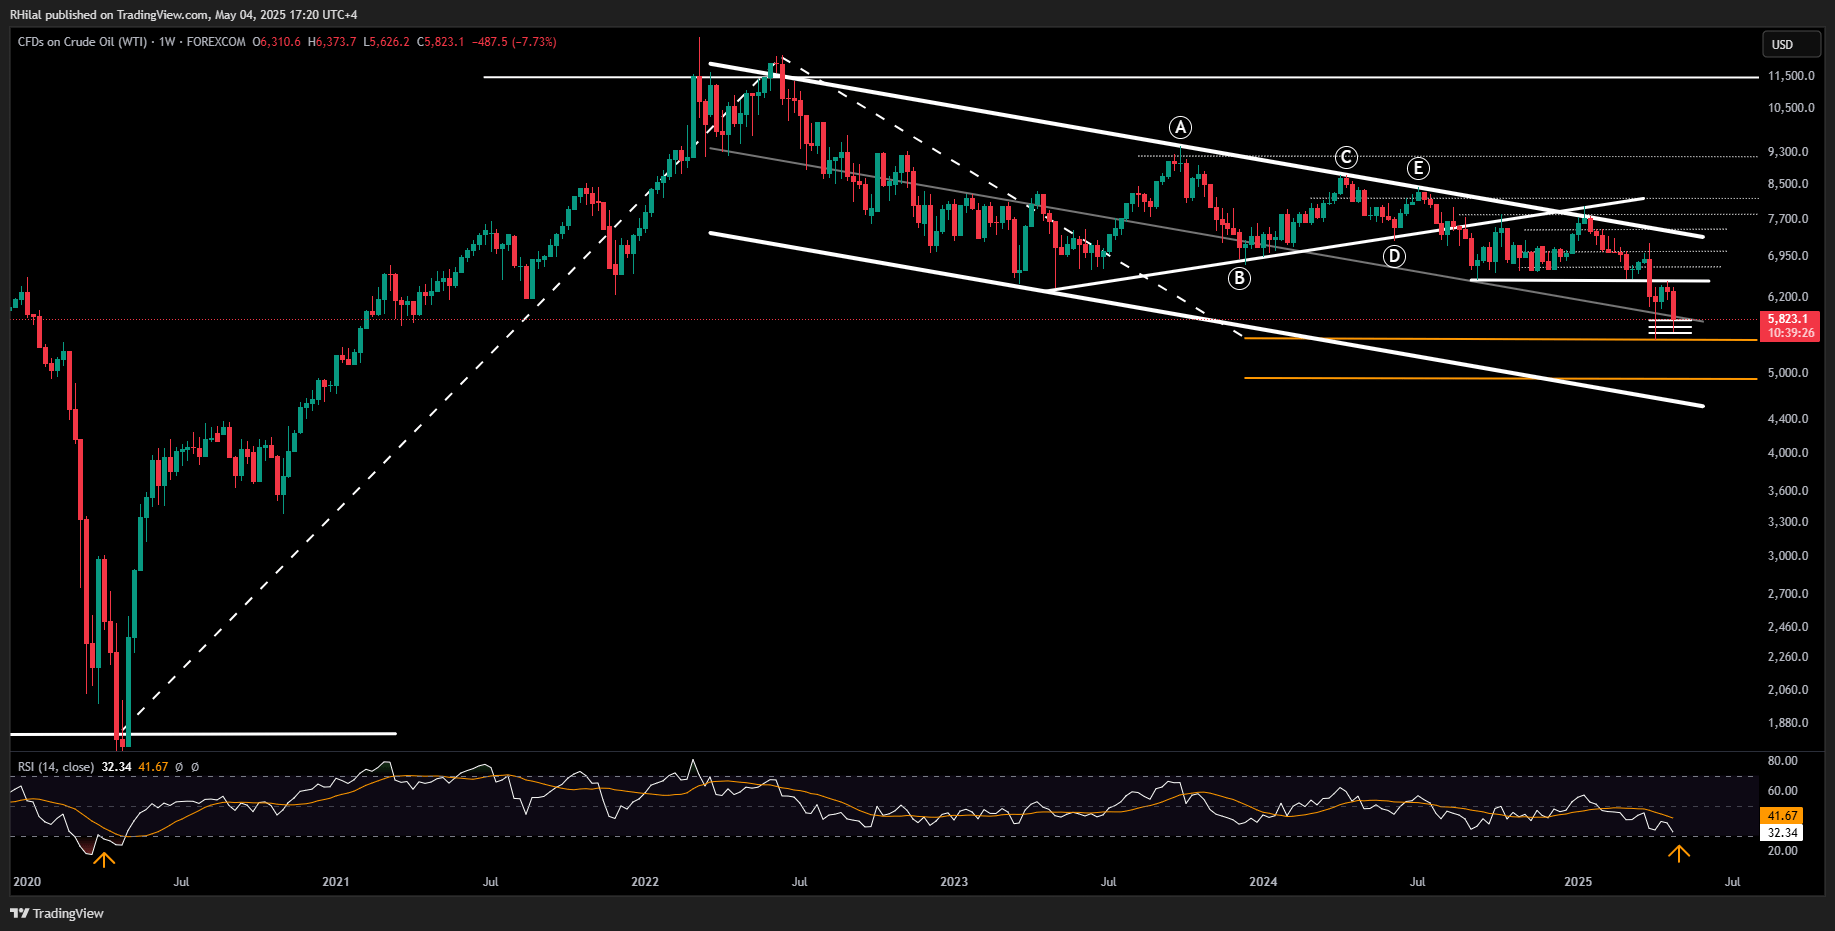
Crude Oil Weekly Outlook: Weekly Time Frame – Log Scale
Source: Tradingview
Oil remains in a corrective phase following its recent bounce from the $55 level, now trading near $58. With OPEC+ planning to unwind supply cuts and trade tensions remaining elevated, another sharp decline — similar to 2020 — cannot be ruled out, particularly as RSI approaches weekly oversold territory last seen in 2020.
- If $55 holds — a key golden Fibonacci ratio level from the 2020–2022 uptrend — prices may rebound toward $60, $64, and $66, with a further test of resistance near $70.
- The sustainability of any rebound will depend on the broader economic outlook.
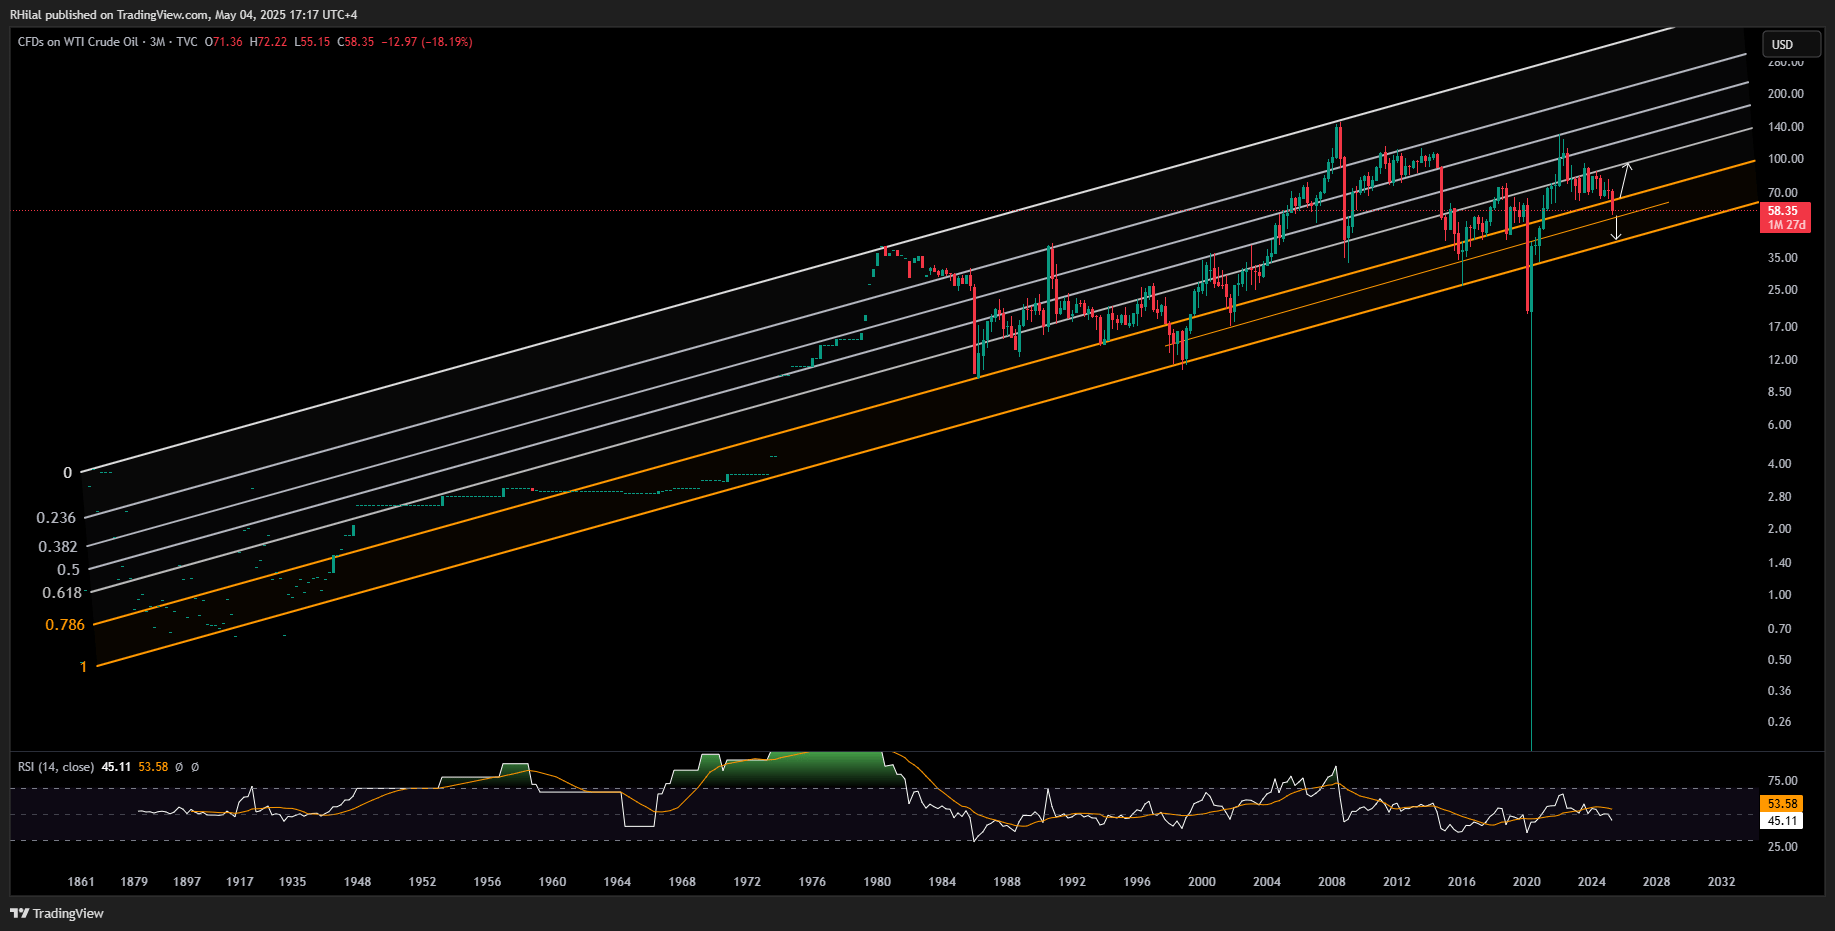
Downside Risk: A decisive break below $55 could trigger a deeper correction toward $49, aligning with the lower boundary of the long-term uptrend channel that dates back to the 1800s, as illustrated in the chart below.
Crude Oil Weekly Outlook: 3-Month Time Frame – Log Scale
Source: Tradingview
Written by Razan Hilal, CMT
Follow on X: @Rh_waves
Related tags:
Latest market news




Open an account in minutes
Experience award-winning platforms with fast and secure execution, and enjoy tight spreads from 0.5 pts on FX and 0.3 pts on indices.
Economic calendar
Web Trader platform
Our sophisticated web-based platform is packed with features.
Related articles
Silver's bullish breakout case builds as bond yields retreat
The Democratic blue wave has sent crude and Treasury yields sharply lower, improving the outlook for precious metals. With gold already breaking higher, could silver be next?

Crude Oil Prices Fall, What the U.S. Midterms Mean for Brent
Crude oil prices have pulled back more than 11% from October highs, in line with U.S.-Iran negotiation hopes and shifting U.S. midterm expectations.

Nasdaq 100 Forecast: NDX rebounds as oil prices fall and ahead of Apple earnings
U.S. stock indices are moving higher on Monday as tech and AI-related stocks steady following a shocking October. The mood remains cautious following the AI wobble, with more tech earnings due this week, U.S. midterm elections and a full U.S. economic data calendar.

This report is intended for general circulation only. It should not be construed as a recommendation, or an offer (or solicitation of an offer) to buy or sell any financial products. The information provided does not take into account your specific investment objectives, financial situation or particular needs. Before you act on any recommendation that may be contained in this report, independent advice ought to be sought from a financial adviser regarding the suitability of the investment product, taking into account your specific investment objectives, financial situation or particular needs.
StoneX Financial Pte. Ltd., may distribute reports produced by its respective foreign entities or affiliates within the StoneX group of companies or third parties pursuant to an arrangement under Regulation 32C of the Financial Advisers Regulations. Where the report is distributed to a person in Singapore who is not an accredited investor, expert investor or an institutional investor (as defined in the Securities Futures Act), StoneX Financial Pte. Ltd. accepts legal responsibility to such persons for the contents of the report only to the extent required by law. Singapore recipients should contact StoneX Financial Pte. Ltd. at 6826 9988 for matters arising from, or in connection with the report.
In the case of all other recipients of this report, to the extent permitted by applicable laws and regulations neither StoneX Financial Pte. Ltd. nor its associated companies will be responsible or liable for any loss or damage incurred arising out of, or in connection with, any use of the information contained in this report and all such liability is hereby expressly disclaimed. No representation or warranty is made, express or implied, that the content of this report is complete or accurate.
StoneX Financial Pte. Ltd. is not under any obligation to update this report.
Trading CFDs carries a high level of risk that may not be suitable for some investors. Consider your investment objectives, level of experience, financial resources, risk appetite and other relevant circumstances carefully. The possibility exists that you could lose some or all of your investments, including your initial deposits. If in doubt, please seek independent expert advice. Visit www.forex.com/en-sg/terms-and-policies for the complete Risk Disclosure Statement.