



Crude Oil Weekly Outlook: WTI Holds Above 7-Month Resistance
Crude Oil Weekly Outlook: WTI holds above 7-month resistance as traffic through the Strait of Hormuz remains constrained and US-Iran tensions escalate. Key technical scenarios remain in focus as upside risks mount.
Share this:

Crude oil prices are holding above a 7-month resistance level that capped price action with lower highs since March 2026. The bullish continuation scenario has gained momentum after the US military recently struck three Iranian oil tankers. According to tanker-traffic data observed by Kpler, only one ship was recorded passing through the Strait of Hormuz on Saturday, further intensifying concerns over supply disruptions.
From a cross-asset perspective, the Energy Select Sector SPDR Fund (XLE) is holding above a major 2008–2026 resistance level and remains in a strong bullish zone. Brent crude, however, continues to lag, with price action still below a significant 7-month resistance level.
Overall, two charts maintain a positive bias, while one remains neutral-to-positive. This keeps bullish risks, inflationary pressures, and broader risk-off concerns in focus.
Key Scenarios in Focus
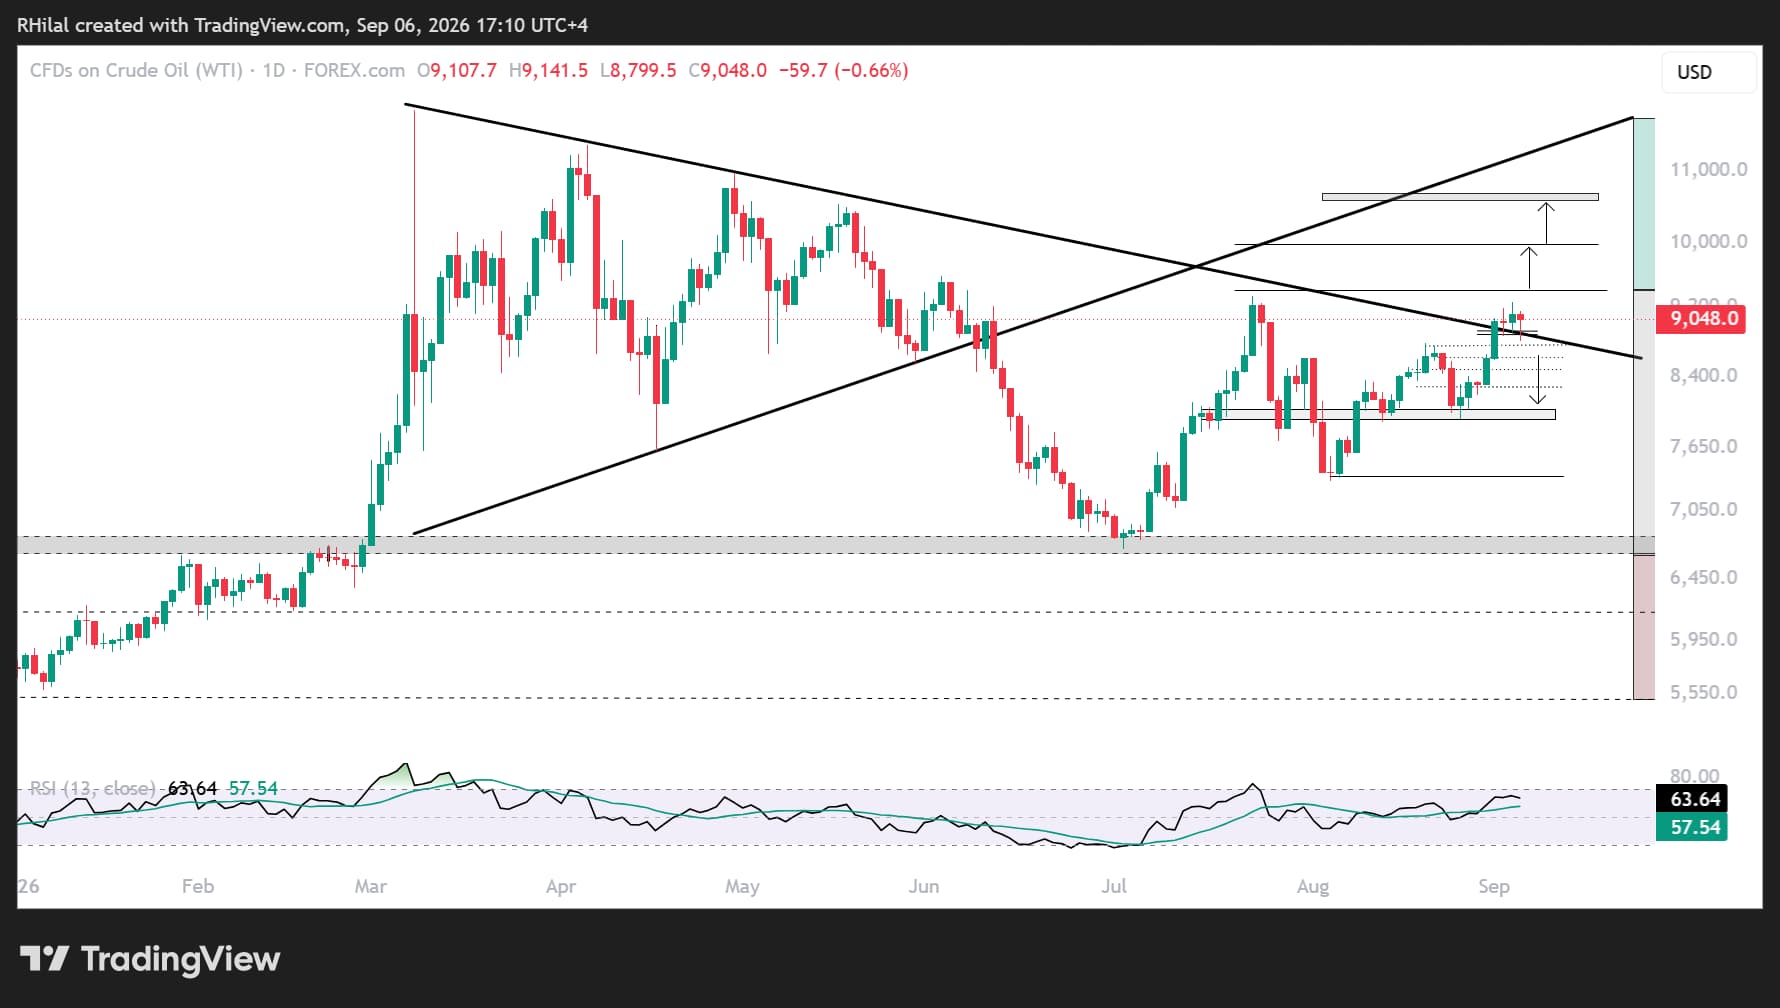
WTI Weekly Outlook: 3-Day Time Frame — Log Scale
Source: TradingView
WTI price action is holding above the 7-month resistance level near $88 per barrel, which capped prices from March 2026 onward. To reinforce the escalation and supply-crunch scenario, WTI needs to reclaim the July 2026 high near $94.
On the downside, a move back below the multi-month barrier would support a de-escalation scenario and reintroduce a bearish bias.
Bullish scenario: A breakout above $94 would reinforce the bullish outlook and escalation narrative, targeting the Fibonacci extension levels of the July–August 2026 cycle near $99.80 and $107. These represent the 100% and 127% extension levels and sit close to the yearly highs.
Bearish scenario: A breakdown below $88, corresponding to the 23.6% retracement of the July–August advance, could trigger a deeper decline toward short-term levels at $87.40, $86, and $84.30. A sustained move lower could expose longer-term support near $80–$79.
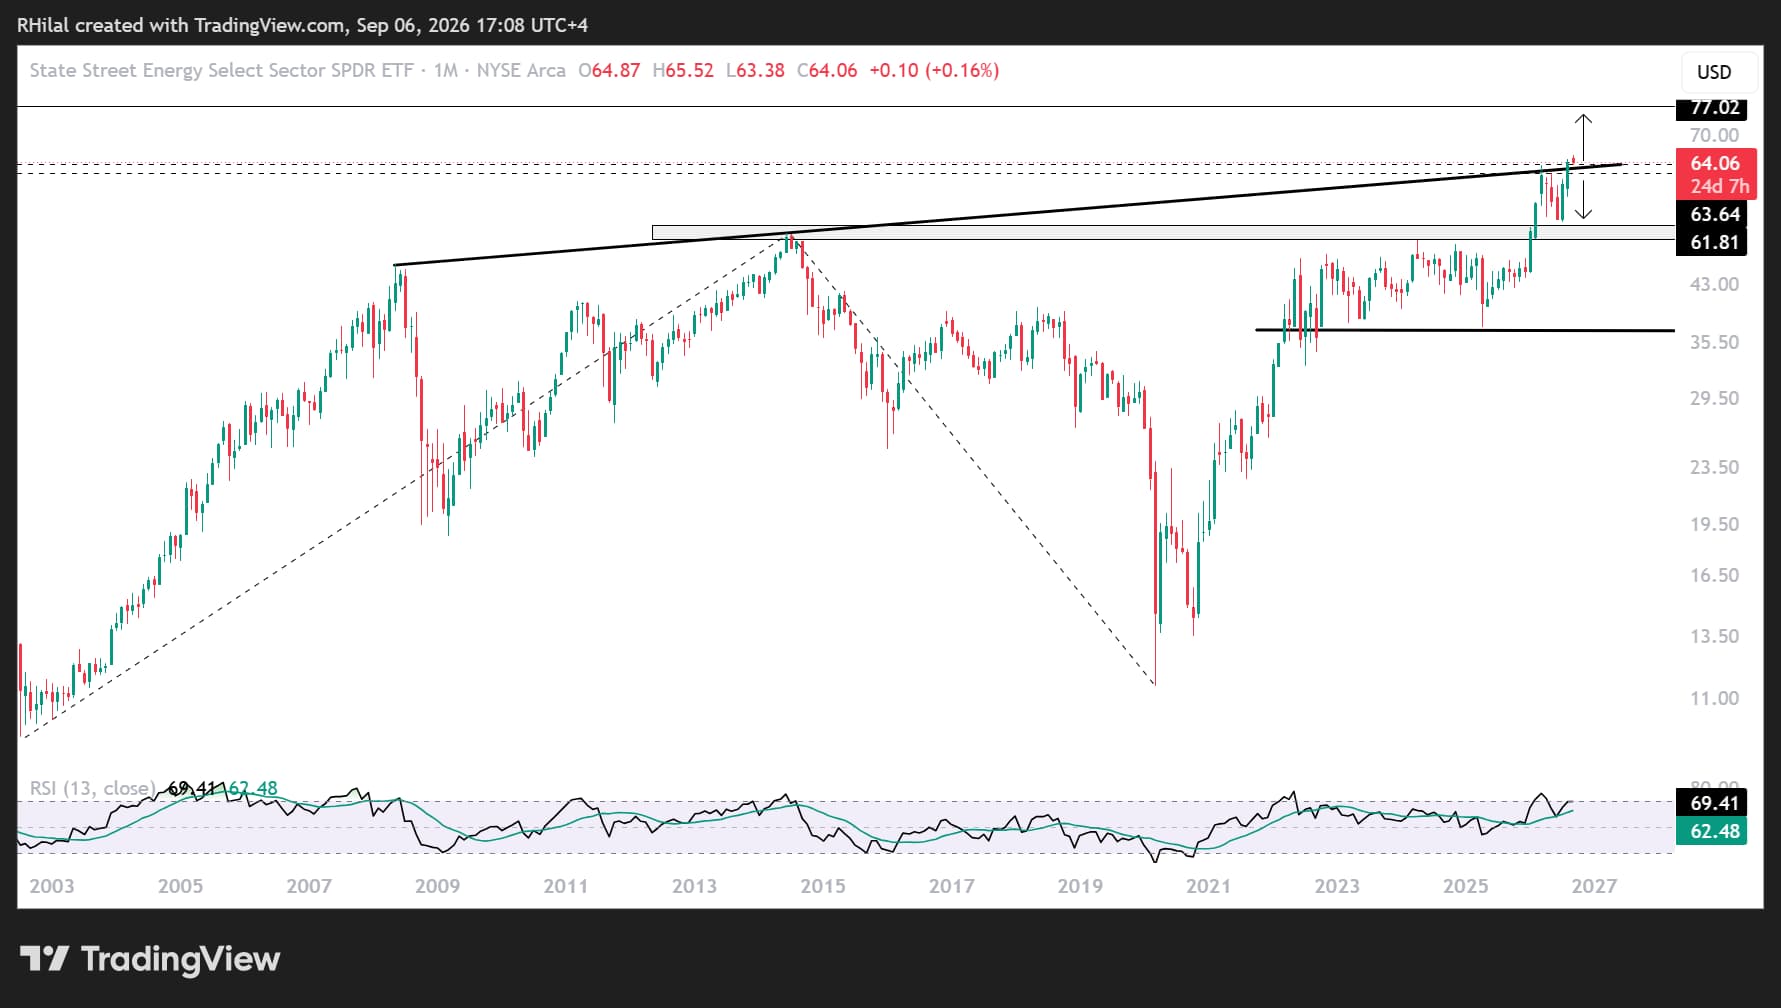
XLE Outlook: Monthly Time Frame — Log Scale
Source: TradingView
From an ETF perspective, XLE reflects the broader performance of the energy sector. Price action broke above a major 2008–2026 resistance level, which turned into support in September 2026. For now, that support is holding above $63.50.
The price structure remains consistent with persistent geopolitical tensions and signals potential long-term stress across the energy market.
Bullish scenario: Holding above $63.50 and reclaiming the $65.50 area would reinforce the bullish forecast and open the door to new record highs. Upside targets include the Fibonacci extension levels of the 2002–2014–2020 cycle near $68, $73, and $77.
This scenario would likely align with a broader escalation scenario.
Bearish scenario: A breakdown below the $61–$60 zone would reaffirm the strength of the multi-year resistance level and pressure XLE into another corrective cycle. This scenario would likely align with broader de-escalation across geopolitical tensions.
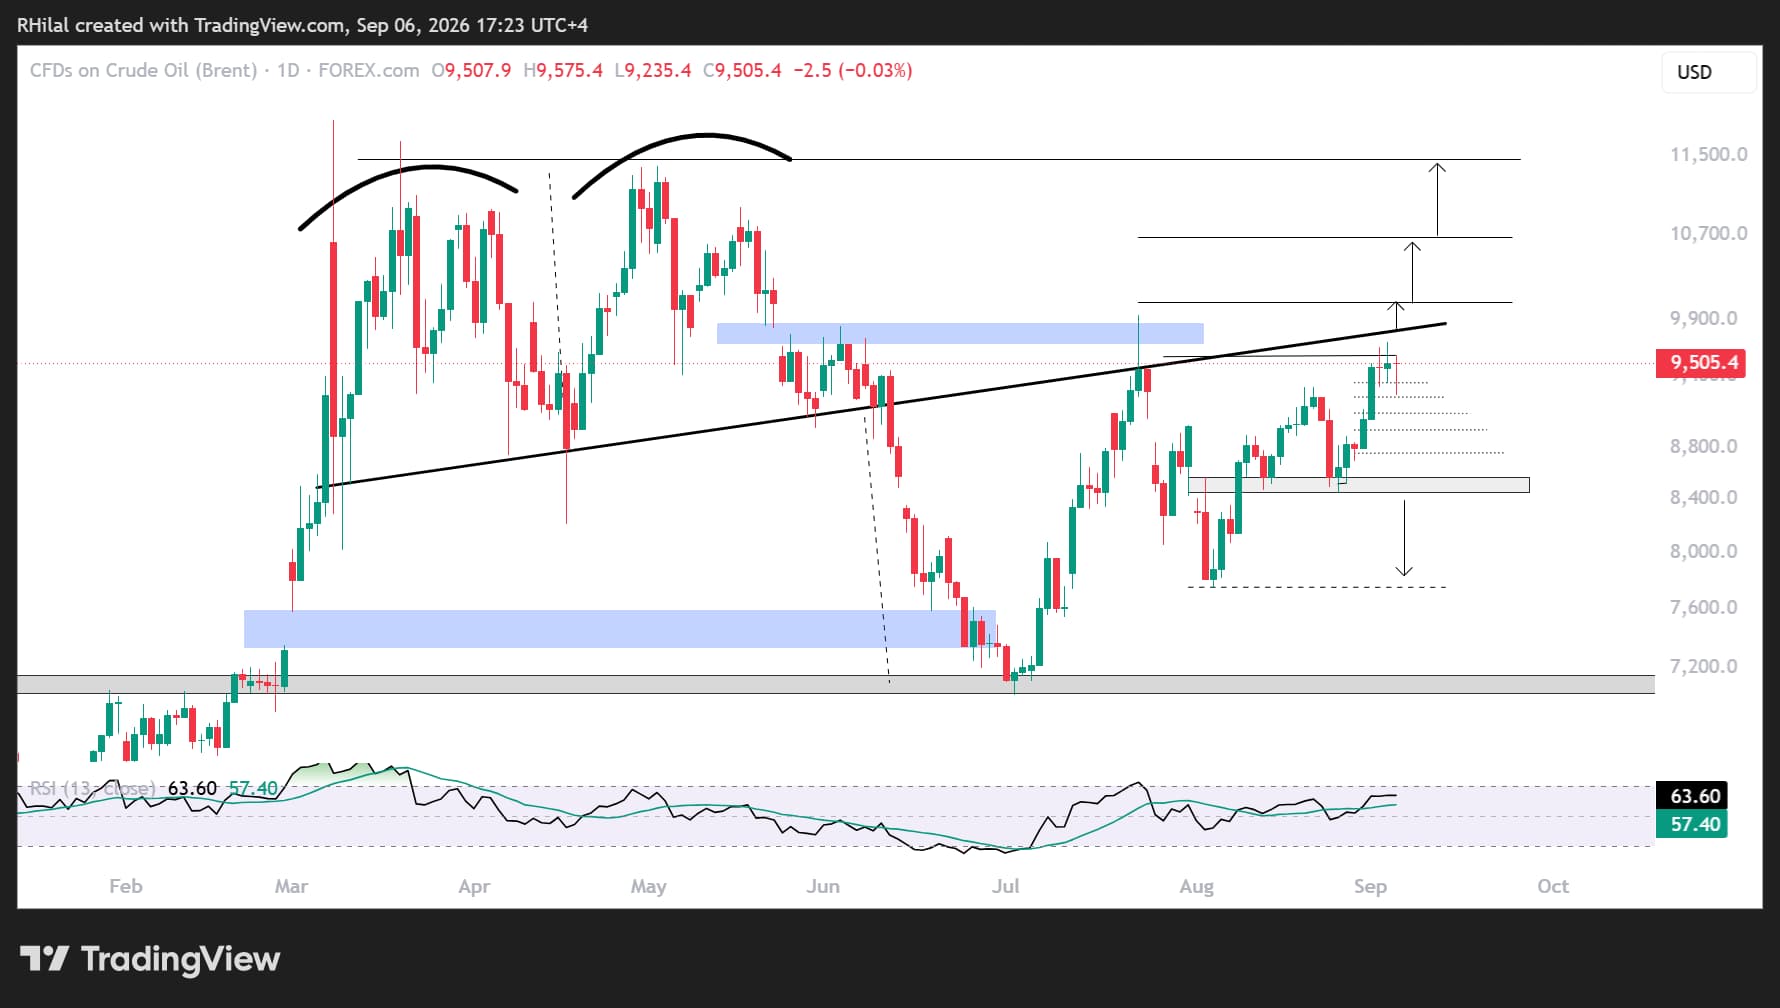
Brent Weekly Outlook: 3-Day Time Frame — Log Scale
Source: TradingView
For Brent crude, a breakout above the multi-month and multi-year resistance zone has not yet been confirmed. This barrier represents the neckline of a double-top formation that triggered the sell-off in early June. The resistance is located near the July 2026 highs around $100 per barrel.
Bullish scenario: A breakout above the 7-month resistance level and the $100 mark would reinforce the bullish outlook and escalation narrative. This could open the way toward Fibonacci extension targets near $107 and $114, corresponding to the 100% and 127% extension levels and located close to the yearly highs.
Bearish scenario: A breakdown below $92, corresponding to the 38.2% retracement of the July–August advance, could trigger a deeper decline toward short-term levels at $90, $89, and $87.20. A more extended bearish move could develop below $84.60.
The narrative remains uncertain but tilted to the upside, with crude inventory drawdowns and escalating US–Iran tensions supporting price action as it attempts key breakouts. If confirmed, these moves could signal increasing stress across energy and broader markets heading into year-end.
Written by Razan Hilal, CMT
Follow on X: @Rh_waves
Latest market news




Open an account in minutes
Experience award-winning platforms with fast and secure execution, and enjoy tight spreads from 0.5 pts on FX and 0.3 pts on indices.
Economic calendar
Web Trader platform
Our sophisticated web-based platform is packed with features.
Related articles
Swiss Franc Forecast: USD/CHF Seven-Week Rally Reverses From Yearly Highs 10 16 2026
A sharp rejection from fresh highs has shifted momentum in favor of USD/CHF bears, raising the stakes for a critical support test.
S&P 500 Forecast: SPX set for a weekly decline led lower by tech as AI worries linger
U.S. stocks have opened mixed as investors continue to worry about the financing behind the AI trade while also looking ahead to more earnings next week.

EUR/USD, GBP/USD Price Outlook: Can the Dollar Pullback Fuel a Bullish Rebound?
Could EUR/USD and GBP/USD be confirming a bullish rebound? The DXY’s pullback from the 103 resistance level may support a recovery in both pairs, although confirmation is still needed.
This report is intended for general circulation only. It should not be construed as a recommendation, or an offer (or solicitation of an offer) to buy or sell any financial products. The information provided does not take into account your specific investment objectives, financial situation or particular needs. Before you act on any recommendation that may be contained in this report, independent advice ought to be sought from a financial adviser regarding the suitability of the investment product, taking into account your specific investment objectives, financial situation or particular needs.
StoneX Financial Pte. Ltd., may distribute reports produced by its respective foreign entities or affiliates within the StoneX group of companies or third parties pursuant to an arrangement under Regulation 32C of the Financial Advisers Regulations. Where the report is distributed to a person in Singapore who is not an accredited investor, expert investor or an institutional investor (as defined in the Securities Futures Act), StoneX Financial Pte. Ltd. accepts legal responsibility to such persons for the contents of the report only to the extent required by law. Singapore recipients should contact StoneX Financial Pte. Ltd. at 6826 9988 for matters arising from, or in connection with the report.
In the case of all other recipients of this report, to the extent permitted by applicable laws and regulations neither StoneX Financial Pte. Ltd. nor its associated companies will be responsible or liable for any loss or damage incurred arising out of, or in connection with, any use of the information contained in this report and all such liability is hereby expressly disclaimed. No representation or warranty is made, express or implied, that the content of this report is complete or accurate.
StoneX Financial Pte. Ltd. is not under any obligation to update this report.
Trading CFDs carries a high level of risk that may not be suitable for some investors. Consider your investment objectives, level of experience, financial resources, risk appetite and other relevant circumstances carefully. The possibility exists that you could lose some or all of your investments, including your initial deposits. If in doubt, please seek independent expert advice. Visit www.forex.com/en-sg/terms-and-policies for the complete Risk Disclosure Statement.