





DJIA Forecast: The Dow Declines After the NFP
The Dow has managed to surpass the 44,000-point barrier and currently maintains steady growth of just over 7% since November.
Share this:

DJIA Forecast: The Dow Declines After the NFP
- The 44,000-point barrier has been surpassed in the short term; however, movements have remained neutral in this zone.
- The Dow lost points after the publication of the NFP, which registered 227k.
- The CME indicates a probability of over 85% for a FED interest rate reduction, an event that could create upward pressure on the Dow Jones in the short term.
The Dow has managed to surpass the 44,000-point barrier and currently maintains steady growth of just over 7% since November. However, a recent slowdown in movements has been observed, with a drop of approximately 1% following the release of the NFP data last Friday.
The Employment Dilemma
The data published last Friday, December 6, shows that the trend of new jobs reflected in the NFP remains bullish. The previous figure was around 36k, while the current figure shows a significant increase, reaching 227k and even surpassing the forecast of 200k.
The published data could establish an important connection with the Federal Reserve, as the rapid increase in employment, combined with the holiday season, could lead to a rise in consumption in the United States in the coming weeks. This, in turn, could influence the FED's Board of Governors' short-term decisions, potentially adopting an aggressive approach to maintaining the interest rate. Consequently, the Dow Jones outlook could turn bearish following these events.
Latest NFP Data

Source: FX Street
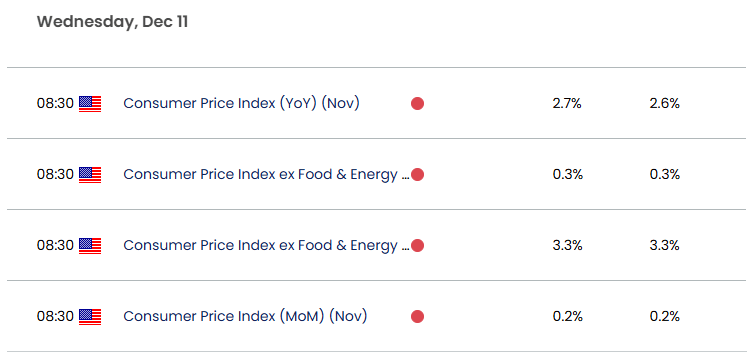
The annual Consumer Price Index (CPI) for the United States, to be published this Wednesday, is expected to stand at 2.7% year-over-year, slightly above the 2.6% recorded in November. An increase above expectations could negatively impact the outlook for the Dow Jones Industrial Average (DJIA), as investors may anticipate monetary policy adjustments from the Federal Reserve to control inflation. That said, the Central Bank might consider slowing the pace of interest rate reductions, which could influence consumer behavior and, consequently, affect the Dow Jones.
Inflation this week
Source: FX Street
What to Expect from the Next FED Decision
In recent days, FED Chair Jerome Powell has stated that the expectations for interest rate reductions are currently being met. However, there is no indication that this trend will accelerate in upcoming decisions.
Low interest rates are a key factor in maintaining confidence in equity index markets, which is a necessary step for indexes to sustain a strong upward trend in the long term.
FED Decision Probability Chart
Source: Cmegroup.com
According to the CME Group's probability chart, around 85% of current estimates suggest a rate cut to the 4.25%–4.5% range, while only about 14.2% predict that the rate will remain at its current level of 4.5%–4.75%. Thus, the Dow Jones is likely to remain in a neutral zone while investors prepare for the final decision on December 18. Since the rate cut is already anticipated, the market will focus on Powell's comments following the decision. If the approach aligns with previous decisions (allowing more room to lower interest rates), it is likely that the Dow will maintain its long-term upward trend. However, if the stance indicates steady interest rates for upcoming meetings, the Dow may face downward pressure as the market is expecting a series of rate reductions.
Dow Jones Technical Forecast
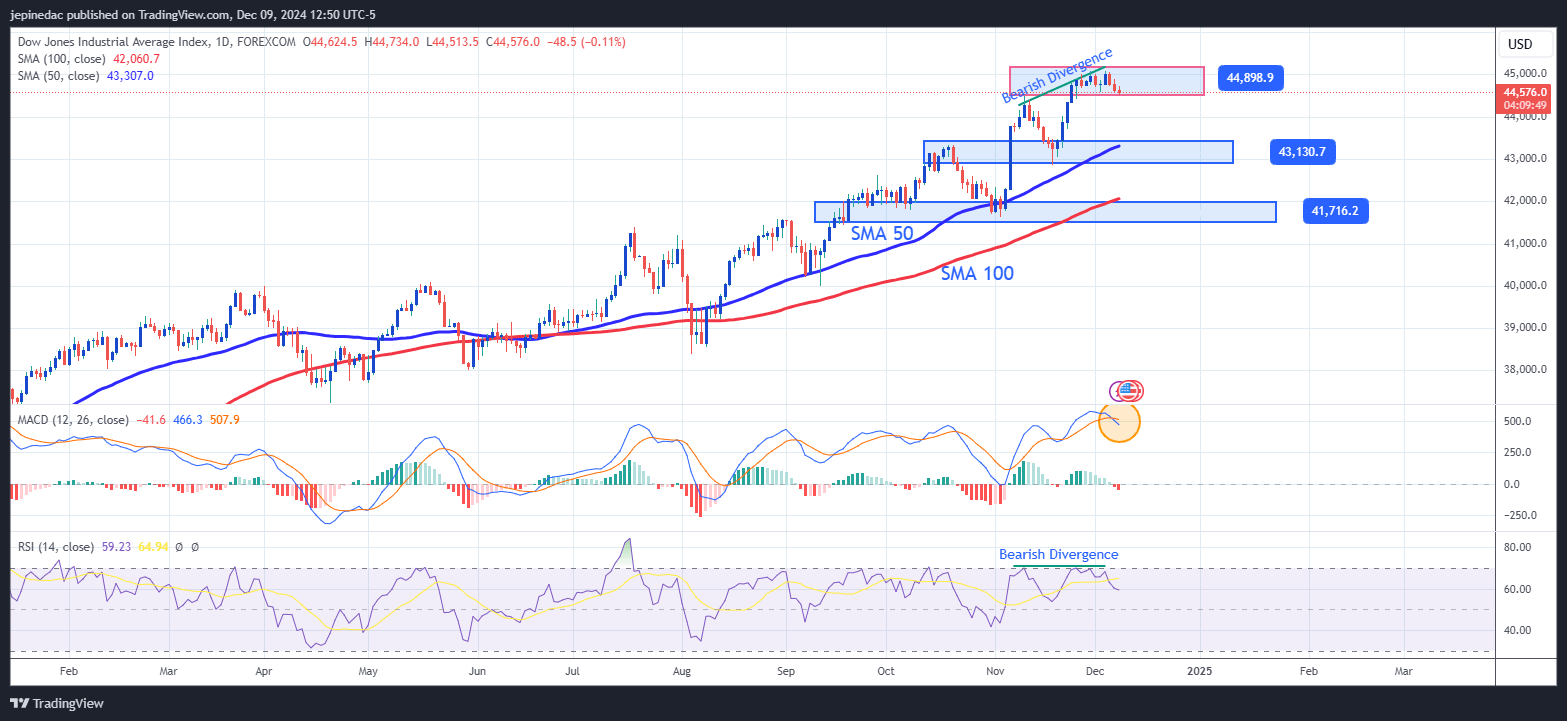
The Dow Jones Industrial Average (DJIA) has maintained a steady upward trend, recently reaching an all-time high of 45,000 points during the last five sessions. However, daily oscillations have remained around 0.6%, indicating a neutral stance among investors in the resistance zone of 44,000 points.
Source: Tradingview.com
- Steady Trend: Since August, the price of the DJIA began a stable upward trend near 38,000 points. Currently, the price has continued to rise, reaching the consolidation zone at 44,000 points. The simple moving averages of 50 and 100 daily periods consistently remain below price movements, indicating that, for now, no significant bearish correction threatens to break the current trend.
- Indicator Divergence: A Bearish divergence is currently observed between higher highs in price and steady highs in RSI levels, indicating that price acceleration is outpacing the momentum reflected by the indicators. This suggests a potential slowdown in bullish momentum, which could impact the trajectory of the current bullish trend.
Additionally, the MACD line is crossing below the Signal line, and the MACD histogram has started showing negative values, indicating that the bullish momentum from recent days has ended, creating room for bearish action. Both events could signal potential bearish corrections for the Dow Jones in the upcoming sessions.
- Key levels:
- 44k points: Current resistance zone on the chart; movements above this level could confirm bullish strength and the continuation of the current trend.
- 43,100 points: Closest support on the chart and a tentative zone for bearish correction oscillations.
- 41,700 points: Distant floor; oscillations at this level could jeopardize the bullish trend's strength and may even bring it to an end.
The inflation rate and the next Federal Reserve (FED) decision will be key factors in determining whether the Dow Jones Industrial Average (DJIA) can once again reach its all-time high of 45,000 points in the upcoming sessions.
Related tags:
Latest market news




Open an account in minutes
Experience award-winning platforms with fast and secure execution, and enjoy tight spreads from 0.5 pts on FX and 0.3 pts on indices.
Economic calendar
Web Trader platform
Our sophisticated web-based platform is packed with features.
Related articles
Gold Forecast: Are Bears Regaining Control of XAU/USD?
The start of the trading week has not been particularly favorable for gold. This can be seen in recent XAU/USD price action, with the metal falling nearly 4.00% over the last two trading sessions and bringing renewed attention to a bearish bias within the market.

S&P 500, Nasdaq, Dow Forecast: Wall Street Split Widens Into Month-End 9 26 2026
Nasdaq strength contrasts with mounting Dow pressure as rising Treasury yields raise the stakes for stocks heading into the monthly close.


Equity Indices Q4, 2026 Outlook: Cracks Begin to Show
There's still an open door for a melt-up in the S&P 500 and Nasdaq but the Dow and Russell 2000 are looking more vulnerable, and until calm hits the Treasuries market there's a higher probability for volatility. The big question is whether that's a next quarter theme or not.

This report is intended for general circulation only. It should not be construed as a recommendation, or an offer (or solicitation of an offer) to buy or sell any financial products. The information provided does not take into account your specific investment objectives, financial situation or particular needs. Before you act on any recommendation that may be contained in this report, independent advice ought to be sought from a financial adviser regarding the suitability of the investment product, taking into account your specific investment objectives, financial situation or particular needs.
StoneX Financial Pte. Ltd., may distribute reports produced by its respective foreign entities or affiliates within the StoneX group of companies or third parties pursuant to an arrangement under Regulation 32C of the Financial Advisers Regulations. Where the report is distributed to a person in Singapore who is not an accredited investor, expert investor or an institutional investor (as defined in the Securities Futures Act), StoneX Financial Pte. Ltd. accepts legal responsibility to such persons for the contents of the report only to the extent required by law. Singapore recipients should contact StoneX Financial Pte. Ltd. at 6826 9988 for matters arising from, or in connection with the report.
In the case of all other recipients of this report, to the extent permitted by applicable laws and regulations neither StoneX Financial Pte. Ltd. nor its associated companies will be responsible or liable for any loss or damage incurred arising out of, or in connection with, any use of the information contained in this report and all such liability is hereby expressly disclaimed. No representation or warranty is made, express or implied, that the content of this report is complete or accurate.
StoneX Financial Pte. Ltd. is not under any obligation to update this report.
Trading CFDs carries a high level of risk that may not be suitable for some investors. Consider your investment objectives, level of experience, financial resources, risk appetite and other relevant circumstances carefully. The possibility exists that you could lose some or all of your investments, including your initial deposits. If in doubt, please seek independent expert advice. Visit www.forex.com/en-sg/terms-and-policies for the complete Risk Disclosure Statement.