



EUR/AUD, GBP/AUD: AUD tailwinds driving fresh bearish pressure
Chinese market strength, firmer commodities and pared-back RBA cut expectations have hammered EUR/AUD and GBP/AUD, leaving both pairs threatening fresh lows. With the Fed’s easing tilt boosting global sentiment, AUD’s cyclical tailwinds may yet extend the move.
Share this:

- Chinese assets and commodities pushing AUD higher
- RBA cuts less likely as consumer-led growth surprises
- EUR/AUD focus on 1.7675 into ECB decision
- GBP/AUD testing 2.0450 after closing beneath 200DMA
AUD Outlook Summary
Booming Chinese markets, firmer commodity prices and a noticeable decline in the scale of further rate cuts expected from the Reserve Bank of Australia have combined to spark a large bearish unwind in EUR/AUD and GBP/AUD over the past month, leaving both pairs threatening to break to fresh lows. With looming rate cuts from the Federal Reserve acting to boost sentiment towards the global economic outlook, tailwinds for cyclical assets such as the Australian dollar may find room to strengthen yet.
AUD a China Proxy Play
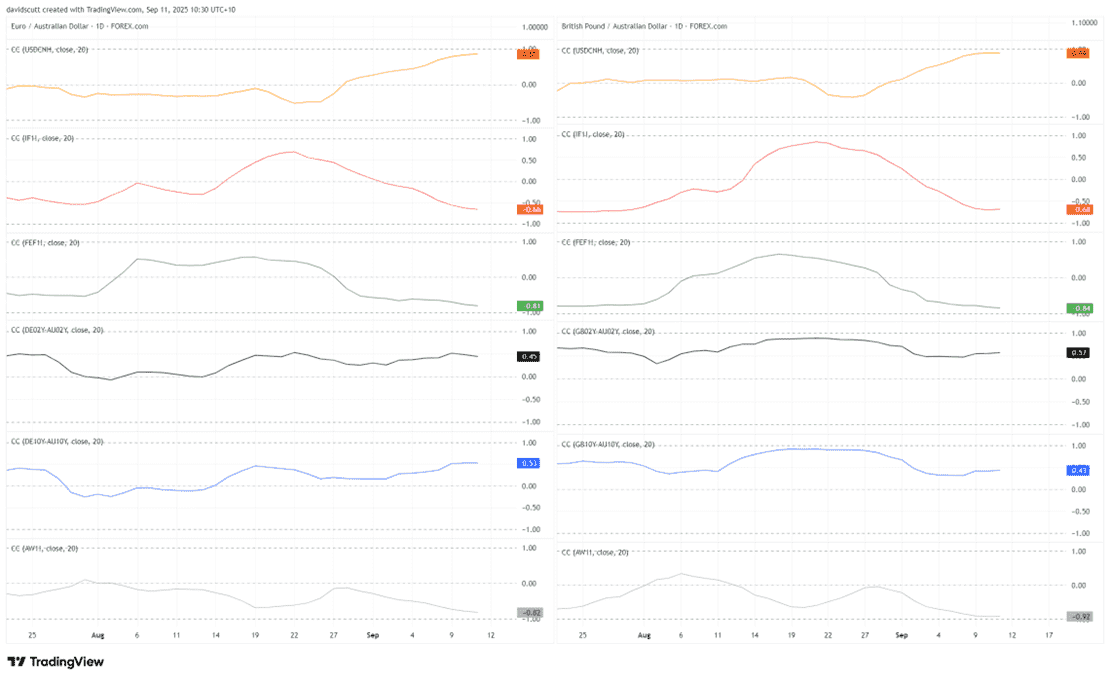
The first chart showing correlation coefficient scores between EUR/AUD and GBP/AUD with a variety of markets and indicators gives a strong sense of what’s been influencing both pairs over the past month: Chinese markets, commodity prices, along with rate differentials bubbling away in the background. From top to bottom, we have USD/CNH in yellow, CSI 300 futures in red, SGX iron ore futures in green, two-year and 10-year yield spreads in black and blue respectively (Germany used as a proxy for risk-free EUR rates), along with Bloomberg commodity index futures in grey.
Source: TradingView
Correlation scores run from -1 to 1, showing how closely two assets move together. A score near 1 means they move in sync, -1 means they move in opposite directions, and 0 means no clear relationship. Correlation doesn’t equal causation, but in this instance, the strength of the relationship with Chinese and China-linked markets is clearly a driver of recent moves. There’s been a long-standing positive correlation between AUD and offshore traded CNH, while AUD has also benefitted at times when Chinese equities have outperformed. As a major commodity producer, firmer prices provide another tailwind.
Another factor has been a pick-up in the Australian economy led by consumers, casting doubt on the need for the RBA to cut rates further. With comparatively low levels of net government debt, Australia is also less exposed to fiscal risks faced in Europe, such as the UK and France. Combined with geopolitical uncertainty, the economic outlook between Australia and Europe is diverging, helping fuel AUD strength.


EUR/AUD Downside Risks Grow
Source: TradingView
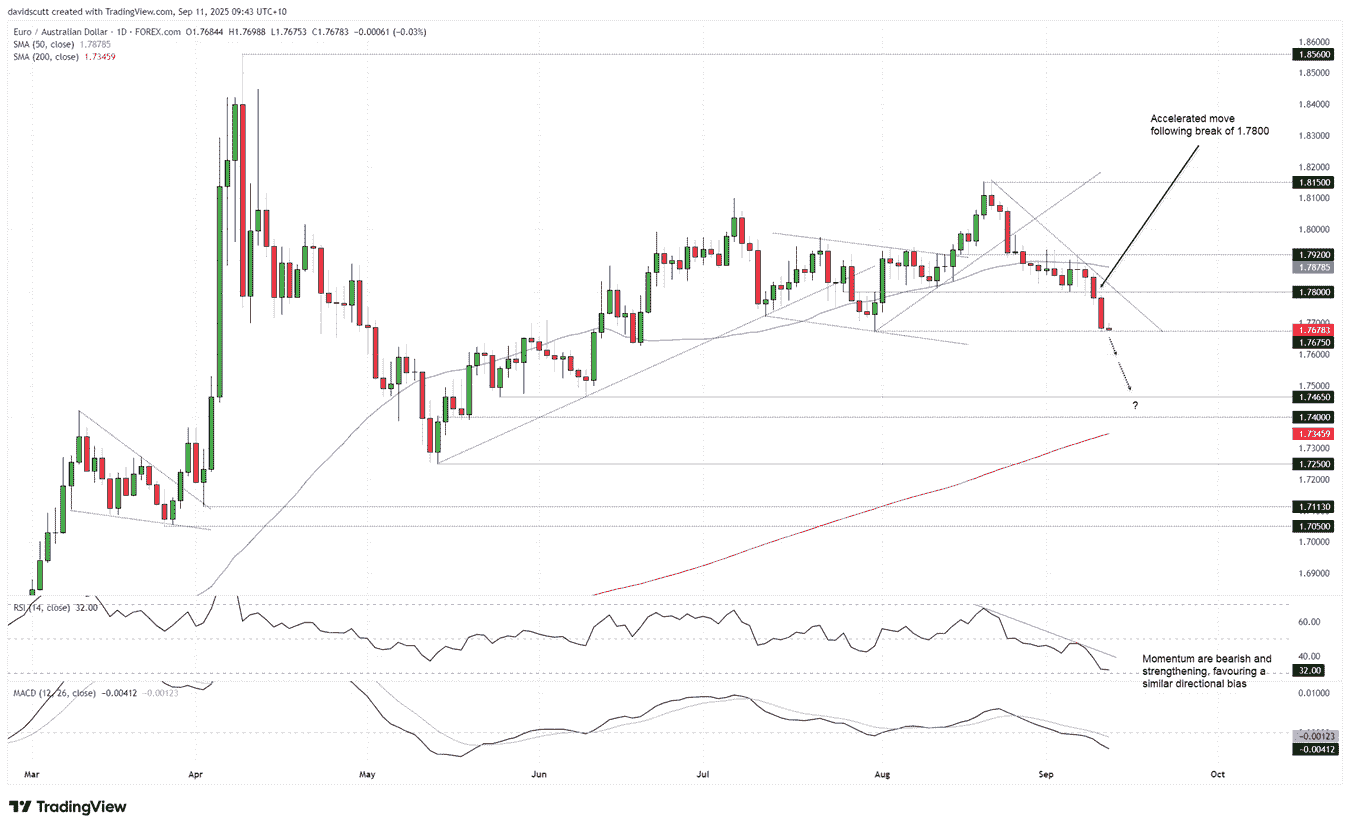
EUR/AUD has been trending lower having topped out at 1.8150 in late August, taking out several support levels and the 50-day moving average along the way. The pace of the unwind has accelerated following the break of 1.7800 earlier this week, leaving the pair perched just above the July swing low of 1.7675. That now becomes a key level when assessing fresh trade setups heading into the European Central Bank (ECB) September interest rate decision later Thursday.
Both RSI (14) and MACD are providing clear, strengthening bearish momentum signals, favouring a similar directional bias. As such, if we see a clean break of 1.7675, minor levels below such as 1.7630 and 1.7600 may be quickly overrun, putting more defined support levels such as 1.7465 and 1.7400 on the radar. Should 1.7675 hold, 1.7800 and the August 21 downtrend offer the first topside tests of note.
Regarding the ECB, while no change in the deposit rate is expected, there is a risk that updated growth and inflation forecasts come across as dovish given headwinds from a firmer euro and political and geopolitical uncertainty. Such an outcome would likely amplify downside risks for EUR relative to AUD.
GBP/AUD Breaks Beneath 200DMA

Source: TradingView
GBP/AUD also finds itself in a well-defined downtrend with momentum indicators flashing increasingly bearish signals, making the first close beneath the 200-day moving average since November 2024 on Wednesday all the more interesting for shorts.
With a bearish bias favoured, 2.0450 now looms as an important level given the pair has found support here frequently in the recent past. If the price can meaningfully break beneath the level, shorts could be established with a stop above for protection, targeting 2.0300 initially. If 2.0450 holds again, a reversal back above the 200DMA and August 20 downtrend would shift directional risks sideways to higher, paving the way for long setups to be considered. But, for now, the pair is very much as a sell on rallies/bearish breaks play.
Related tags:
Latest market news




Open an account in minutes
Experience award-winning platforms with fast and secure execution, and enjoy tight spreads from 0.5 pts on FX and 0.3 pts on indices.
Economic calendar
Web Trader platform
Our sophisticated web-based platform is packed with features.
Related articles
GBP/USD, GBP/AUD: Sterling Rally Faces a BoE Reality Check
Sterling faces a reality check as the BoE prepares to hike rates. GBP/USD and GBP/AUD approach resistance, leaving bulls vulnerable to dovish guidance.
Swiss Franc Short-term Outlook: USD/CHF Selloff Nears Critical Support Ahead of NFP 11 4 2026
USD/CHF bears are closing in on critical trend support, with the next reaction likely to determine whether the October decline has further to run.

USD/CAD Forecast: Canadian Dollar Gains Ground After U.S. Midterm Elections
The trading week continues to unfold and the recovery in the Canadian dollar has once again become a relevant theme in the short term. This can be clearly seen in the recent performance of USD/CAD, which is down nearly 0.4% during the session, reflecting a consistent recovery in the CAD against the U.S. dollar.

This report is intended for general circulation only. It should not be construed as a recommendation, or an offer (or solicitation of an offer) to buy or sell any financial products. The information provided does not take into account your specific investment objectives, financial situation or particular needs. Before you act on any recommendation that may be contained in this report, independent advice ought to be sought from a financial adviser regarding the suitability of the investment product, taking into account your specific investment objectives, financial situation or particular needs.
StoneX Financial Pte. Ltd., may distribute reports produced by its respective foreign entities or affiliates within the StoneX group of companies or third parties pursuant to an arrangement under Regulation 32C of the Financial Advisers Regulations. Where the report is distributed to a person in Singapore who is not an accredited investor, expert investor or an institutional investor (as defined in the Securities Futures Act), StoneX Financial Pte. Ltd. accepts legal responsibility to such persons for the contents of the report only to the extent required by law. Singapore recipients should contact StoneX Financial Pte. Ltd. at 6826 9988 for matters arising from, or in connection with the report.
In the case of all other recipients of this report, to the extent permitted by applicable laws and regulations neither StoneX Financial Pte. Ltd. nor its associated companies will be responsible or liable for any loss or damage incurred arising out of, or in connection with, any use of the information contained in this report and all such liability is hereby expressly disclaimed. No representation or warranty is made, express or implied, that the content of this report is complete or accurate.
StoneX Financial Pte. Ltd. is not under any obligation to update this report.
Trading CFDs carries a high level of risk that may not be suitable for some investors. Consider your investment objectives, level of experience, financial resources, risk appetite and other relevant circumstances carefully. The possibility exists that you could lose some or all of your investments, including your initial deposits. If in doubt, please seek independent expert advice. Visit www.forex.com/en-sg/terms-and-policies for the complete Risk Disclosure Statement.