



EUR/USD forecast: Technical Tuesday | August 25, 2026
The relative calm in the energy and bond markets have allowed the US dollar and equities to make a slightly positive start to the week. America’s economic war on Iran also failed to trigger any panic, leaving investors with little to chew over until the release of US inflation data on Wednesday and Kevin Warsh’s speech at the Jackson Hole Symposium on Friday.
Share this:

The relative calm in the energy and bond markets have allowed the US dollar and equities to make a slightly positive start to the week. America’s economic war on Iran also failed to trigger any panic, leaving investors with little to chew over until the release of US inflation data on Wednesday and Kevin Warsh’s speech at the Jackson Hole Symposium on Friday. For now, consolidation is the name of the game but the risks to the near term EUR/USD forecast remains tilted to the upside.
Could Pakistan help revived US-Iran talks?
Oil prices fell yesterday after the US announced new sanctions on Iran and threatened economic penalties against countries that fail to cut ties with Tehran. China is the obvious focus. A serious revival of US-China trade tensions would be negative for the dollar, consistent with the currency’s relationship with the trade dispute last year.
Markets are hoping that the new wave of sanctions could bring Tehran back to the negotiating table, which partly explains why the price of oil has fallen back in the last couple of days.
Apparently, there is also a fresh push from Pakistan to try and re-start the stalled talks. Al-Arabiya reported that Pakistan’s Asim Munir is carrying an offer to Tehran to halt the siege and lift sanctions under the memorandum of understanding. Oil fell by an additional 3% on the back of this MF Albright it remains to be seen whether the losses will hold and whether this will lead to anything significant between the two sides.
German economy continues to surprise: Ifo rises to 1-year high
One of Germany’s most important leading indicators, the Ifo index, which is based on surveyed manufacturers, builders, wholesalers, services and retailers, once again came out stronger than expected this morning. Despite everything that’s going on right now, most worryingly in the energy market, the Ifo increased to 88.8 in August, from 86.6 in July. The index has now risen for the fourth consecutive month to a one-year-high. Not only did the surgery’s current assessment improved, but so too did the expectations component.
The latest data shows Germany’s economy and sentiment has become immune to the oil shock to some degree, which explains why the DAX is trading close to record highs and why the euro refuses to succumb to pressure.
Bond market uncertainty lingers for the dollar ahead of key data
The US dollar continues to take its cue from the bond market, where a firmer session yesterday eased some pressure on the greenback. Yields remain near multi-year highs, however, and any further signs of stress here could easily send the greenback lower once more.
Some attention will be on US data this week, ahead of Jackson Hole summit. Today, attention turns to housing figures and August consumer confidence, following softer readings in June and July.
The balance of risks for the dollar remains tilted to the downside, although the next decisive move is unlikely to happen until Kevin Warsh’s speech at Jackson Hole on Friday.
Technical EUR/USD forecast: Bear trap?
The EUR/USD chart may be looking a little more bearish again after two consecutive doji candles following the recent sharp advance. But is this simply another trap for the bears?
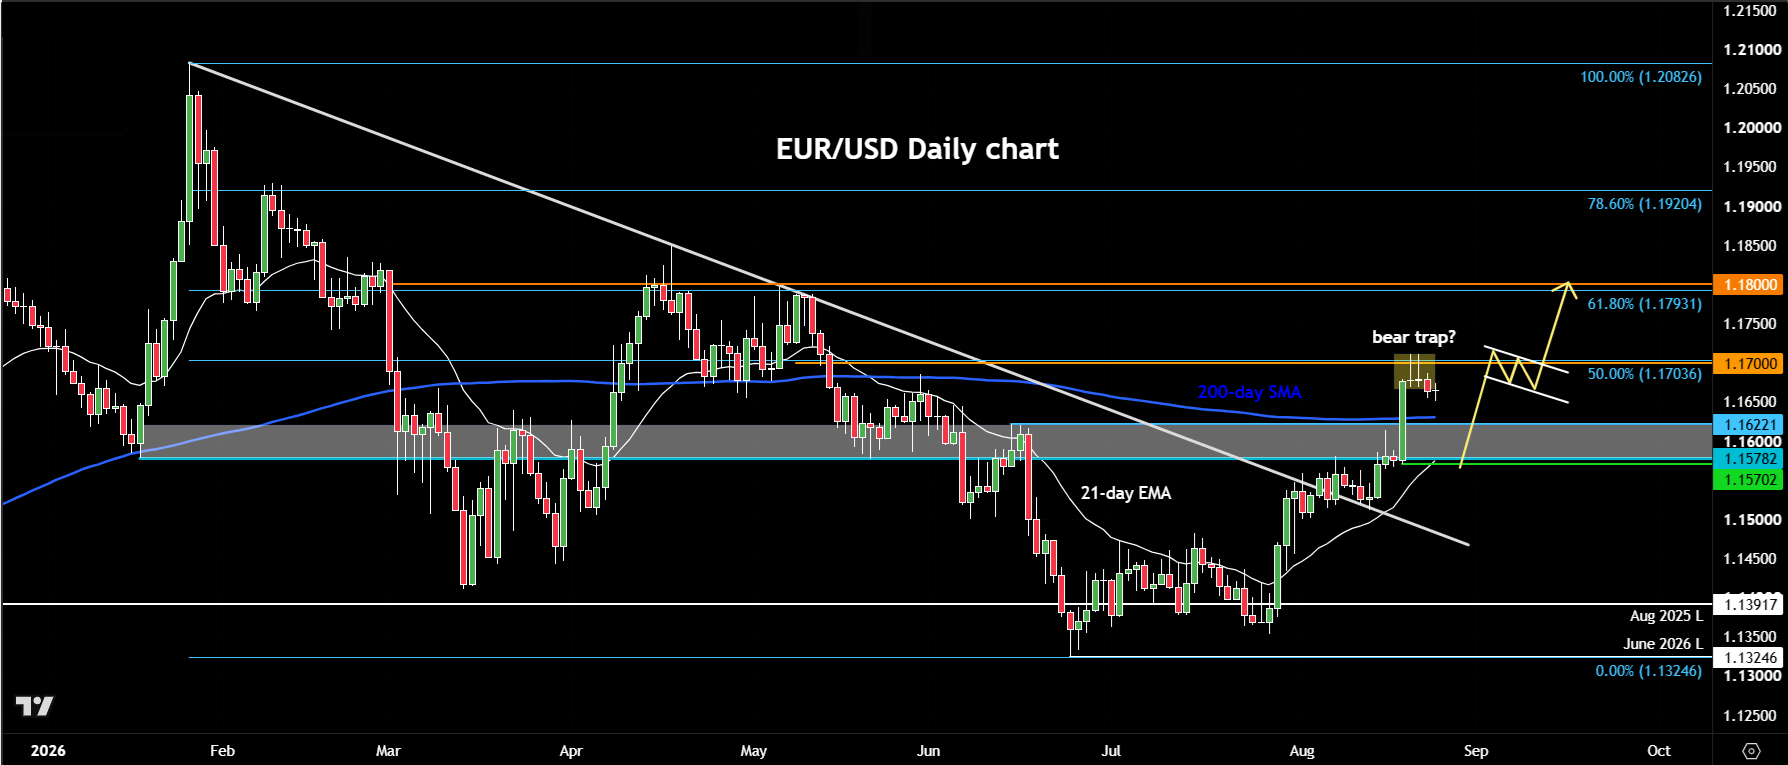
The technical EUR/USD forecast has turned decisively more constructive following the break above the previous bearish trend and the subsequent upside follow-through. The pair has already reached its first major target around 1.1700, where the 50% Fibonacci retracement of the January-to-June decline comes into play. It has since stalled at this level, forming two doji candles over the past two sessions.
In isolation, that would normally be interpreted as a warning sign for the bulls. But context matters. Given the scale of the preceding breakout, the current pause could instead prove to be a bear trap. A modest pullback would not necessarily change the broader picture and could even help clear out some of the recent long positions before another attempt higher.
On the downside, the 1.1575–1.1625 area is now the key support zone. The upper end of this range is roughly where the 200-day moving average comes into play, while the lower end marks the origin of the recent breakout.
As long as EUR/USD holds above 1.1575, the technical bias remains bullish. A sustained move back below this level, however, would weaken the current bullish structure and raise the prospect that the breakout was ultimately a false one.
Above 1.1700, attention would turn towards 1.1800, where the 61.8% Fibonacci retracement of the January-to-June decline sits. For now, the key question is whether this latest pause develops into a deeper correction – or simply sets the stage for another leg higher. For what it is worth, I think the latter.

-- Written by Fawad Razaqzada, Market Analyst
Follow Fawad on Twitter @Trader_F_R
Latest market news




Open an account in minutes
Experience award-winning platforms with fast and secure execution, and enjoy tight spreads from 0.5 pts on FX and 0.3 pts on indices.
Economic calendar
Web Trader platform
Our sophisticated web-based platform is packed with features.
Related articles
US Dollar, GBP/USD, USD/CAD, USD/CHF, Gold Weekly Technical Outlook 11 2 2026
Sr. Technical Strategist Michael Boutros highlights the levels that matter on the USD Majors, commodities, and equity indices charts this week.

US Midterm Forecast: The Key Risks for Traders to Watch Through the US Elections
Prediction markets are pricing in nearly 75% odds of a Democratic sweep in this week’s US midterm elections, a development that would result in a split from the single party Republican rule of the past two years - what will it mean for markets?

Gold forecast: XAU/USD stabilised after recent falls – for now
Gold has started the first week of the new month trying to recover some ground after another bruising week. Oil prices have taken a sharp drop and that has allowed risk assets to bounce back, which has clearly helped the precious metal too. However, with sentiment remaining bearish towards the metals, and with $4000 level having been taken out last week, the path of least resistance is to the downside for gold.
This report is intended for general circulation only. It should not be construed as a recommendation, or an offer (or solicitation of an offer) to buy or sell any financial products. The information provided does not take into account your specific investment objectives, financial situation or particular needs. Before you act on any recommendation that may be contained in this report, independent advice ought to be sought from a financial adviser regarding the suitability of the investment product, taking into account your specific investment objectives, financial situation or particular needs.
StoneX Financial Pte. Ltd., may distribute reports produced by its respective foreign entities or affiliates within the StoneX group of companies or third parties pursuant to an arrangement under Regulation 32C of the Financial Advisers Regulations. Where the report is distributed to a person in Singapore who is not an accredited investor, expert investor or an institutional investor (as defined in the Securities Futures Act), StoneX Financial Pte. Ltd. accepts legal responsibility to such persons for the contents of the report only to the extent required by law. Singapore recipients should contact StoneX Financial Pte. Ltd. at 6826 9988 for matters arising from, or in connection with the report.
In the case of all other recipients of this report, to the extent permitted by applicable laws and regulations neither StoneX Financial Pte. Ltd. nor its associated companies will be responsible or liable for any loss or damage incurred arising out of, or in connection with, any use of the information contained in this report and all such liability is hereby expressly disclaimed. No representation or warranty is made, express or implied, that the content of this report is complete or accurate.
StoneX Financial Pte. Ltd. is not under any obligation to update this report.
Trading CFDs carries a high level of risk that may not be suitable for some investors. Consider your investment objectives, level of experience, financial resources, risk appetite and other relevant circumstances carefully. The possibility exists that you could lose some or all of your investments, including your initial deposits. If in doubt, please seek independent expert advice. Visit www.forex.com/en-sg/terms-and-policies for the complete Risk Disclosure Statement.