



EUR/USD Outlook: Hormuz tensions tilt risks back to the downside
Markets are back to playing headline hockey as the US resumes strikes on Iran. That may not trigger an immediate plunge in EUR/USD, but it does leave the balance of risks skewed to the downside.
Share this:
- Fresh US strikes reignite Hormuz disruption fears
- Europe's energy vulnerability back in focus
- Euro and European cyclicals resume underperforming
- Bearish wedge points to renewed downside risk
Back to pricing energy risk
The US has resumed strikes on Iran after attacks on commercial shipping transiting the Strait of Hormuz, raising the prospect that markets may once again have to price the risk of prolonged disruption to one of the world's most important energy chokepoints.
As Donald Trump declares the memorandum of understanding signed only weeks ago between the US and Iran "over", so too may be the brief respite for the euro, reviving simmering fears over energy security.
While it's too early to know whether the Strait will face prolonged disruption, the prospect alone is enough to remind investors that the region remains far more exposed to Middle Eastern energy shocks than the United States.
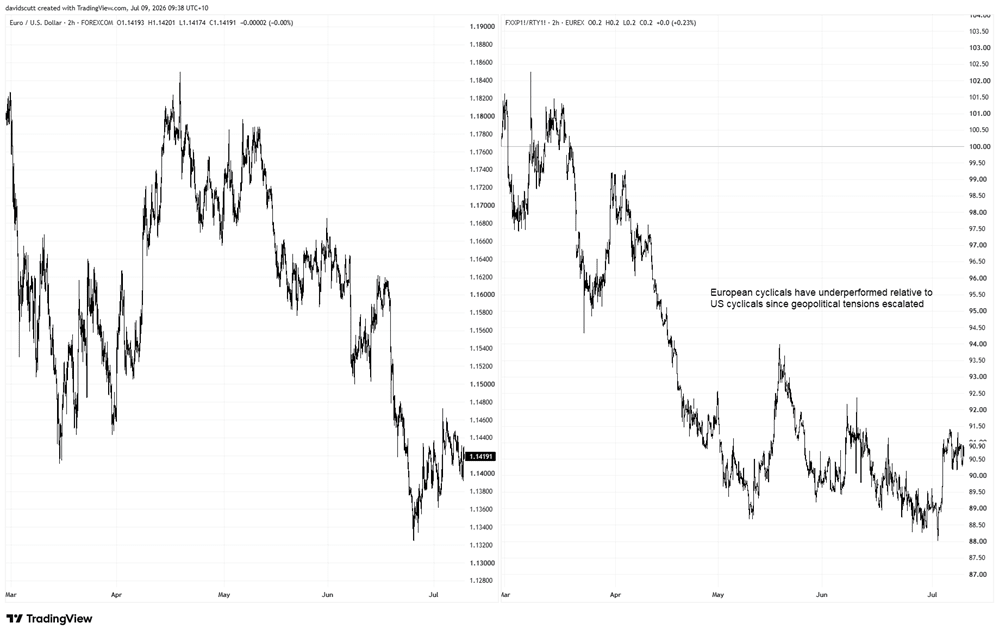
Even if higher energy prices increase the odds of another ECB rate hike later this month, the potential hit to growth may prove the more important driver, tilting the balance of risks for the euro and European assets to the downside, as shown in the chart below.
Europe left behind
Source: TradingView
The left-hand panel tracks EUR/USD since the Friday before the initial US strikes on Iran in late February. Alongside it is the performance of Euro Stoxx 600 futures relative to Russell 2000 futures over the same period. The latter were chosen because both are broader, more cyclical equity benchmarks, avoiding the outsized influence that mega-cap tch companies exert on US indices such as the S&P 500 and Nasdaq.
Since the conflict began, the euro has weakened while European equities have generally underperformed comparable US peers. To be sure, geopolitics is far from the only driver behind that divergence, but Europe's greater reliance on imported energy makes it far more vulnerable, impacting economic sentiment and capital flows.
However, while Trump's declaration that the MOU is "over" has revived geopolitical risk, traders are unlikely to price in the worst case scenario immediately. Throughout the conflict, markets have repeatedly lurched between reports of imminent de-escalation and renewed hostilities, whether from Trump himself or sources familiar with the negotiations.
The prolonged whipsawing may temper any immediate knee-jerk reaction, with trader instead likely to demand clearer evidence that the latest escalation will have a lasting impact on energy supplies and European economy. Rather than a single sharp move, EUR/USD may instead be vulnerable to a gradual grind lower, punctuated by bouts of volatility as markets once again find themselves playing headline hockey.
Technicals and fundamentals align
Source: TradingView
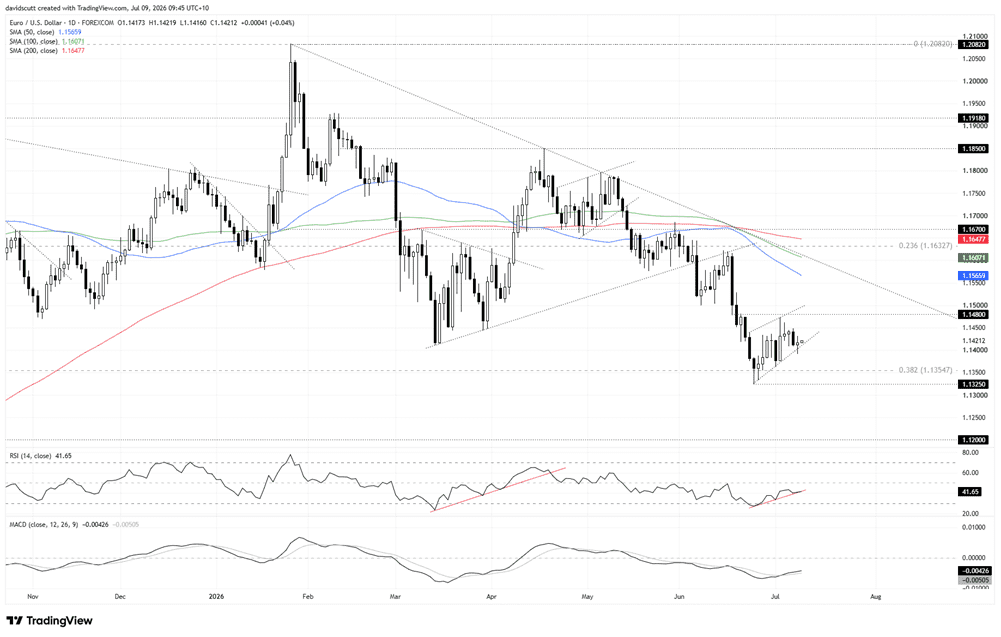
When you zoom out, the price action continues to favour the bears with EUR/USD carving out a series of lower highs and lower lows. It also remains beneath its key medium and longer-term moving averages, all of which are now starting to roll over and carry a negative slope.
And when you zoom in, the price appears to be sitting in what resembles a rising wedge, a pattern typically associated with bearish continuation. Admittedly, the structure isn't the cleanest, but a sustained break beneath wedge support would increase the risk of a retest of the lows set in June, and potentially an extension of the broader bearish trend.
If that scenario were to unfold, the first level to watch is the 38.2% Fibonacci retracement of the April 2025 advance at 1.1355, followed by the June 24 swing low at 1.1325. Should that latter level give way, there's not a lot of meaningful technical support to speak of until 1.1200, an area that repeatedly influenced price action following the Liberation Day tariff announcement in April 2025.
On the topside, the pair has repeatedly struggled above 1.1450, with another minor resistance zone sitting around 1.1480. Above there, 1.1500 and 1.1566 are the levels to watch.
The story from the oscillators is one of diminishing downside strength, not building upside momentum. RSI has lifted from oversold territory but, at around 42, remains below the midpoint and looks close to breaking the very shallow uptrend it's been sitting in over recent weeks. MACD has crossed above its signal line, but that merely suggests downside momentum has eased rather than been eradicated altogether. For now, that continues to favour selling into strength.
Latest market news




Open an account in minutes
Experience award-winning platforms with fast and secure execution, and enjoy tight spreads from 0.5 pts on FX and 0.3 pts on indices.
Economic calendar
Web Trader platform
Our sophisticated web-based platform is packed with features.
Related articles
GBP/USD, GBP/AUD: Sterling Rally Faces a BoE Reality Check
Sterling faces a reality check as the BoE prepares to hike rates. GBP/USD and GBP/AUD approach resistance, leaving bulls vulnerable to dovish guidance.
Swiss Franc Short-term Outlook: USD/CHF Selloff Nears Critical Support Ahead of NFP 11 4 2026
USD/CHF bears are closing in on critical trend support, with the next reaction likely to determine whether the October decline has further to run.

US Midterm Fallout: What Does the “Blue Tsunami” Mean for the S&P 500?
Democrats made sweeping gains in the US midterm elections, winning control of both the House and Senate - what does it mean for the S&P 500 and the AI trade?

This report is intended for general circulation only. It should not be construed as a recommendation, or an offer (or solicitation of an offer) to buy or sell any financial products. The information provided does not take into account your specific investment objectives, financial situation or particular needs. Before you act on any recommendation that may be contained in this report, independent advice ought to be sought from a financial adviser regarding the suitability of the investment product, taking into account your specific investment objectives, financial situation or particular needs.
StoneX Financial Pte. Ltd., may distribute reports produced by its respective foreign entities or affiliates within the StoneX group of companies or third parties pursuant to an arrangement under Regulation 32C of the Financial Advisers Regulations. Where the report is distributed to a person in Singapore who is not an accredited investor, expert investor or an institutional investor (as defined in the Securities Futures Act), StoneX Financial Pte. Ltd. accepts legal responsibility to such persons for the contents of the report only to the extent required by law. Singapore recipients should contact StoneX Financial Pte. Ltd. at 6826 9988 for matters arising from, or in connection with the report.
In the case of all other recipients of this report, to the extent permitted by applicable laws and regulations neither StoneX Financial Pte. Ltd. nor its associated companies will be responsible or liable for any loss or damage incurred arising out of, or in connection with, any use of the information contained in this report and all such liability is hereby expressly disclaimed. No representation or warranty is made, express or implied, that the content of this report is complete or accurate.
StoneX Financial Pte. Ltd. is not under any obligation to update this report.
Trading CFDs carries a high level of risk that may not be suitable for some investors. Consider your investment objectives, level of experience, financial resources, risk appetite and other relevant circumstances carefully. The possibility exists that you could lose some or all of your investments, including your initial deposits. If in doubt, please seek independent expert advice. Visit www.forex.com/en-sg/terms-and-policies for the complete Risk Disclosure Statement.