




EURGBP Testing 2019 Lows
With today’s price action in Euro and Sterling, the next pair to look at is EUR/GBP.
Share this:

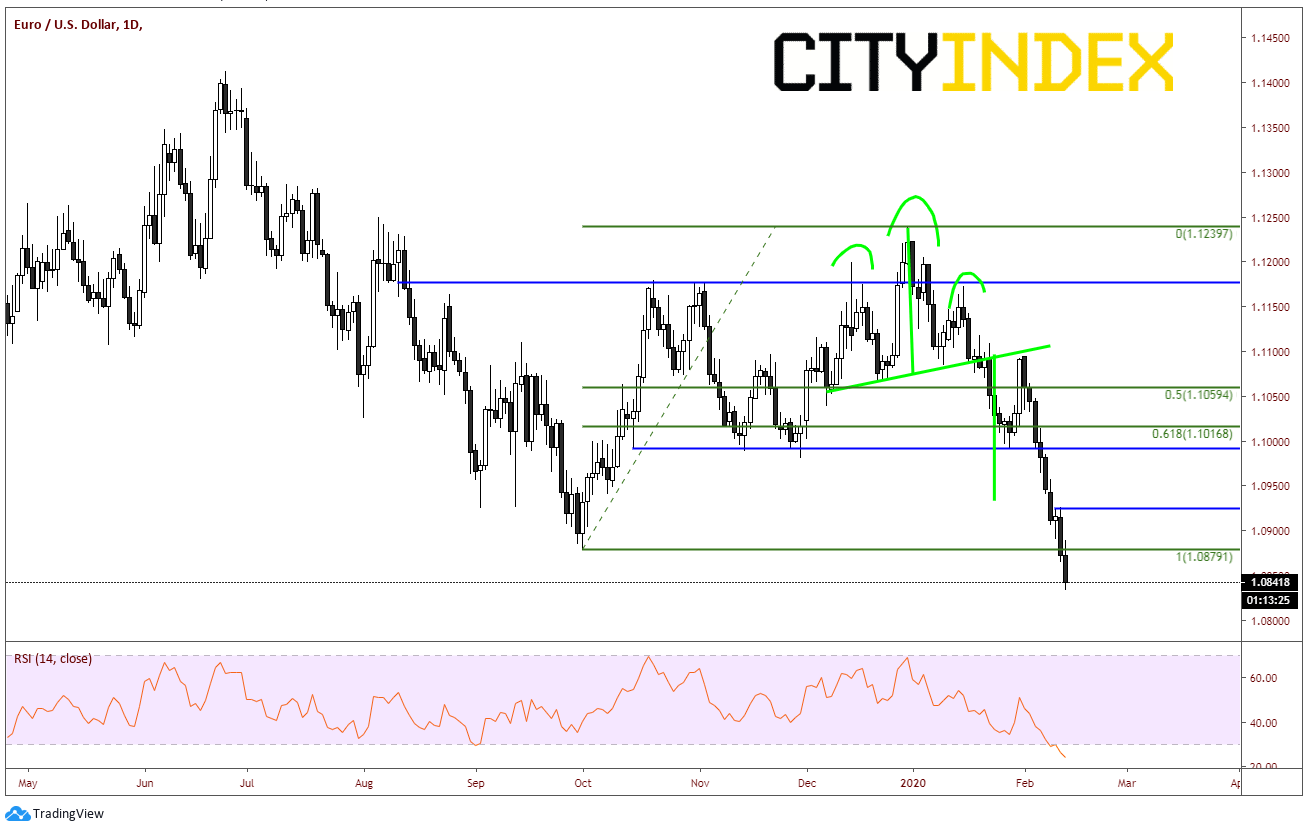
EUR/USD has been down 8 of the last 9 trading days, and the 1 day it closed higher, it was only up 4 pips! Once the pair broke the neckline of the head and shoulders pattern last week, if was off to the races. Price has traded from 1.1094 down to today’s lows near 1.0834, which hasn’t been seen since May 2017.
Source: Tradingview, City Index
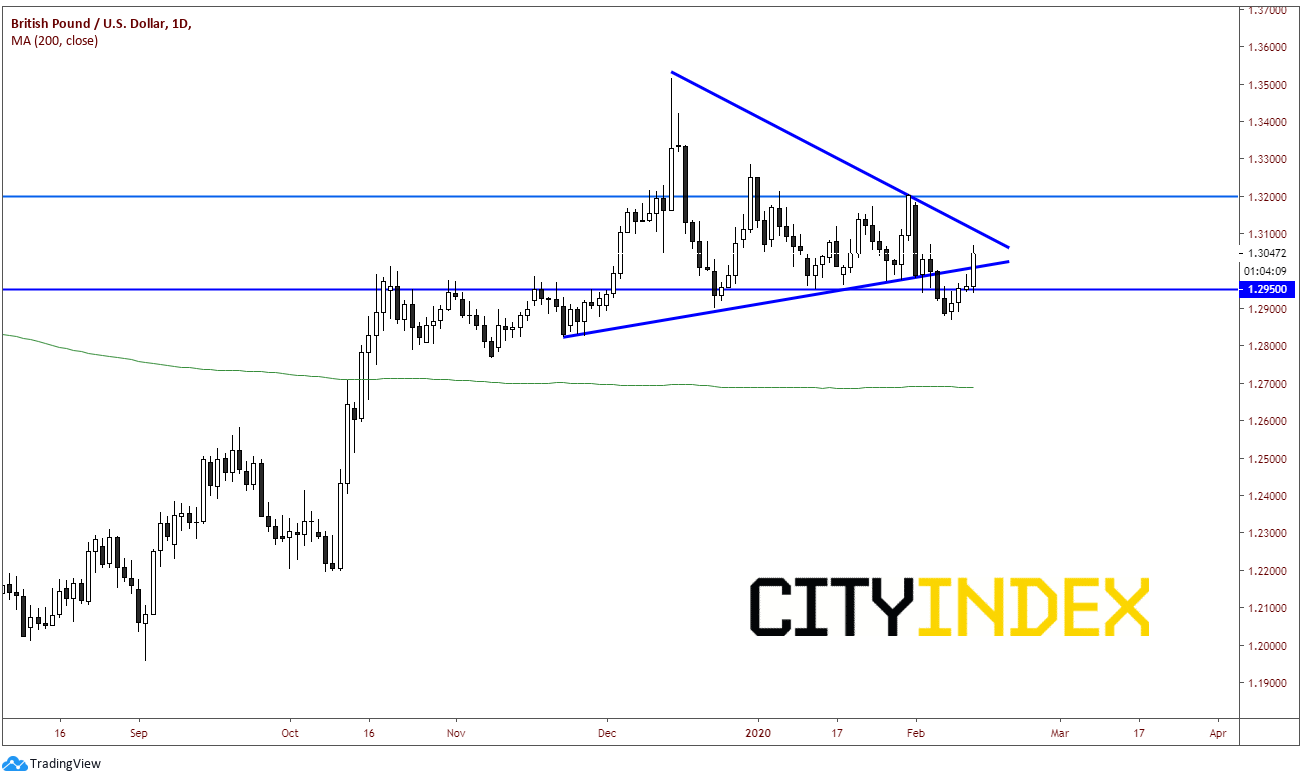
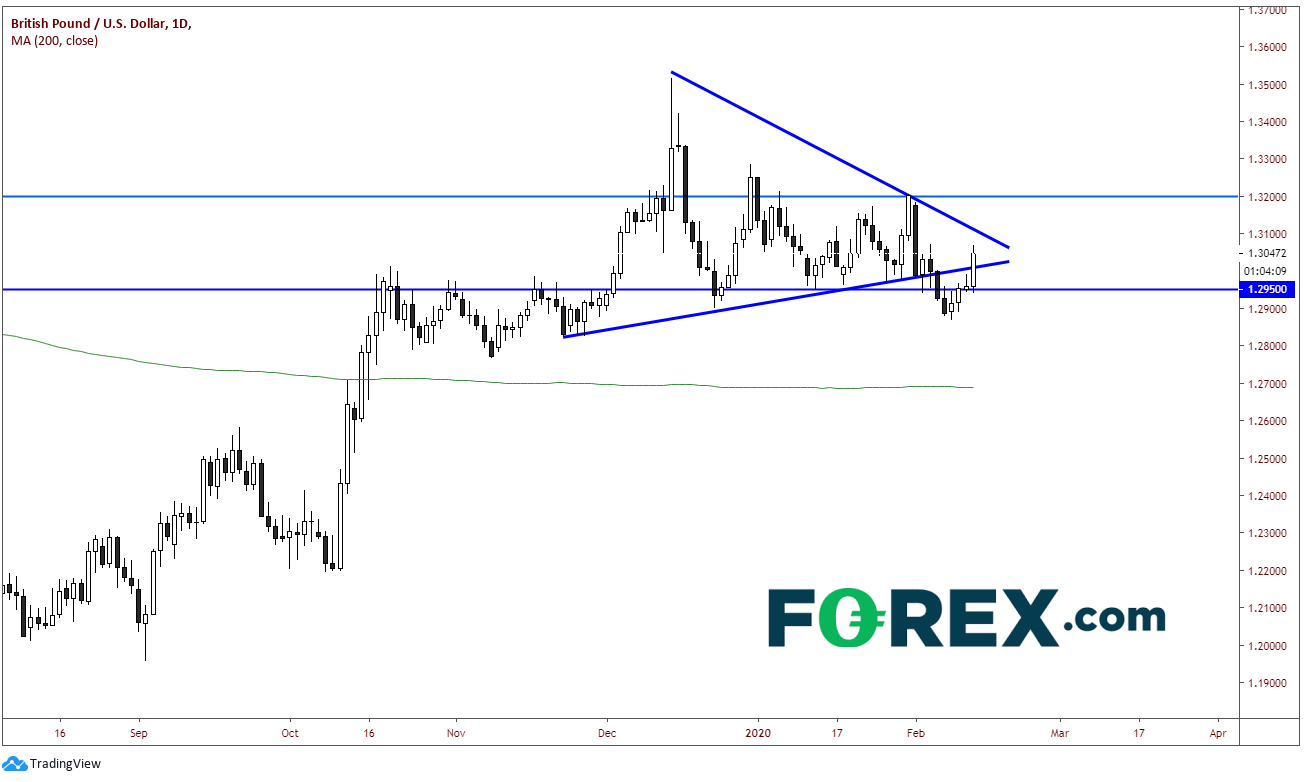
Since election day on December 13th, 2019, GBP/USD has been trading in a symmetrical triangle. Price hadn’t done too much until last week when it tried to break lower from near the apex of the triangle, only to have that be a false breakdown and trade back into the apex today. Prime Minister Boris Johnson replaced Finance Minister Sajid David with Rishi Sunak, who traders believe will be more likely to induce more fiscal stimulus into the economy. This caused GBP/USD to go bid.
Source: Tradingview, City Index
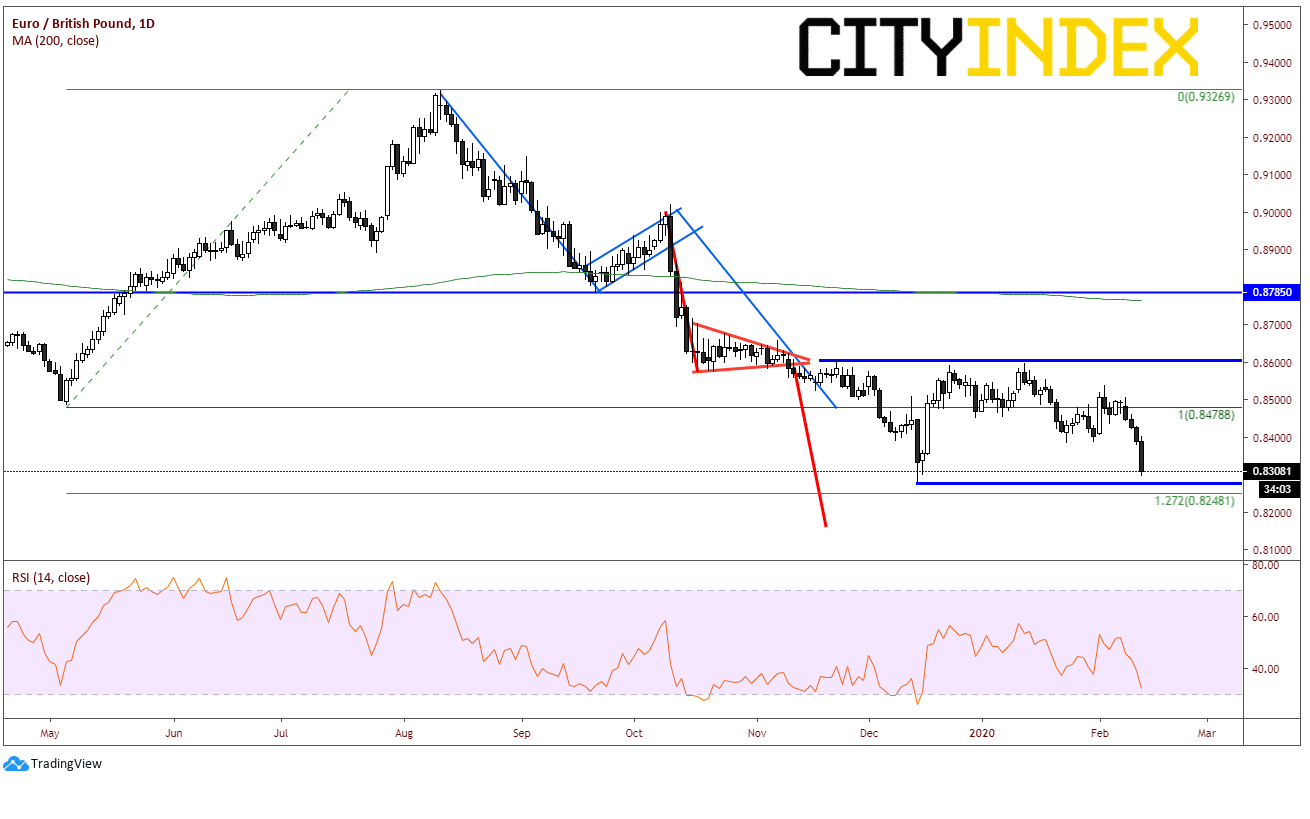
With today’s price action in the Euro (lower) and Pound (higher), it seems logical that the next pair one would look at would be EUR/GBP, which is down almost 1% on the day. Technically, the pair has been trading nicely since August 2019, completing a flag pattern (blue) and almost reaching target (close enough for horseshoes) of a pennant pattern (orange). EUR/GBP reached a low of .8275 on UK election day, which was the low of the year for the pair. Price then bounced. However, with the Euro lower and the Pound stronger today, price is nearing the election lows once again. Price is currently trading near .8305. The first support for EUR/GBP is the .8275 level. Below that is the 127.2% Fibonacci extension level from the lows of May 8th, 2019 to the highs on August 12th, 2019 which is .8248. And although the previous mentioned pennant was almost reached, it once again is on our radar near .8165.
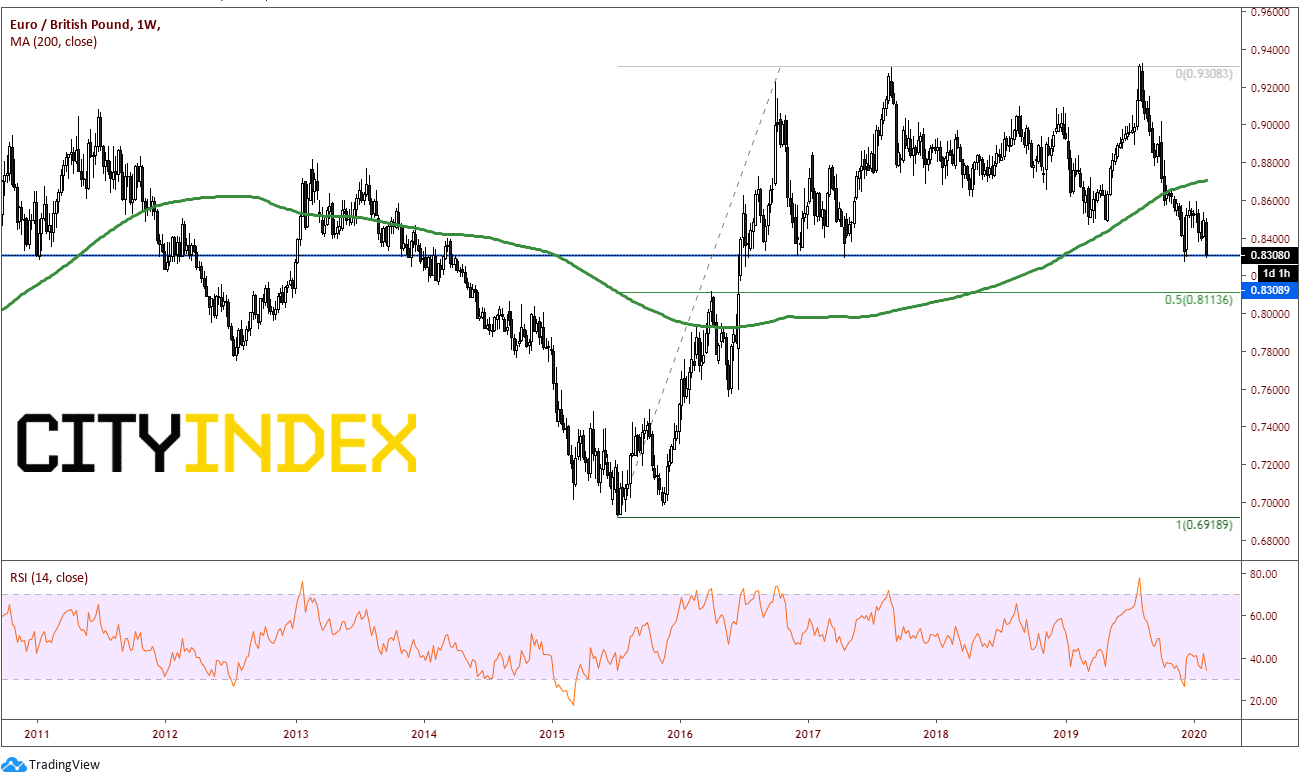
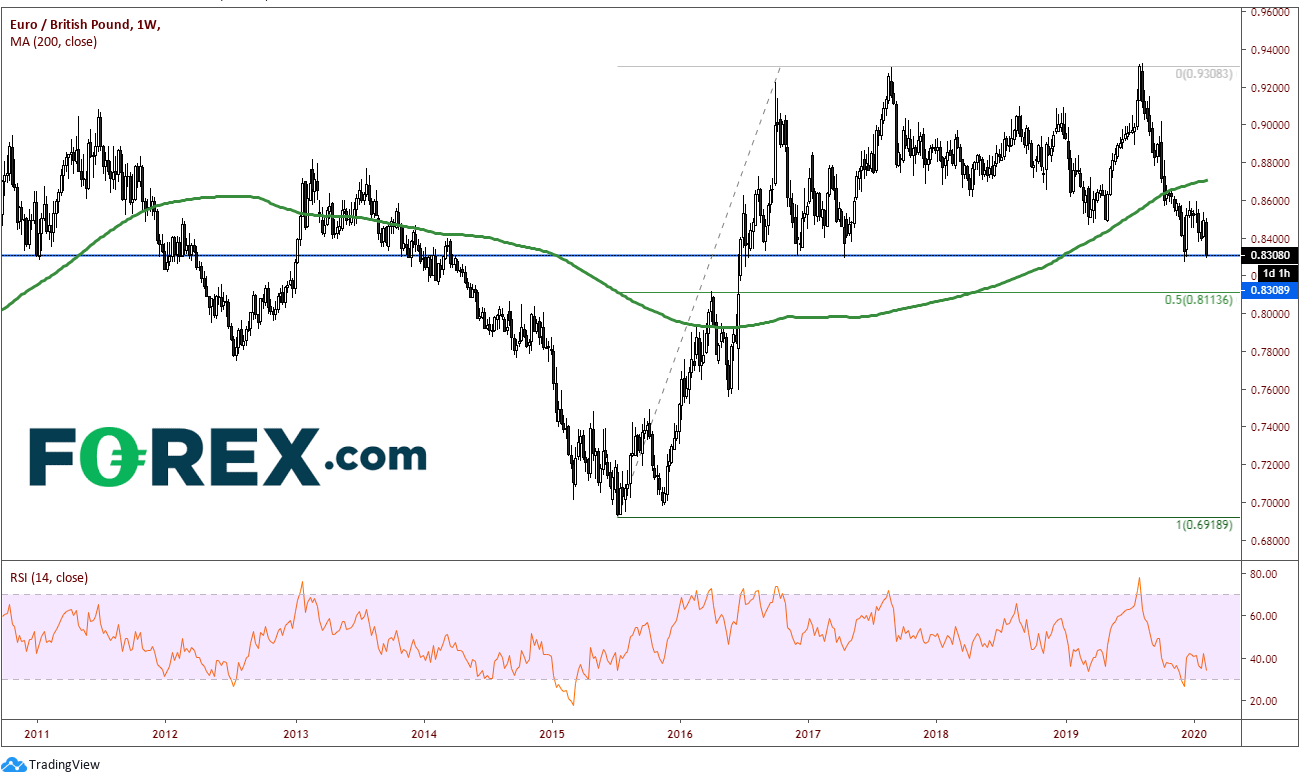
Below that, we have to zoom out to a weekly chart as EUR/GBP would be trading at 2016 levels. There is horizontal support and the 50% retracement level from the July 2015 lows to the summer 2019 highs, near .8115. Although that level is 200 pips lower, if price does reach it, there are likely to be strong buyers with ahead of that level with stops building below it.
Source: Tradingview, City Index
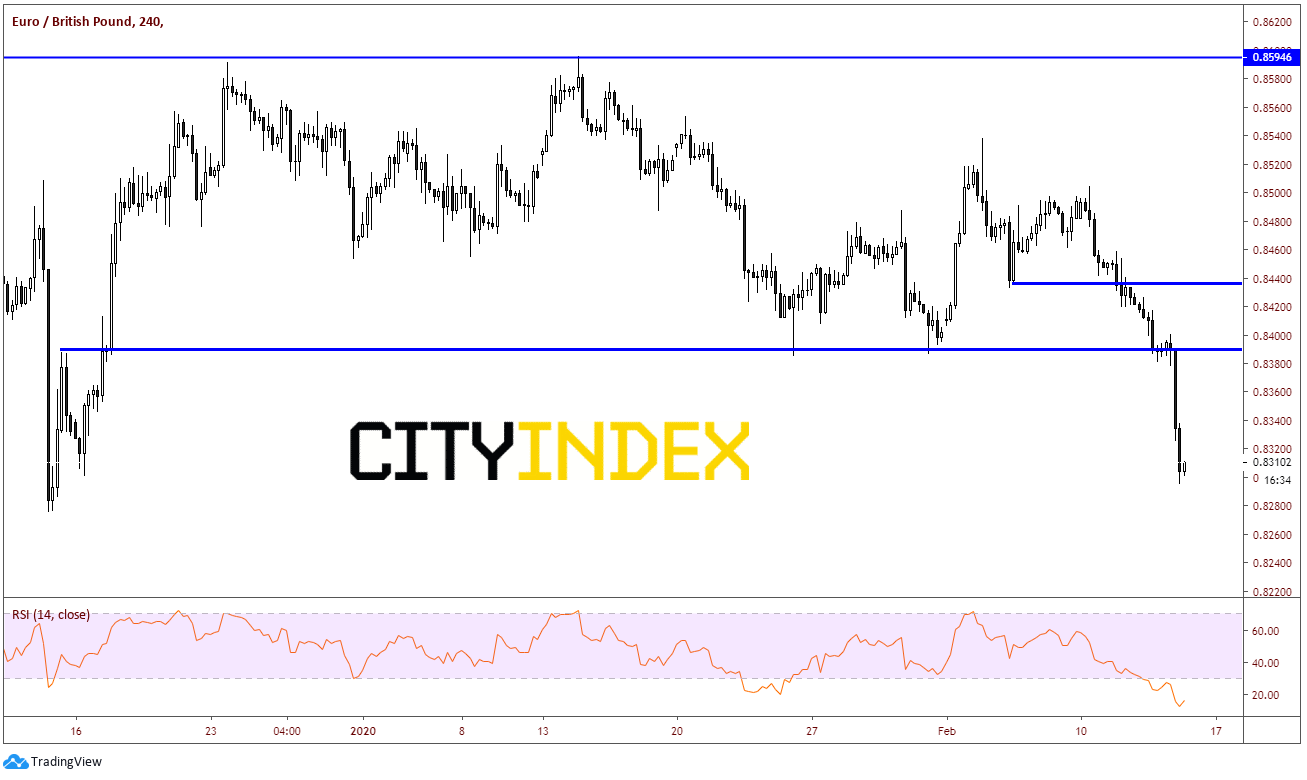
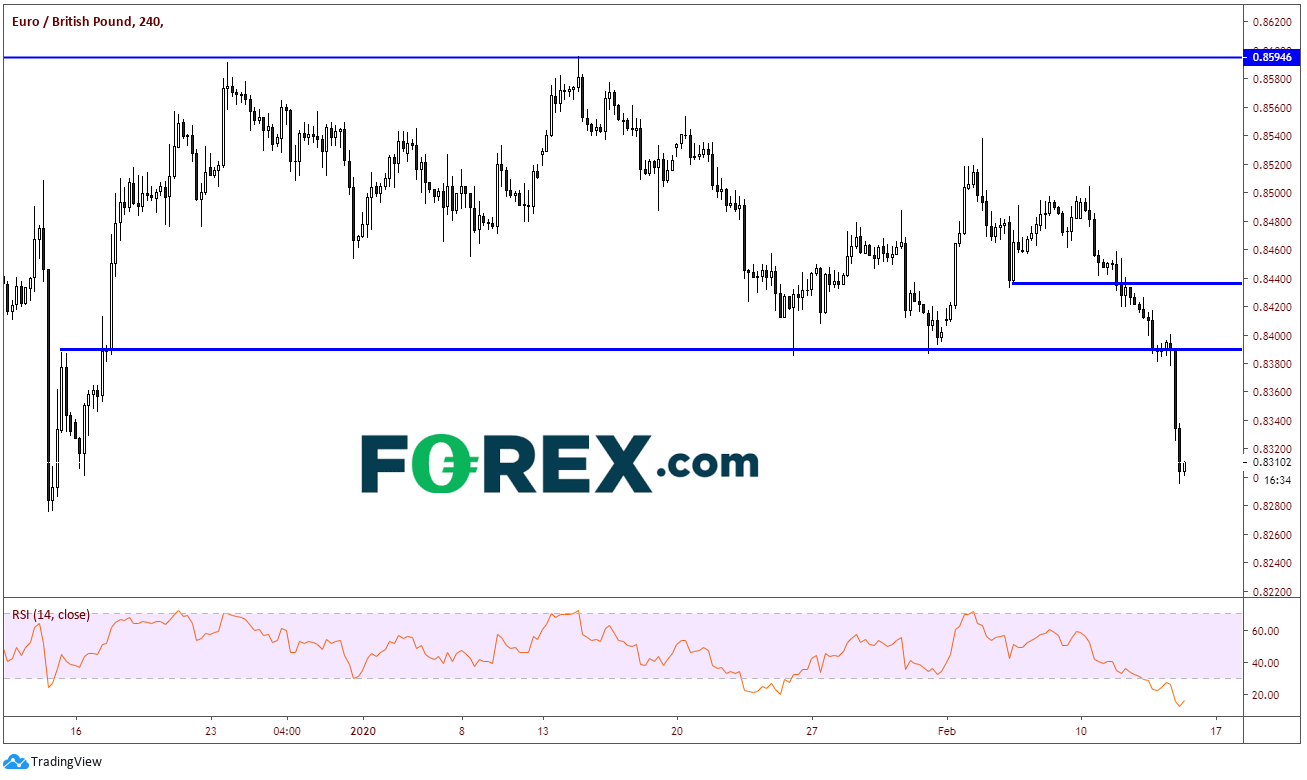
First resistance isn’t until near .8390, however notice on the 240-minute chart how the RSI in below 20, in extremely oversold territory. Price may bounce for the RSI to unwind. Above there, the next level of resistance is near .8435. The ultimate resistance though isn’t until the 2020 highs near .8595.
Source: Tradingview, City Index
Although EUR/GBP appears to be heading lower, the short-term RSI allows for the opportunity to bounce first. However, given that EUR/USD has closed near the lows of the day today (again), we can expect sellers to be looking for any bounce to take advantage and push price lower.
EUR/USD has been down 8 of the last 9 trading days, and the 1 day it closed higher, it was only up 4 pips! Once the pair broke the neckline of the head and shoulders pattern last week, if was off to the races. Price has traded from 1.1094 down to today’s lows near 1.0834, which hasn’t been seen since May 2017.
Source: Tradingview, FOREX.com
Since election day on December 13th, 2019, GBP/USD has been trading in a symmetrical triangle. Price hadn’t done too much until last week when it tried to break lower from near the apex of the triangle, only to have that be a false breakdown and trade back into the apex today. Prime Minister Boris Johnson replaced Finance Minister Sajid David with Rishi Sunak, who traders believe will be more likely to induce more fiscal stimulus into the economy. This caused GBP/USD to go bid.
Source: Tradingview, FOREX.com
With today’s price action in the Euro (lower) and Pound (higher), it seems logical that the next pair one would look at would be EUR/GBP, which is down almost 1% on the day. Technically, the pair has been trading nicely since August 2019, completing a flag pattern (blue) and almost reaching target (close enough for horseshoes) of a pennant pattern (orange). EUR/GBP reached a low of .8275 on UK election day, which was the low of the year for the pair. Price then bounced. However, with the Euro lower and the Pound stronger today, price is nearing the election lows once again. Price is currently trading near .8305. The first support for EUR/GBP is the .8275 level. Below that is the 127.2% Fibonacci extension level from the lows of May 8th, 2019 to the highs on August 12th, 2019 which is .8248. And although the previous mentioned pennant was almost reached, it once again is on our radar near .8165.

Below that, we have to zoom out to a weekly chart as EUR/GBP would be trading at 2016 levels. There is horizontal support and the 50% retracement level from the July 2015 lows to the summer 2019 highs, near .8115. Although that level is 200 pips lower, if price does reach it, there are likely to be strong buyers with ahead of that level with stops building below it.
Source: Tradingview, FOREX.com
First resistance isn’t until near .8390, however notice on the 240-minute chart how the RSI in below 20, in extremely oversold territory. Price may bounce for the RSI to unwind. Above there, the next level of resistance is near .8435. The ultimate resistance though isn’t until the 2020 highs near .8595.
Source: Tradingview, FOREX.com
Although EUR/GBP appears to be heading lower, the short-term RSI allows for the opportunity to bounce first. However, given that EUR/USD has closed near the lows of the day today (again), we can expect sellers to be looking for any bounce to take advantage and push price lower.



Open an account in minutes
Experience award-winning platforms with fast and secure execution, and enjoy tight spreads from 0.5 pts on FX and 0.3 pts on indices.
Economic calendar
Web Trader platform
Our sophisticated web-based platform is packed with features.
Related articles

New Zealand inflation report puts spotlight on hawkish RBNZ pricing
New Zealand's recovery is barely underway, yet markets have priced a series of RBNZ rate hikes. Thursday's inflation report will put that hawkish recalibration under the microscope.


British Pound Rallies into CPI as BoE Hike Bets Firm - GBP/USD, GBP/AUD
Sterling rallies ahead of UK inflation as BoE hike bets firm. GBP/USD tests resistance while GBP/AUD forms a potential bullish reversal.

GBP/USD Analysis: Sterling Gains Momentum After Employment Surprise
Over recent trading sessions, the British pound has begun to show a notable recovery. This can be observed in the performance of GBP/USD, which has gained more than 1.3% over the last four sessions, reflecting a consistent improvement in sterling's strength against the U.S. dollar.

This report is intended for general circulation only. It should not be construed as a recommendation, or an offer (or solicitation of an offer) to buy or sell any financial products. The information provided does not take into account your specific investment objectives, financial situation or particular needs. Before you act on any recommendation that may be contained in this report, independent advice ought to be sought from a financial adviser regarding the suitability of the investment product, taking into account your specific investment objectives, financial situation or particular needs.
StoneX Financial Pte. Ltd., may distribute reports produced by its respective foreign entities or affiliates within the StoneX group of companies or third parties pursuant to an arrangement under Regulation 32C of the Financial Advisers Regulations. Where the report is distributed to a person in Singapore who is not an accredited investor, expert investor or an institutional investor (as defined in the Securities Futures Act), StoneX Financial Pte. Ltd. accepts legal responsibility to such persons for the contents of the report only to the extent required by law. Singapore recipients should contact StoneX Financial Pte. Ltd. at 6826 9988 for matters arising from, or in connection with the report.
In the case of all other recipients of this report, to the extent permitted by applicable laws and regulations neither StoneX Financial Pte. Ltd. nor its associated companies will be responsible or liable for any loss or damage incurred arising out of, or in connection with, any use of the information contained in this report and all such liability is hereby expressly disclaimed. No representation or warranty is made, express or implied, that the content of this report is complete or accurate.
StoneX Financial Pte. Ltd. is not under any obligation to update this report.
Trading CFDs carries a high level of risk that may not be suitable for some investors. Consider your investment objectives, level of experience, financial resources, risk appetite and other relevant circumstances carefully. The possibility exists that you could lose some or all of your investments, including your initial deposits. If in doubt, please seek independent expert advice. Visit www.forex.com/en-sg/terms-and-policies for the complete Risk Disclosure Statement.