



EUR/NOK running higher as ECB members remain hawkish
Despite the NorgesBank saying that it will hike rates 25bps at in March, the ECB has pre-committed to increasing rates by 50bps and says that there is more to come.
Share this:

On January 19th, the Norges bank left rates unchanged at 2.75%, but said that rates will need to be increased to bring inflation down towards its target. The central bank noted that the future policy rate path will depend on economic developments. Since then, December Retail Sales were released at -3.6% MoM vs an expectation of only -0.7% and a prior reading of 0.8%. In addition, Industrial Production was -0.1% vs and expectation of +0.6% and a previous reading of -0.7%. Inflation data will be released on Friday, with expectations of a fall to -0.1% MoM vs a December reading of +0.4% MoM. The Core CPI is also expected to decrease to -0.2% MoM vs a previous reading of +0.1% MoM. Weaker economic data and weaker expected inflation may be a concern to the Norges Bank when it meets again on March 23rd (however the Norges Bank Governor’s Annual Address is on February 16th, at which time she may address this situation). However last week, the ECB hiked interest rates by 50bps to bring the key interest rate to 3.00% and said it would hike an additional 50bps at its meeting in March. Since then, ECB members have been out in droves, reinforcing the pre-commitment of the rate hike and suggesting that there may be more to come afterwards.
The result of the less hawkish Norges Bank and recent Norwegian data, combined with a hawkish ECB, has sent EUR/NOK on a tear higher. On a weekly timeframe, the pair made a post pandemic low on April 11th, 2022 at 9.4337. This turned out to be the head of an inverted head and shoulders pattern. From there, price began moving higher, briefly taking out the neckline of the pattern during the week of September 26th, 2022. However, EUR/NOK pulled back and didn’t aggressively move above the neckline until mid-December 2022 near 10.4078. Since then, the pair has been on a tear and is testing horizontal resistance and the 50% retracement from the highs March 2020 highs to the April 2022 lows near 11.2111/11.3050.

Source: Tradingview, Stone X
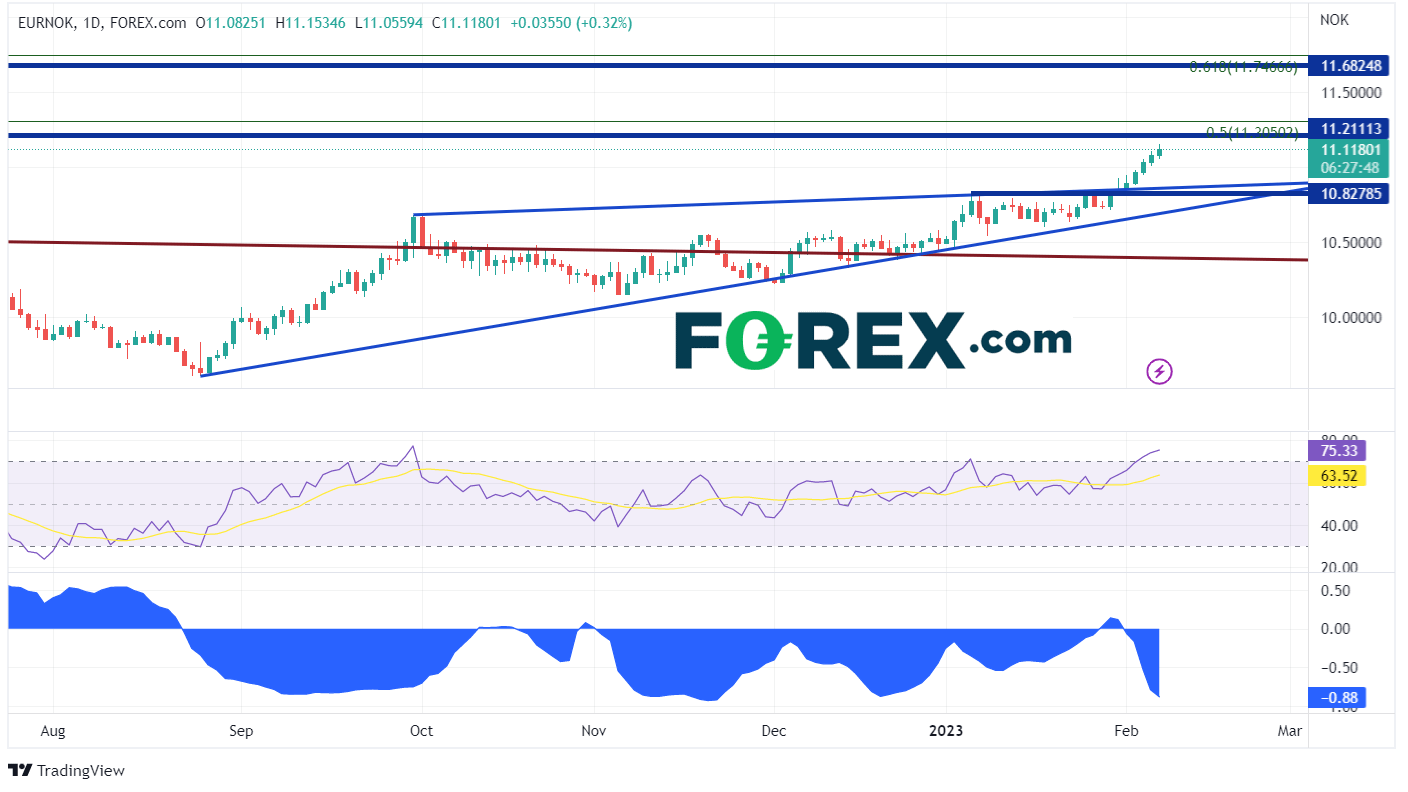
On a daily timeframe, today is the 7th trading day in a row that EUR/NOK has been moving higher. However, since moving above the necking of the inverse head and shoulders, the pair had formed an ascending wedge. Typically, one would expect price to break lower below the wedge, but EUR/NOK has defied the odds and moved higher. As previously mentioned, first resistance is previous highs dating to late October 2020 and the 50% retracement from the March 2020 highs to the April 2022 lows near 11.2111/11.3050. Above there, the pair can move to the highs from April 2020 at 11.6824, then the 61.8% Fibonacci retracement from the above-mentioned timeframe at 11.7167. However, notice that the RSI has moved into overbought territory, an indication that EUR/NOK may be ready for a pullback. First support is at the top trendline and the highs from January 5th near 10.8279. Below there, price can fall to the bottom trendline of the wedge near 10.7000, then the neckline of the previously mentioned inverted head and shoulders patten near 10.4135.
Source: Tradingview, Stone X
Also notice in the bottom panel of the chart above that the correlation coefficient between EUR/NOK and Crude Oil is -0.88. Readings below -0.80 are considered strong and prices of the assts tend to move in opposite directions. If this correlation holds, watch the direction of Crude Oil for an indication of where EUR/NOK may be headed next.
Despite the NorgesBank saying that it will hike rates 25bps in March, the ECB has pre-committed to increasing rates by 50bps and says that there is more to come. As a result, EUR/NOK is marching higher. However, the RSI is overbought on the daily timeframe, indicating a possible pullback. Given that the correlation between WTI Crude Oil and EUR/NOK is at a negative extreme, watch Crude Oil for a possible indication of which way the currency pair may move next.
On January 19th, the Norges bank left rates unchanged at 2.75%, but said that rates will need to be increased to bring inflation down towards its target. The central bank noted that the future policy rate path will depend on economic developments. Since then, December Retail Sales were released at -3.6% MoM vs an expectation of only -0.7% and a prior reading of 0.8%. In addition, Industrial Production was -0.1% vs and expectation of +0.6% and a previous reading of -0.7%. Inflation data will be released on Friday, with expectations of a fall to -0.1% MoM vs a December reading of +0.4% MoM. The Core CPI is also expected to decrease to -0.2% MoM vs a previous reading of +0.1% MoM. Weaker economic data and weaker expected inflation may be a concern to the Norges Bank when it meets again on March 23rd (however the Norges Bank Governor’s Annual Address is on February 16th, at which time she may address this situation). However last week, the ECB hiked interest rates by 50bps to bring the key interest rate to 3.00% and said it would hike an additional 50bps at its meeting in March. Since then, ECB members have been out in droves, reinforcing the pre-commitment of the rate hike and suggesting that there may be more to come afterwards.
The result of the less hawkish Norges Bank and recent Norwegian data, combined with a hawkish ECB, has sent EUR/NOK on a tear higher. On a weekly timeframe, the pair made a post pandemic low on April 11th, 2022 at 9.4337. This turned out to be the head of an inverted head and shoulders pattern. From there, price began moving higher, briefly taking out the neckline of the pattern during the week of September 26th, 2022. However, EUR/NOK pulled back and didn’t aggressively move above the neckline until mid-December 2022 near 10.4078. Since then, the pair has been on a tear and is testing horizontal resistance and the 50% retracement from the highs March 2020 highs to the April 2022 lows near 11.2111/11.3050.

Source: Tradingview, Stone X
Trade EUR/NOK now: Login or Open a new account!
• Open an account in the UK
• Open an account in Australia
• Open an account in Singapore
On a daily timeframe, today is the 7th trading day in a row that EUR/NOK has been moving higher. However, since moving above the necking of the inverse head and shoulders, the pair had formed an ascending wedge. Typically, one would expect price to break lower below the wedge, but EUR/NOK has defied the odds and moved higher. As previously mentioned, first resistance is previous highs dating to late October 2020 and the 50% retracement from the March 2020 highs to the April 2022 lows near 11.2111/11.3050. Above there, the pair can move to the highs from April 2020 at 11.6824, then the 61.8% Fibonacci retracement from the above-mentioned timeframe at 11.7167. However, notice that the RSI has moved into overbought territory, an indication that EUR/NOK may be ready for a pullback. First support is at the top trendline and the highs from January 5th near 10.8279. Below there, price can fall to the bottom trendline of the wedge near 10.7000, then the neckline of the previously mentioned inverted head and shoulders patten near 10.4135.

Source: Tradingview, Stone X
Also notice in the bottom panel of the chart above that the correlation coefficient between EUR/NOK and Crude Oil is -0.88. Readings below -0.80 are considered strong and prices of the assts tend to move in opposite directions. If this correlation holds, watch the direction of Crude Oil for an indication of where EUR/NOK may be headed next.
Despite the NorgesBank saying that it will hike rates 25bps in March, the ECB has pre-committed to increasing rates by 50bps and says that there is more to come. As a result, EUR/NOK is marching higher. However, the RSI is overbought on the daily timeframe, indicating a possible pullback. Given that the correlation between WTI Crude Oil and EUR/NOK is at a negative extreme, watch Crude Oil for a possible indication of which way the currency pair may move next.
Learn more about forex trading opportunities.
Related tags:
Latest market news




Open an account in minutes
Experience award-winning platforms with fast and secure execution, and enjoy tight spreads from 0.5 pts on FX and 0.3 pts on indices.
Economic calendar
Web Trader platform
Our sophisticated web-based platform is packed with features.
Related articles
WTI crude squeezed between Hormuz risk and diesel ban speculation
WTI is being pulled in opposite directions as Hormuz risk collides with growing political pressure over US diesel prices.
US Dollar Bulls Return as Euro and Pound Shorts Build | COT Report
US dollar net-longs surged at their fastest pace in seven years as futures traders added bearish exposure to the euro and British pound.

Gold Outlook: XAU/USD hit hard as US yields, dollar resume ascent
A stronger dollar, surging front-end yields and renewed geopolitical tension have combined to push gold back towards key technical support.
This report is intended for general circulation only. It should not be construed as a recommendation, or an offer (or solicitation of an offer) to buy or sell any financial products. The information provided does not take into account your specific investment objectives, financial situation or particular needs. Before you act on any recommendation that may be contained in this report, independent advice ought to be sought from a financial adviser regarding the suitability of the investment product, taking into account your specific investment objectives, financial situation or particular needs.
StoneX Financial Pte. Ltd., may distribute reports produced by its respective foreign entities or affiliates within the StoneX group of companies or third parties pursuant to an arrangement under Regulation 32C of the Financial Advisers Regulations. Where the report is distributed to a person in Singapore who is not an accredited investor, expert investor or an institutional investor (as defined in the Securities Futures Act), StoneX Financial Pte. Ltd. accepts legal responsibility to such persons for the contents of the report only to the extent required by law. Singapore recipients should contact StoneX Financial Pte. Ltd. at 6826 9988 for matters arising from, or in connection with the report.
In the case of all other recipients of this report, to the extent permitted by applicable laws and regulations neither StoneX Financial Pte. Ltd. nor its associated companies will be responsible or liable for any loss or damage incurred arising out of, or in connection with, any use of the information contained in this report and all such liability is hereby expressly disclaimed. No representation or warranty is made, express or implied, that the content of this report is complete or accurate.
StoneX Financial Pte. Ltd. is not under any obligation to update this report.
Trading CFDs carries a high level of risk that may not be suitable for some investors. Consider your investment objectives, level of experience, financial resources, risk appetite and other relevant circumstances carefully. The possibility exists that you could lose some or all of your investments, including your initial deposits. If in doubt, please seek independent expert advice. Visit www.forex.com/en-sg/terms-and-policies for the complete Risk Disclosure Statement.