



Euro Along for the Ride as EUR/USD Trips from Resistance to Support
The Euro is a whopping 57.6% of the DXY basket so it’s rare that there’s another factor that could be more important than US or European fundamentals to the pair, but we may be in one of those backdrops right now.
Share this:


When the US Dollar broke down two weeks ago, there were significant breakouts in EUR/USD and GBP/USD despite the fact that there really wasn’t any great drivers for either Europe or the UK. Instead, it seemed to be a move rooted more from the USD/JPY major pair and the fact that USD/JPY is still about 50% above early 2021 levels. This rally was driven by the carry trade and the rate differentials between the two economies, and this can and has led to a crowded long position as the monetary policy of both the US and Japan have and continue to encourage bulls while discouraging bears.
Even at this stage, the rollover on the long side of the pair is positive while the roll on the short side of the pair is negative – so shorts have to pay roll to hold overnight positions while longs can earn roll.
The carry trade is a significant fundamental driver in the spot FX market and this is one of the reasons why USD/JPY came to life with such vigor back in 2022, as investors could get loans at cheap rates in Japan and then invest in higher rates elsewhere, like the US. The problem with that relationship is the loans in Japan were in Yen, and if JPY was losing value, well any spread that was earned could easily get wiped out. So, investors would often look to hedge their currency risk by selling JPY and buying another currency like the USD.
USD/JPY (in blue) Pulling up the USD Basket (in black) Since Last April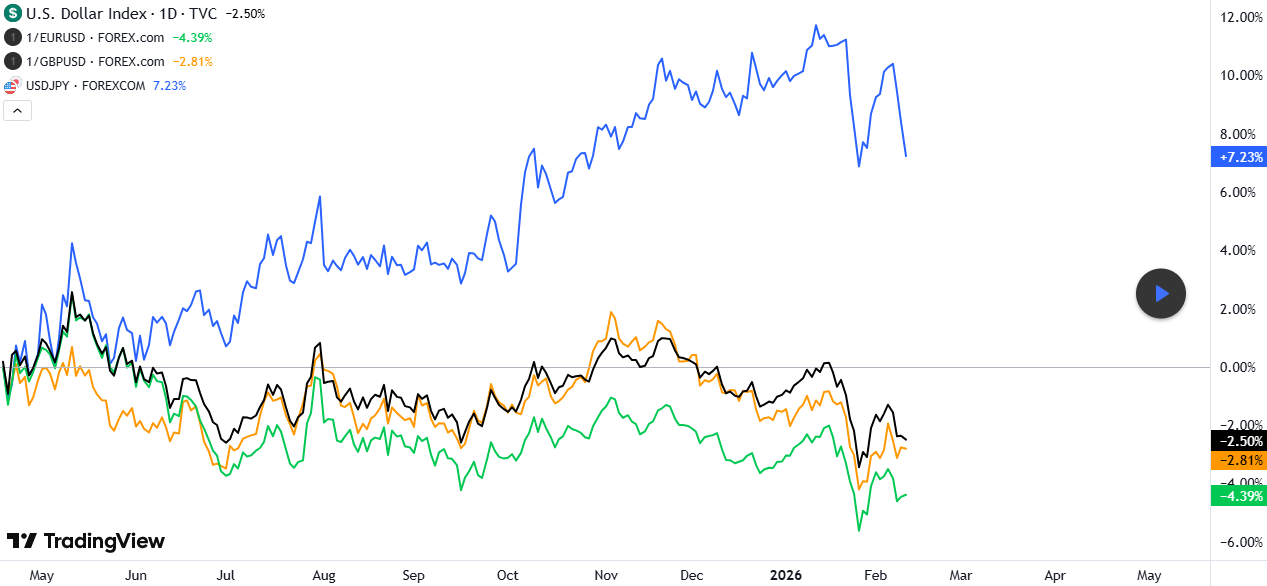
Chart prepared by James Stanley; data derived from Tradingview
The problem is that once a market gets so incredibly one-sided even a hint or whiff of change can compel a violent reaction, similar to what showed in Q4 of 2022 and then to a lesser degree in Q4 of 2023. There was another episode in 2024 around a July 11th CPI release, which was also accented by a Bank of Japan intervention. It didn’t take long for the pain to spread but as the hedges from that carry trade unwound, so too did some of the leverage that was pushed by that cheap capital in Japan. The Nasdaq sold off and the S&P 500 topped about a week after the CPI release. By early August, we had the third-highest ever VIX reading, rivaled only by the Financial Collapse and the onset of Covid.
But cooler heads ultimately prevailed there as the Bank of Japan backed away from hawkish talk and rate hike rhetoric; and when the USD reversed in Q4 of 2024 there were headlines proclaiming the return of the carry trade, even as the US central bank was continuing to cut rates.
We had another bearish event in USD/JPY shortly after last year’s open and that too accented a sell-off in stocks, although the headlines were so murky at the time that drawing a connection between the two amidst all the tariff confusion seemed a spurious prospect. Again, the 140.00 level came in as support in April and bulls started marching higher, eventually going right back to the eye of the storm around the 160.00 handle in USD/JPY.
Another sell-off showed up two weeks ago in USD/JPY and, once again, it took place as the 160.00 level started to stall the advance. Perhaps more interesting, however, is what happened in EUR/USD as the pair put in an aggressive breakout and test above the 1.2000 psychological level – highlighting the fact that the biggest driver behind EUR/USD right now might not be NFP or CPI or even European rate expectations – but, instead, capital flows and positioning from the USD/JPY long-term carry trade.
EUR/USD Daily Chart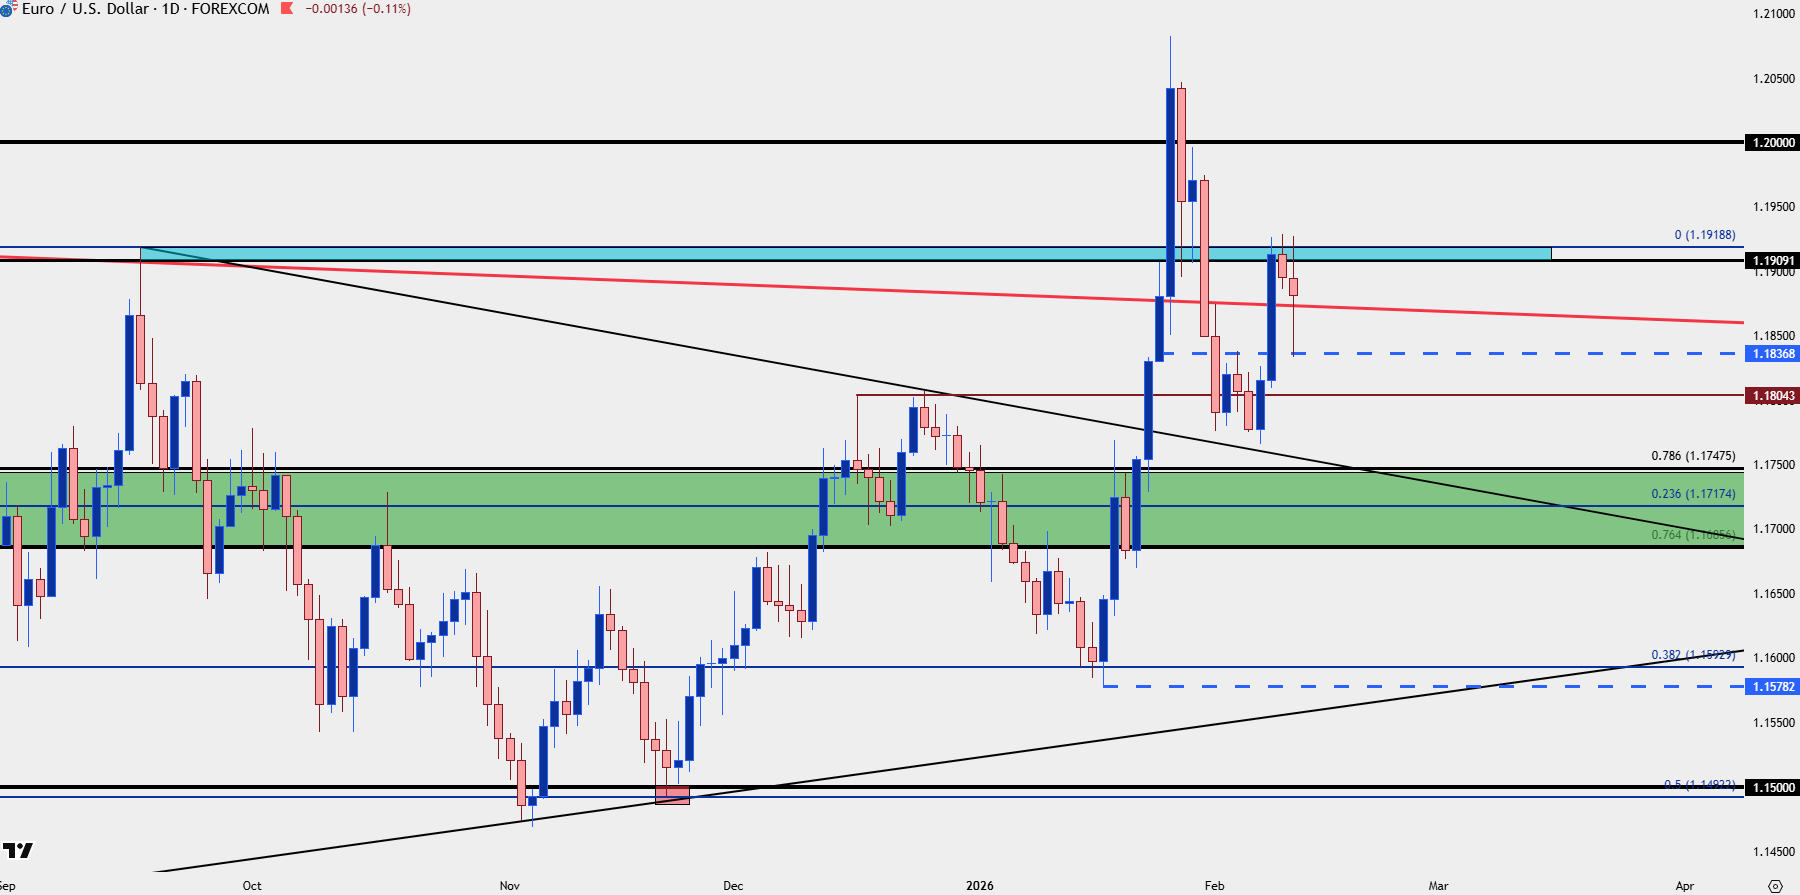
Chart prepared by James Stanley; data derived from Tradingview
This was a central theme in yesterday’s webinar as Yen-weakness has been a big factor in why the USD has held up as well as it has over the past ten months. And perhaps more to the point, if we look at prior episodes of unwind, such as what took place in March and April of last year or in Q3 of 2024, the Euro showed incredible strength despite the fact that the fundamental backdrop wasn’t really all that strong.
Instead, it seemed a derivative movement of USD-weakness, which was being heavily pushed by the 13.6% component of DXY in the Dollar basket.
On the weekly chart of EUR/USD below, I’ve highlighted these two specific periods in effort of isolating variables.
EUR/USD Weekly Chart
Chart prepared by James Stanley; data derived from Tradingview
EUR/USD Price Dynamics Still Do Matter
Price levels still carry importance in EUR/USD but it’s perhaps not as important as it would be without the larger factor in the backdrop of a possible unwinding carry trade.
And we have another good example of that today, as a relatively strong NFP report and lower odds of near-term rate cuts have been met with USD weakness and, in-turn, EUR/USD strength. But if we look at the reaction in USD/JPY some of the missing pieces become apparent, as sellers hit resistance in the USD/JPY pair in an aggressive fashion shortly after the Non-farm Payrolls release.
As I looked at in yesterday’s webinar, this keeps open the possibility of bullish continuation in EUR/USD, and price put in a clean test of support looked at then around the 1.1837 level, followed by a strong rally to test resistance at prior support.
EUR/USD Hourly Chart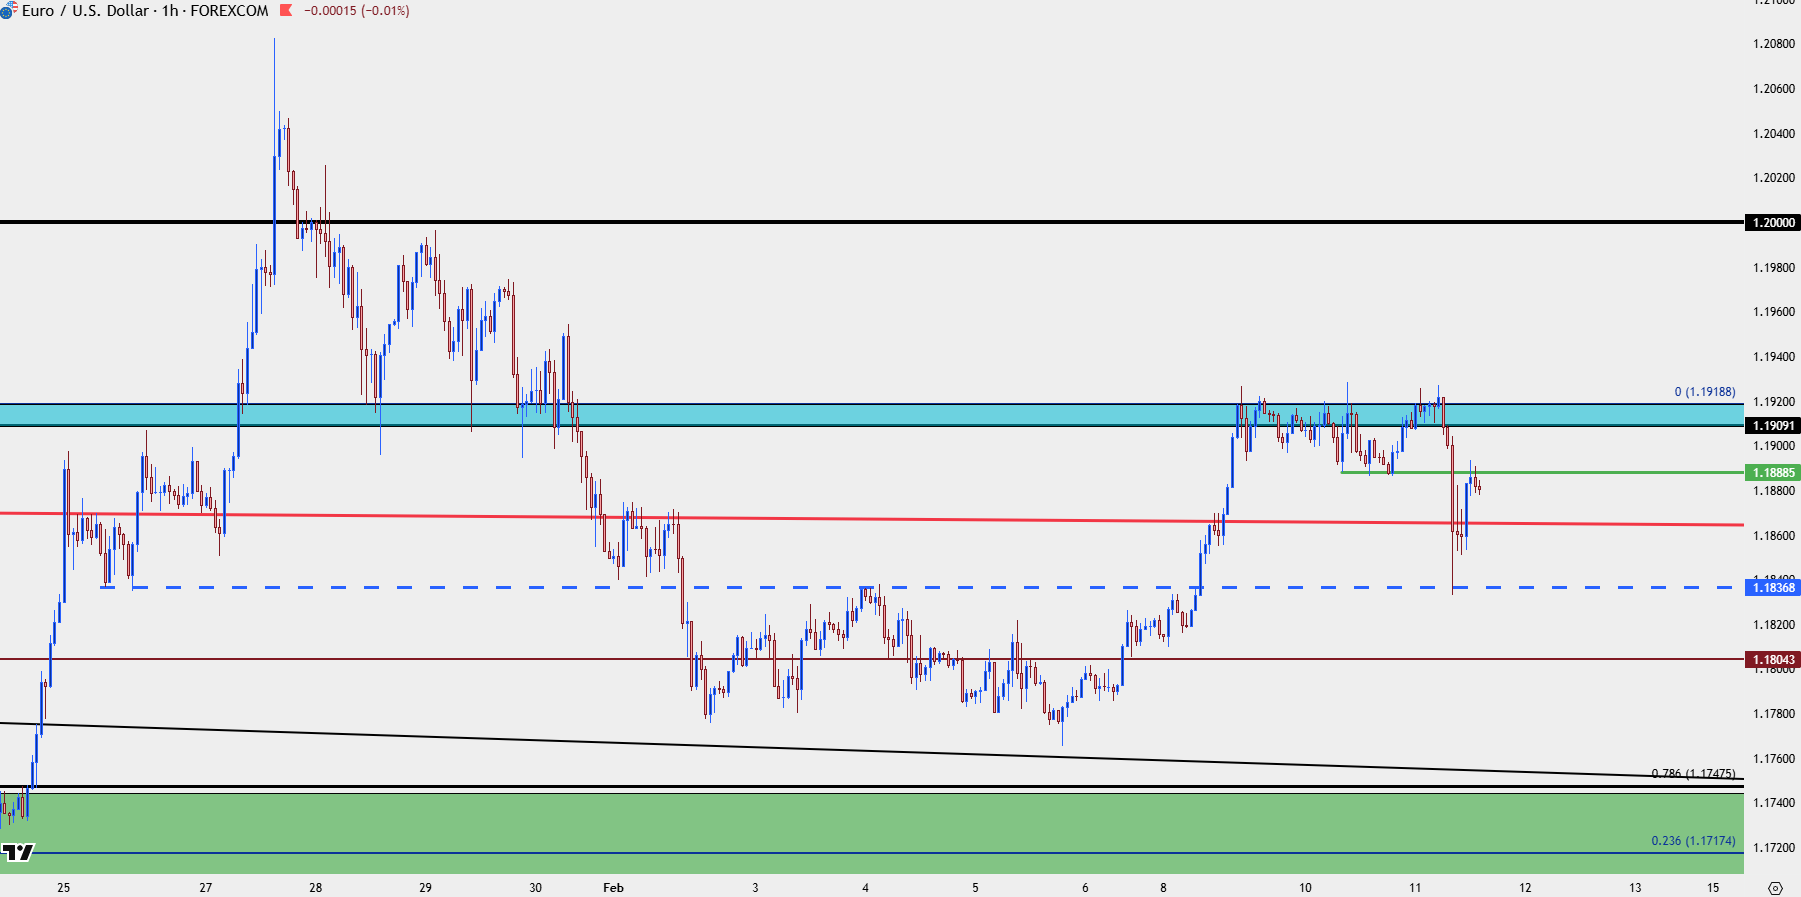
Chart prepared by James Stanley; data derived from Tradingview
--- written by James Stanley, Senior Market Analyst, Global Macro
Related tags:



Open an account in minutes
Experience award-winning platforms with fast and secure execution, and enjoy tight spreads from 0.5 pts on FX and 0.3 pts on indices.
Economic calendar
Web Trader platform
Our sophisticated web-based platform is packed with features.
Related articles

Gold Price Outlook: XAU/USD Resistance at $4200 Sets Up for NFP
It was a strong sell-off to start the week in gold and despite a Tuesday bounce, sellers are continuing to push following a resistance hit at the $4200 level.

EUR/USD Forecast: Euro Struggles to Find Support Even After U.S. PCE Data
The euro continues to face a challenging environment in the short term. The currency has struggled to regain ground against a U.S. dollar that remains firmly supported, a dynamic reflected in EUR/USD, which has now recorded three consecutive losing sessions and a decline of roughly 0.6%.


Nasdaq Breakout Potential into Q4 for Melt Up Scenarios
The headlines seem negative in almost any place that you look, with surging Treasury yields and frothy AI valuations getting more and more attention. But, if it’s so bad, why hasn’t the Nasdaq melted down yet, even as the Fed has started hiking rates?
This report is intended for general circulation only. It should not be construed as a recommendation, or an offer (or solicitation of an offer) to buy or sell any financial products. The information provided does not take into account your specific investment objectives, financial situation or particular needs. Before you act on any recommendation that may be contained in this report, independent advice ought to be sought from a financial adviser regarding the suitability of the investment product, taking into account your specific investment objectives, financial situation or particular needs.
StoneX Financial Pte. Ltd., may distribute reports produced by its respective foreign entities or affiliates within the StoneX group of companies or third parties pursuant to an arrangement under Regulation 32C of the Financial Advisers Regulations. Where the report is distributed to a person in Singapore who is not an accredited investor, expert investor or an institutional investor (as defined in the Securities Futures Act), StoneX Financial Pte. Ltd. accepts legal responsibility to such persons for the contents of the report only to the extent required by law. Singapore recipients should contact StoneX Financial Pte. Ltd. at 6826 9988 for matters arising from, or in connection with the report.
In the case of all other recipients of this report, to the extent permitted by applicable laws and regulations neither StoneX Financial Pte. Ltd. nor its associated companies will be responsible or liable for any loss or damage incurred arising out of, or in connection with, any use of the information contained in this report and all such liability is hereby expressly disclaimed. No representation or warranty is made, express or implied, that the content of this report is complete or accurate.
StoneX Financial Pte. Ltd. is not under any obligation to update this report.
Trading CFDs carries a high level of risk that may not be suitable for some investors. Consider your investment objectives, level of experience, financial resources, risk appetite and other relevant circumstances carefully. The possibility exists that you could lose some or all of your investments, including your initial deposits. If in doubt, please seek independent expert advice. Visit www.forex.com/en-sg/terms-and-policies for the complete Risk Disclosure Statement.