
As looked at last Friday there was a circulating worry around the Greenback as the initial stages of a carry unwind scenario had developed. It was widely spread that it was intervention but as I pointed out in that article, it was far too early to tell, and if we were looking at the move from a granular basis, it looked to be organic given the massive positioning imbalance that’s built over the past five years.
The benefit of a prolonged trend is the long-term bias; but the downside is that when we do get a hint or whiff of change the reversion towards the mean can be fast and violent, and that’s what explains last Friday’s price action in USD/JPY. Fears of carry unwind driven by both a prospect of intervention and narrowing rate differentials was enough to cause bulls to jump ship, leading to a sharp move lower. And that sell-off continued into the new weekly open.
I looked at this on Monday and as I said then, we’d find out more about what’s behind the move upon a test of the 154.45-155.00 zone; and we did, as sellers attacked. And those sellers were likely both longs cutting positions and shorts opportunistically looking to take advantage of a possible reversal, with continuation showing in the immediate aftermath of that test, all the way until price stalled just above the massive spot of importance at 151.95.
Along the way were a couple of important drivers and I think this plays into what could shape the next theme in both USD/JPY and DXY, and on Tuesday President Trump remarked on the USD weakness, saying it was ‘great.’ This should come as no surprise as he’s largely been cheering for a weaker USD ever since his inauguration a year ago.
But on Wednesday, something else happened when US Treasury Secretary Scott Bessent said that the US did not intervene in the Yen, which sent the pair rallying ahead of the FOMC meeting. And that seems to be the push point that’s allowed both markets to recover from oversold conditions that had flashed earlier in the week.
USD/JPY, at this point, is right back to the 154.45-155.00 zone that had held the highs earlier in the week, and if buyers can force a break above the psychological level overhead, the door opens for a larger rally as the rate differential remains tilted to the long side of the US Dollar.
USD/JPY Four-Hour price Chart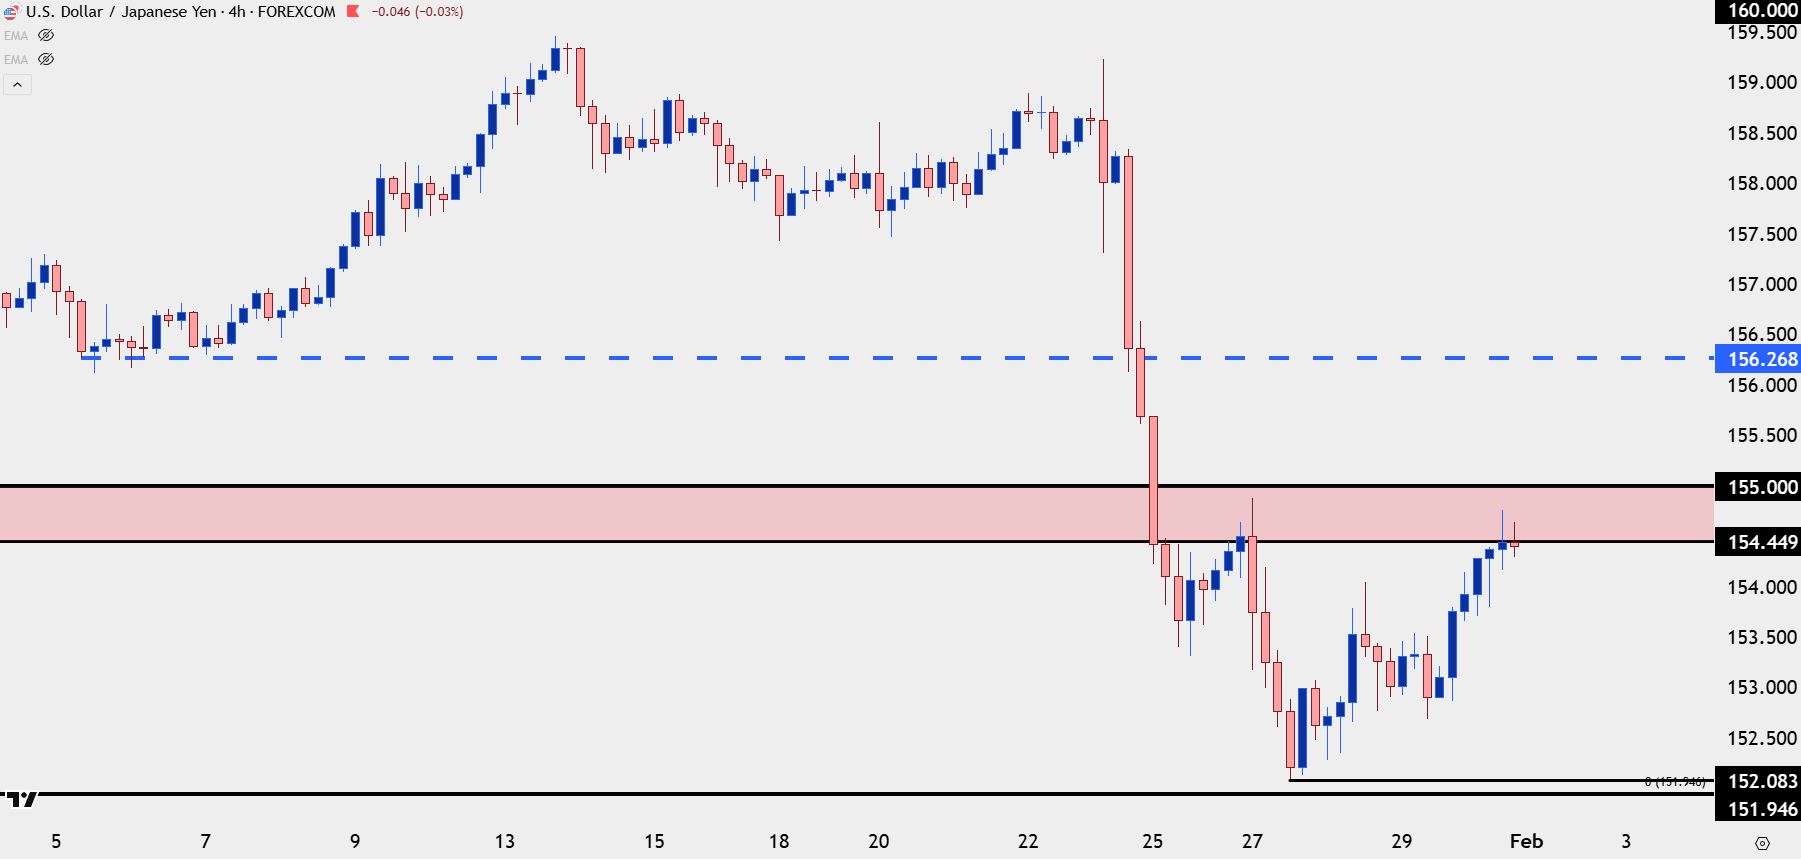
Chart prepared by James Stanley; data derived from Tradingview

US Dollar Dynamics
Also of interest behind the USD were some comments from Kevin Hassett, the Director of the National Economic Council and previously someone thought to be headed to the Fed Chair nomination. Hassett is notable as he often pushes Trump talking points in media engagements and it’s that very loyalty that played into expectation for him to take over for Jerome Powell.
On Friday, Hassett said that there were multiple benefits to USD strength, which seems at odds with Trumps comments earlier in the week that were seemingly cheering on USD-weakness. Hassett doesn’t seem to be someone that would cross Trump, nor someone that would refute his boss in public, so the fact that he said this in widely-broadcast media seems as though it was a bit of a walk back from the admin.
Why would something like this happen? Well, if we did see continued unwind of the Yen carry trade, the repercussions could be massive in markets like US equities. And that could create a difficult backdrop for Trump and the GOP heading into mid-term elections.
Given how important currencies are to not only the global economy but to each individual component of that, stability is often the desired path forward as extreme volatility can drive extreme, and perhaps even unpredictable volatility elsewhere.
Also playing into the USD’s late week recovery was a strong PPI print and the likelihood of the ECB trying to talk the Euro down at next week’s rate decision. At this point, the weekly bar for USD is looking very indecisive.
US Dollar Weekly Chart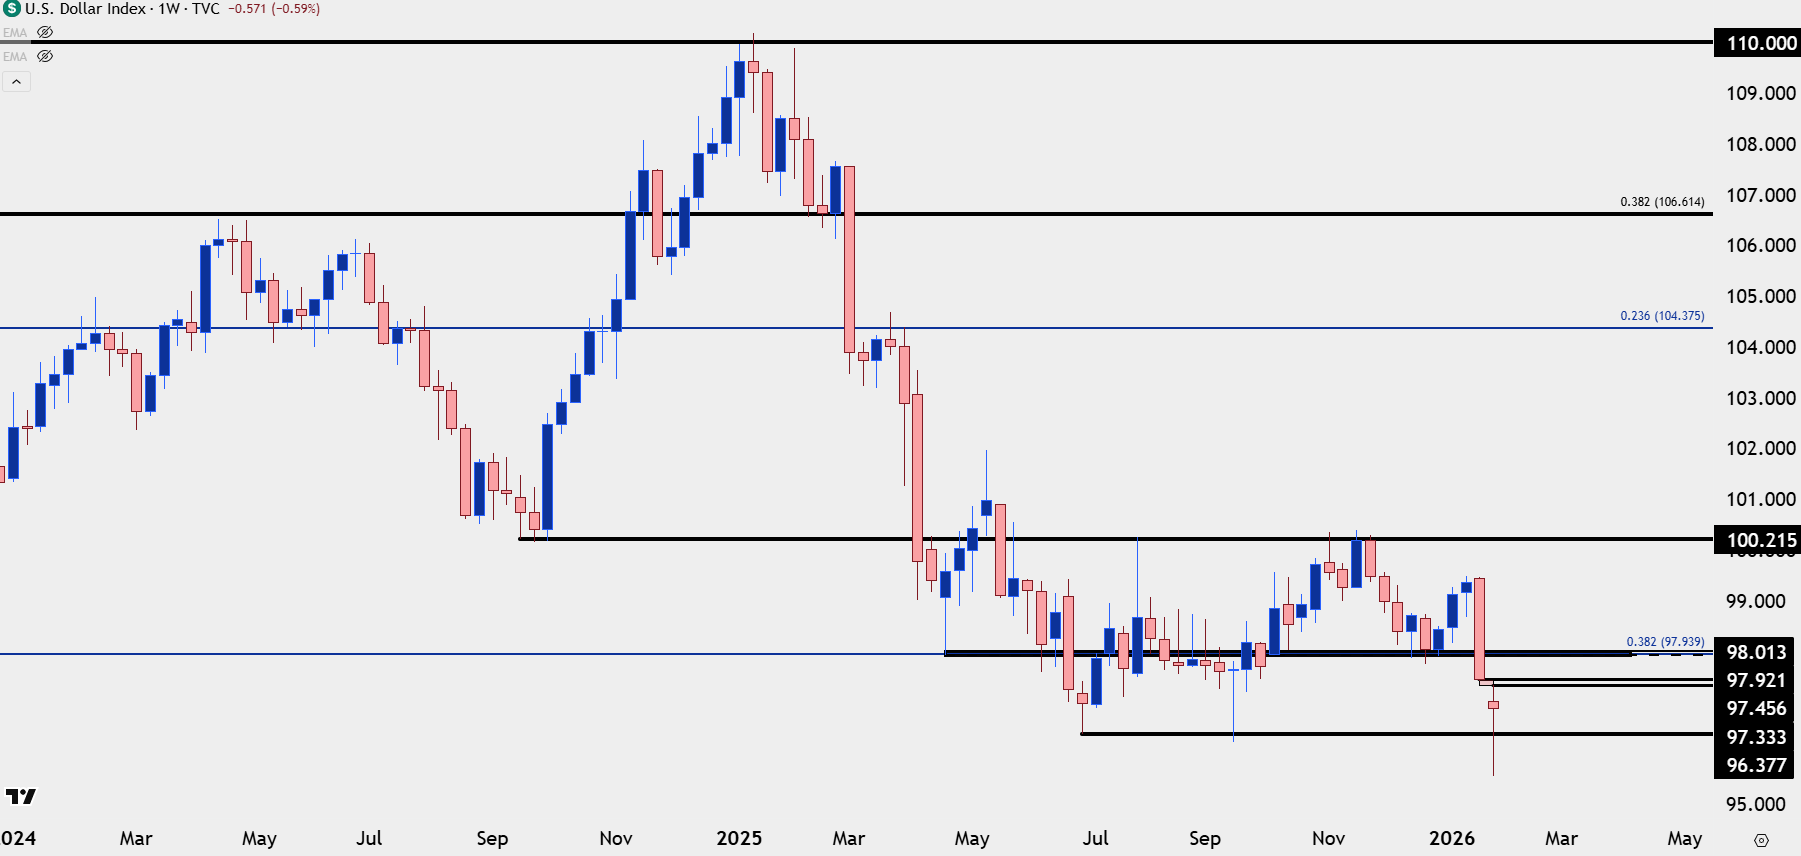
Chart prepared by James Stanley; data derived from Tradingview
US Dollar Daily
As I had looked at in the webinar on Tuesday the US Dollar had moved into oversold territory on the daily chart and this made the prospect of chasing as a bit more daunting. That condition has since rectified so now we’ll get to see whether USD bears are interested in continuing that move and given the NFP report on the docket for next week there’s subject matter that can push towards that end.
For resistance, there’s unfilled gap from 97.33-97.46 and above that is a zone of prior support around the 98 handle. If bulls force a recovery move beyond both of those zones, it’s going to look as though the breakdown was a failure and the door would open for a broader bullish move.
US Dollar Daily Chart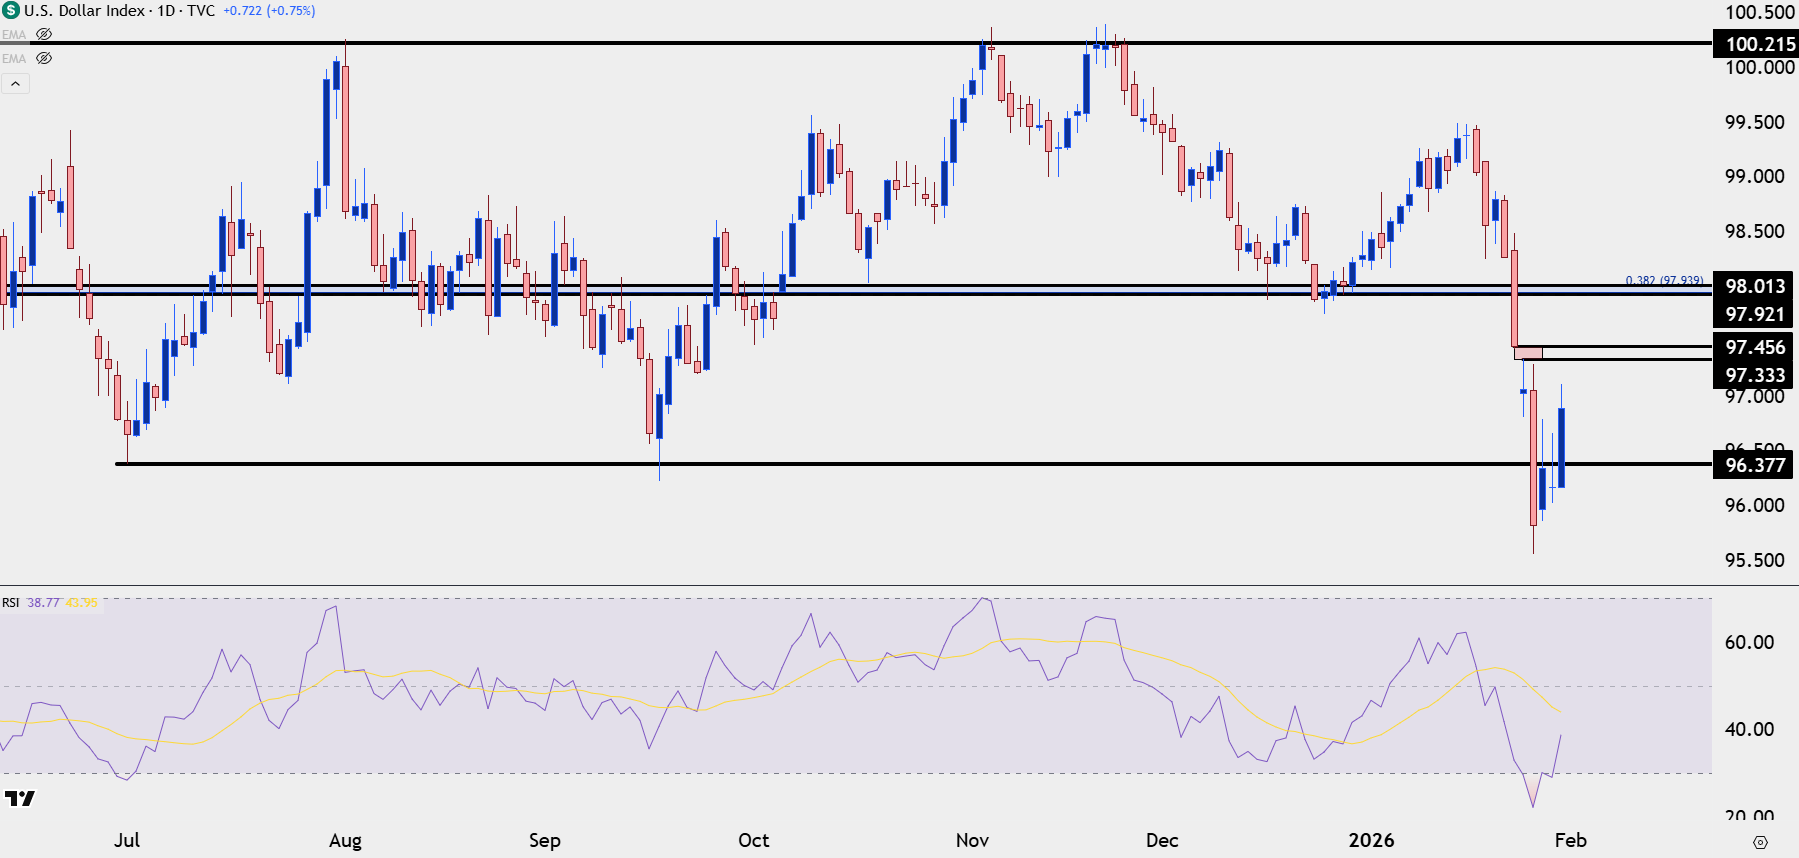
Chart prepared by James Stanley; data derived from Tradingview

EUR/USD
The Euro put in a significant breakout earlier in the week and tested above a couple of key areas, with both a trendline and the 1.2000 psychological level coming into play. As we saw the pullback in trend in USD in the back-half of the week, so too did EUR/USD and this sets the stage for next week’s ECB meeting.
EUR/USD Monthly Price Chart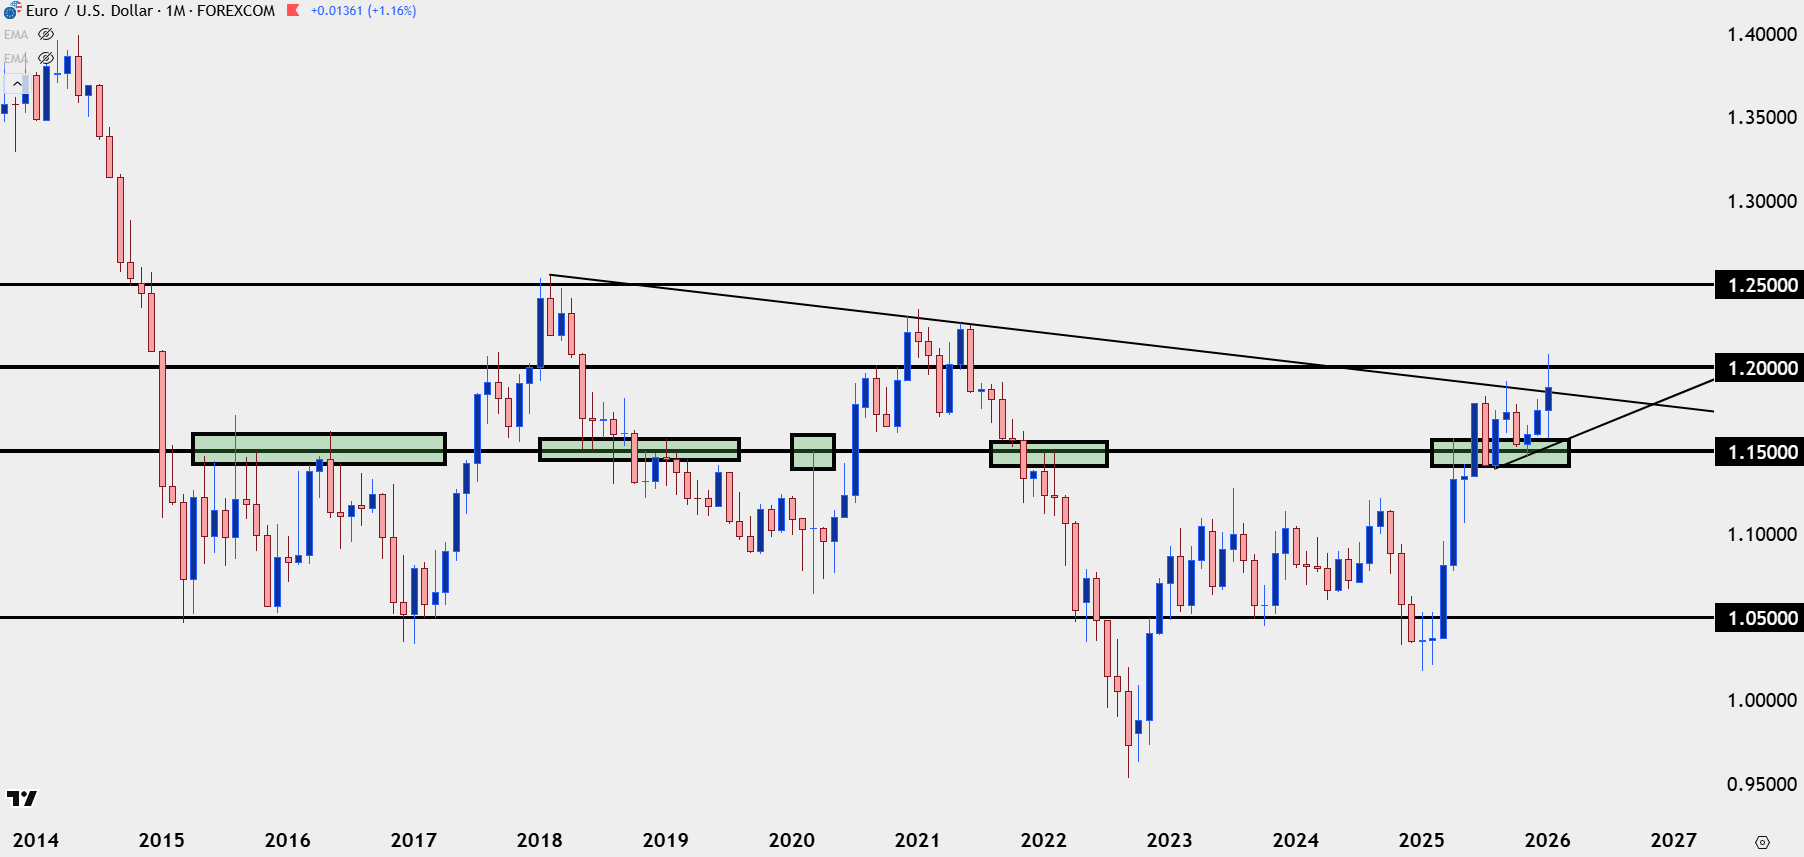
Chart prepared by James Stanley; data derived from Tradingview
EUR/USD Shorter-Term
While Trump has been clear in his push for a weaker US Dollar, few economies are likely welcoming significant strength as there’s probably no party willing and hoping to see pressure on exports.
With EUR/USD gaining massively last year this puts the ECB in a precarious spot, and if the Euro did appreciate even more against the Dollar there could fast be ramifications via slower inflation, lower growth and, eventually, the need to cut rates.
This is, again, why stability in currencies is often a desired trait – so that fiscal policy can do its job without significant disruption. But the test for next week as we go into the ECB meeting is to see whether buyers jump in to support the pullback.
Earlier in the week, there was a clean response to the 1.1909 level, but as soon as we got close to 1.2000 again sellers slammed it. Now, we’re seeing a bit of support on a longer-term trendline projection, and below is another spot of interest around the 1.1800 handle that was resistance in late-2025 trade. And then longer-term, I still think there’s value in the Fibonacci sequence that I wrote about a year ago, which effectively helped to identify both the low in January/February and the resistance grind in the second-half of the year, with levels at 1.1686 and 1.1748.
EUR/USD Daily Chart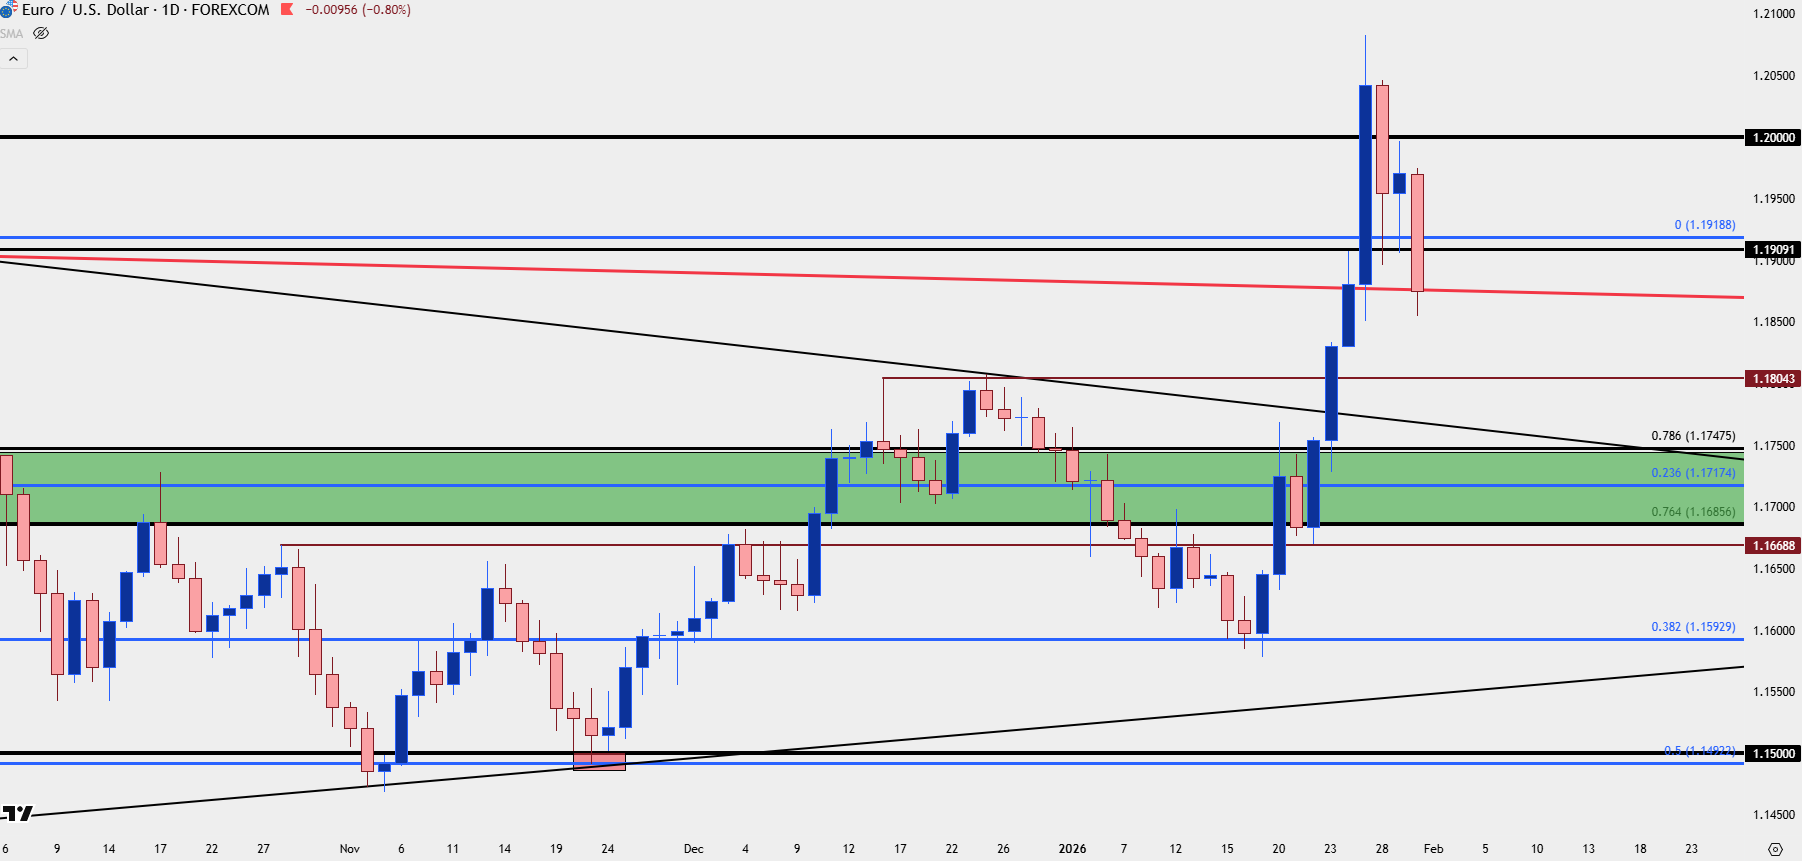
Chart prepared by James Stanley; data derived from Tradingview
GBP/USD
Cable is still my preference for USD-weakness scenarios and as we approach the weekend the pair is at a key support zone from 1.3643-1.3683. I’m tracking an ‘s2’ zone at prior resistance, from around 1.3544-1.3568 and it’s the 1.3460 and 1.3500 level’s that I’m considering for invalidation.
If we see the pair push below either of those prices then I think we’ll be seeing some pretty extreme USD-strength and I’d expect that to derive from something like a very strong NFP report, or something along those lines.
GBP/USD Daily Price Chart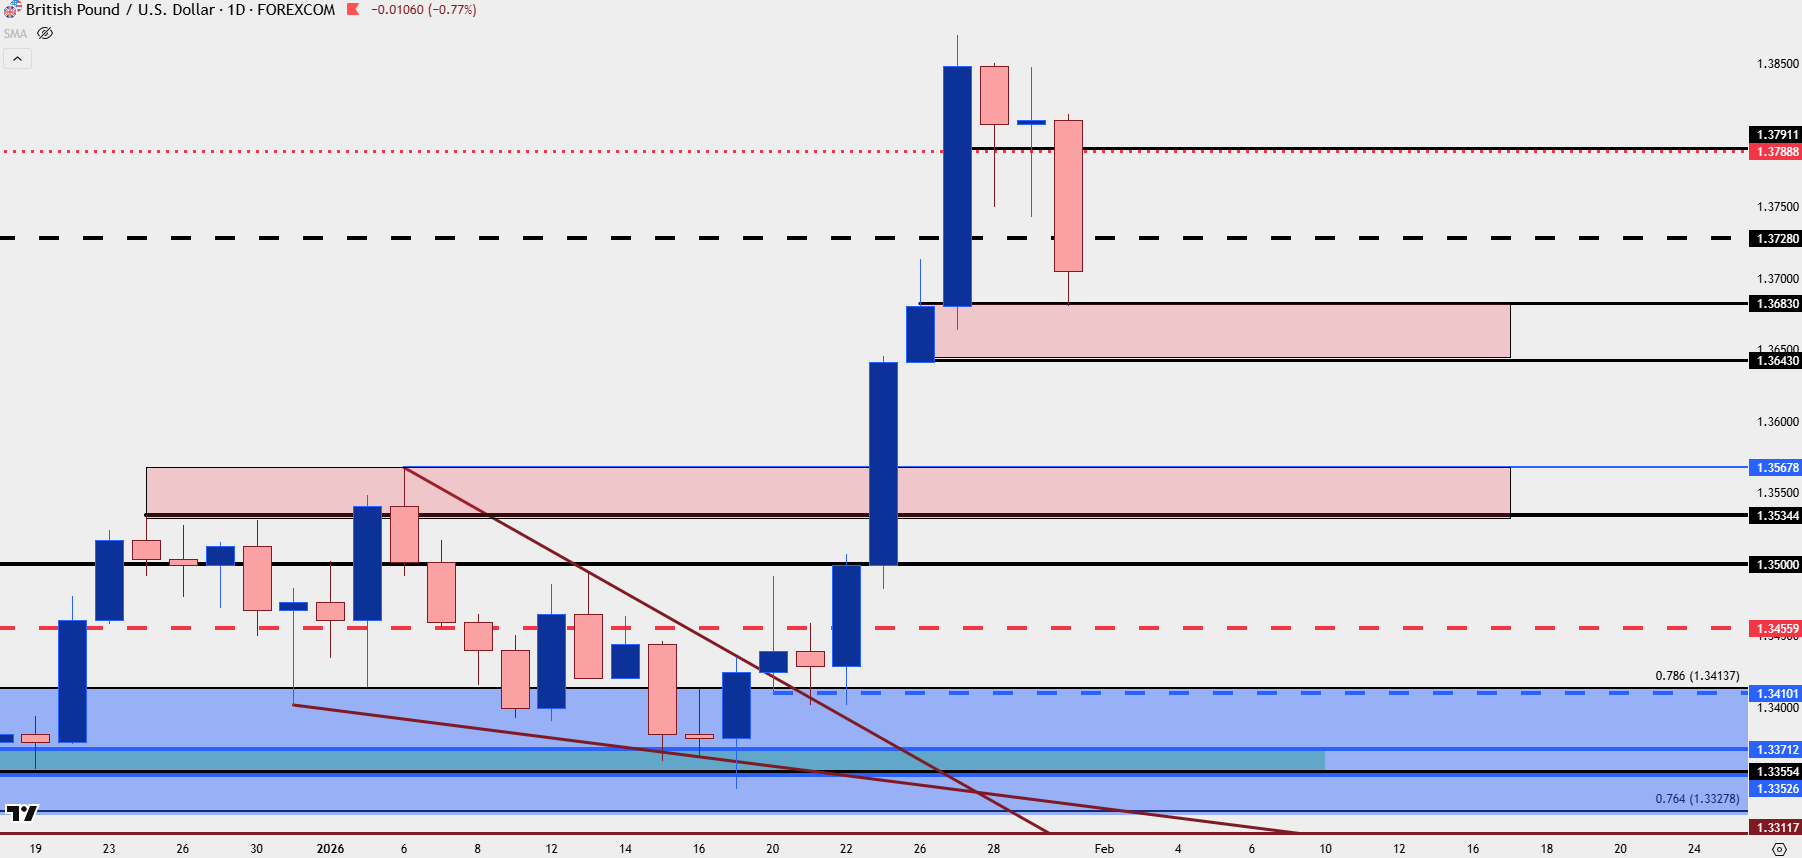
Chart prepared by James Stanley; data derived from Tradingview
--- written by James Stanley, Senior Market Analyst, Global Macro