It was a cascading sell-off in USD/JPY to end last week and that’s led to an extension in the move so far this week. It didn’t take long for the accusation of intervention to take over on social media and it seems many have assumed this as an almost foregone conclusion, although I would like to point out a reasonable doubt. And, perhaps more importantly, I’d like to put the argument in the proper place as spending any time debating whether or not it was intervention-fueled without the ability for any nearby proof one way or the other can obfuscate from what matters most, and that’s trying to get on the right side of the next move.
To open this week Japanese PM Sanae Takaichi said that she won’t comment on specific market moves, which isn’t out of tune for Japanese policymakers around such events. It’s not often until we get a look at BoJ money market data that we can legitimately deduce whether it was an intervention.
I had spoken on this topic a week ahead of last week’s sell-off, pointing out a conversation that seemed important between US Treasury Secretary Scott Bessent and Japanese Finance Minister Satsuki Katayama. Katayama had remarked that she spoke with Bessent and they both had a vested interest against ‘one-sided’ moves in the currency, and this makes sense. The US has long pushed for a weaker US Dollar, and the Japanese Yen weakness that had taken over after Takaichi’s election in October seemed problematic for Japanese inflation expectations and Japanese government bond yields.
“The intervention threat is real here and, longer-term, something from last week could take on more importance, and this was specifically Finance Minister Katayama mentioning that she had spoken with US Treasury Secretary Scott Bessent and that they both had a similar desire, widely read to mean that they both wanted to see the spot rate in USD/JPY to ease. Since then, we’ve seen a couple of different support hits from prior resistance in USD/JPY, but each has so far led to a lower-high.”
This is important because this has a price action component that led into what happened last week, and this is further why I question whether an actual intervention took place.
But, also speaking to that is the way that the USD/JPY pair traded around the BoJ meeting and into last week’s close.
There was an initial shock of weakness in the pair when the BoJ opened the door to more rate hikes, but the pair then went on to recover a bit. And it was around the US open, after the Core PCE data had been released that the pair started to get hit really hard, and the selling intensified into the close and kept through the next weekly open.
USD/JPY 30-Minute Chart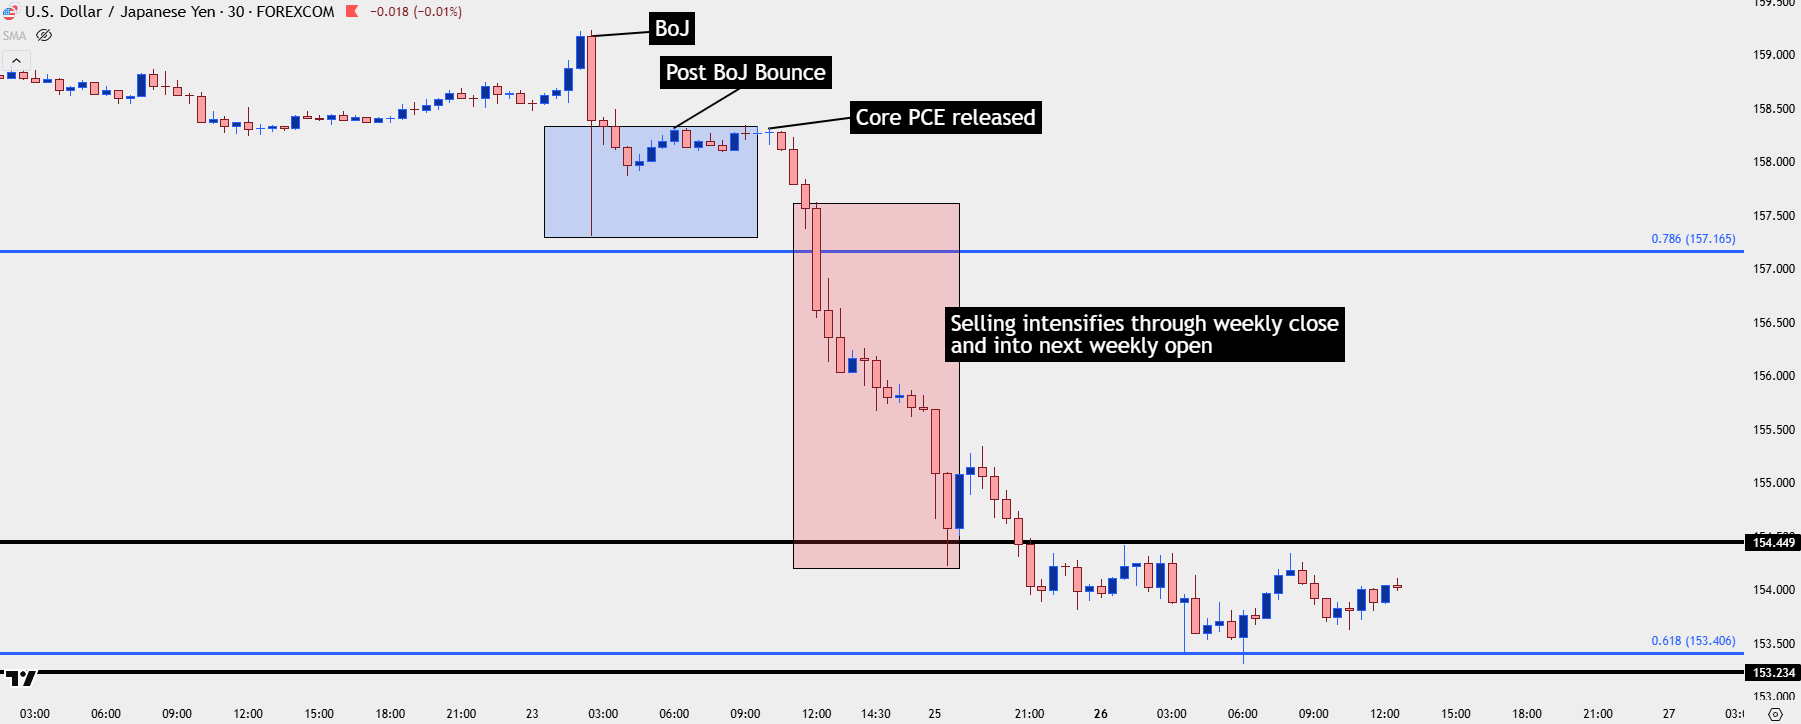
Chart prepared by James Stanley; data derived from Tradingview
USD/JPY What Matters Now
At this point whether the initial spark or even the hastening of the move was driven by intervention is less important than what happens from here – and that’s whether longer-term longs use bounces to wiggle out of long positions. This is what could drive an even deeper sell-off in the pair and create more of a carry unwind type of scenario.
Positioning remains the most important aspect of price movements because even the most bullish news will fail to drive prices if buyers aren’t hitting the bid and creating more demand. And if we do end up in a situation where the market is heavily long – even with representative fundamental environment backing such a move, we can see the other side of that trend show up quickly.
This is what explains the sell-offs in Q4 of 2022 and 2023, when the carry trade was in full bloom but the Ministry of Finance had ordered interventions to defend 150.00 in 2022. And then in 2023, bulls didn’t even want to dare a re-test of the prior high at 151.95. And then, in 2024, with US fundamentals remaining strong, buyers eventually mustered the strength to run a break, fueled at least in-part by stops on short positions sitting above the prior high.
That then created a run to 160.00 which was twice-defended by the BoJ with interventions. The first brought a pullback that ran for about a week but the second was far more impactful, as that drove a spiraling effect that eventually triggered a global de-leveraging event in equities.
In our most recent episode, we had a combination of factors resembling those prior episodes. Price got very close to 160.00 and whispers of intervention took over, echoed again by Takaichi to open this week. And then on Friday the prospect of a shift in fundamentals took over as a BoJ threatening more rate hikes along with a US seeing relatively mild inflation helped to trigger a sell-off that soon took on a tone of unwind.
USD/JPY Weekly Chart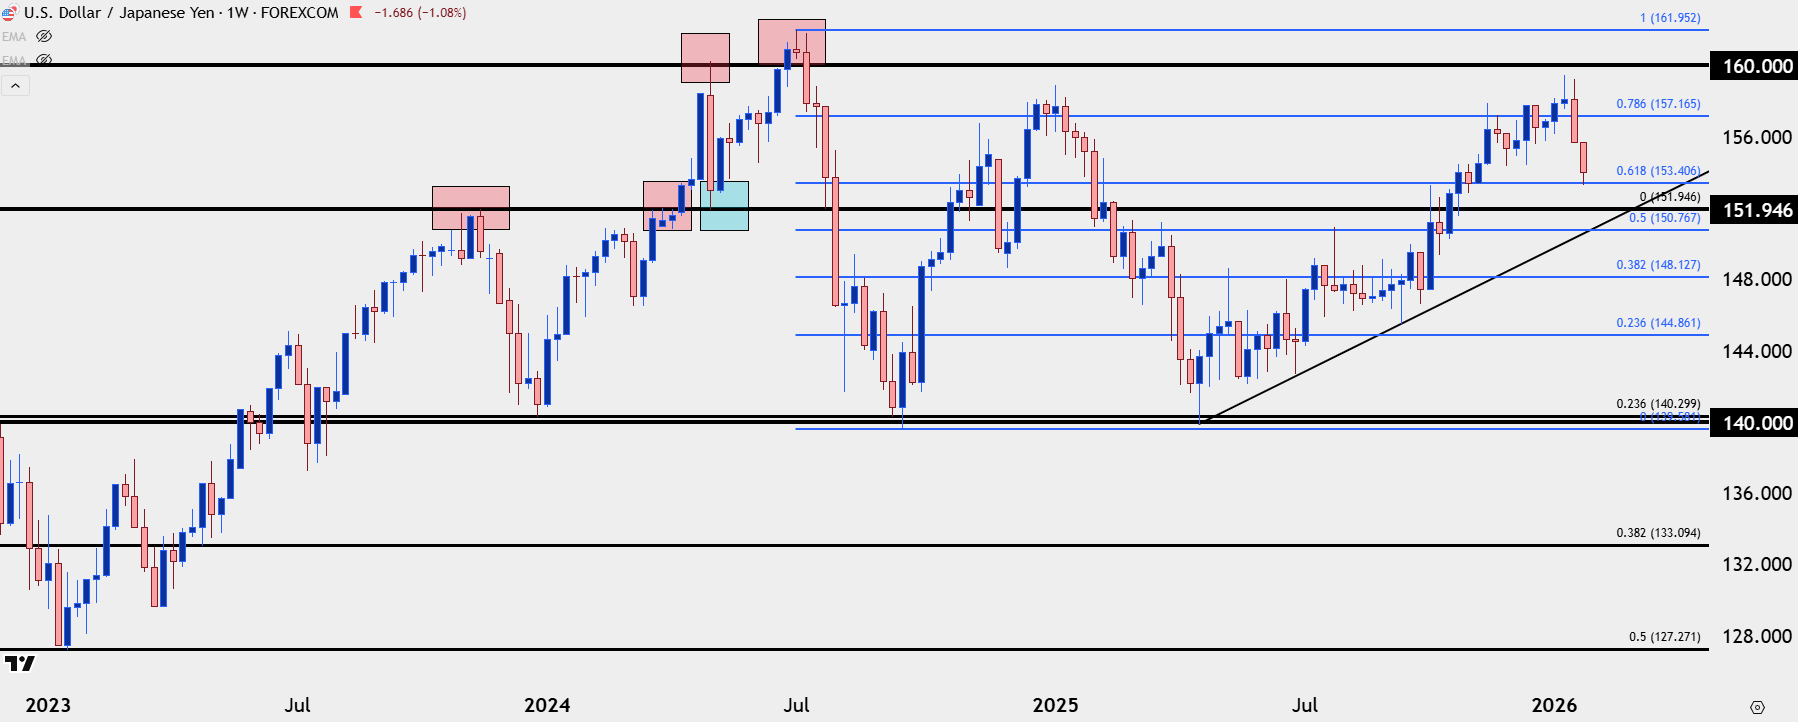
Chart prepared by James Stanley; data derived from Tradingview
USD/JPY: What Matters Now
With price getting close to a theoretical line-in-the-sand at 160.00, the risk-reward for prospective longs had shifted quite a bit from just a few months earlier. And if you were holding a long position in the pair and started to see the headlines of veiled intervention threats followed by possible BoJ rate hikes as President Trump continued to beat the drum of USD-weakness, it started to make sense to take profits on the position.
But now that there’s a pullback the big question is whether bulls use the move to load up longs again as there’s now quite a bit of distance until the 160.00 level. So far, we’ve seen price hold at a natural spot of 153.41, which is the 61.8% retracement of the 2024 sell-off which was the last carry unwind episode in USD/JPY. And sitting just overhead is another key spot of 154.45-155.00, which as resistance-turned-support back in December, around the BoJ’s prior rate hike.
This is key because if you are holding long whether it be as a hedge or a long position, and we get a bounce up to 155.00, seeing that as an attractive spot to clip the position for fear of a wider sell-off becomes a telling factor in the positioning component behind the pair. Or, alternatively, if seeing the bounce along with a short-term oversold backdrop in the USD and a flirt with oversold RSI on the daily, and then thinking it’s a good time to add or pick up long USD/JPY since we’re a ways off of the 160.00 line in the sand, that too speaks to the potential for positioning-driven flows in the pair.
USD/JPY Daily Price Chart
Chart prepared by James Stanley; data derived from Tradingview
USD/JPY Shorter-Term Strategy
At this point the four-hour chart is in deep oversold territory and while that doesn’t preclude continuation, it does highlight caution if chasing it lower. If looking to establish fresh bearish exposure a hold of resistance in the zone sitting overhead could at least offer some framework for working with the position. In that scenario, the next major level-lower is the 151.95 swing which was the high back in 2022 and 2023, then becoming support in 2024 after the initial 160.00 intervention.
But on the possible recovery side, the carry remains tilted to the long side of the pair and we’re now more than 500 pips off of last week’s high which can make for a compelling bounce scenario. If we do see bullish appetite above 155.00, there could be an opening door for broader recovery scenarios, although we would likely see some case of trepidation again from buyers when or if price re-approached the 160.00 handle.
USD/JPY Four-Hour Price Chart
Chart prepared by James Stanley; data derived from Tradingview
--- written by James Stanley, Senior Market Analyst, Global Macro