

In last week’s webinar the Dollar was continuing a recovery move that had started the week before, with a comment from Treasury Secretary Scott Bessent ahead of the FOMC rate decision. That rally in DXY ran all the way until the resistance looked at in last week’s webinar came into play, plotted at the Fibonacci level of 97.94 and that’s where the proverbial music stopped for USD bulls.
Since then, it’s been a USD/JPY-fueled sell-off as the 13.6% component of the DXY basket (the Japanese Yen) has seemed to have an incredibly large pull on the broader USD backdrop. As USD-softness showed up, EUR/USD rallied right up to a key zone of resistance which has since stalled, and even the GBP/USD reaction has opened the door a bit wider for bulls.
But for this week’s webinar the lead-off was again gold as the metal was testing the $5k level just before the session started, and to date, that remains the big item – whether bulls will continue to defend the big figure to keep the door open for topside continuation scenarios.
So far, it’s the 5100 level that bulls have not been able to leave behind and as shown in the webinar, this sets up what could become an ascending triangle formation as there’s horizontal resistance to go along with a recent series of higher-lows.
Gold Four-Hour Chart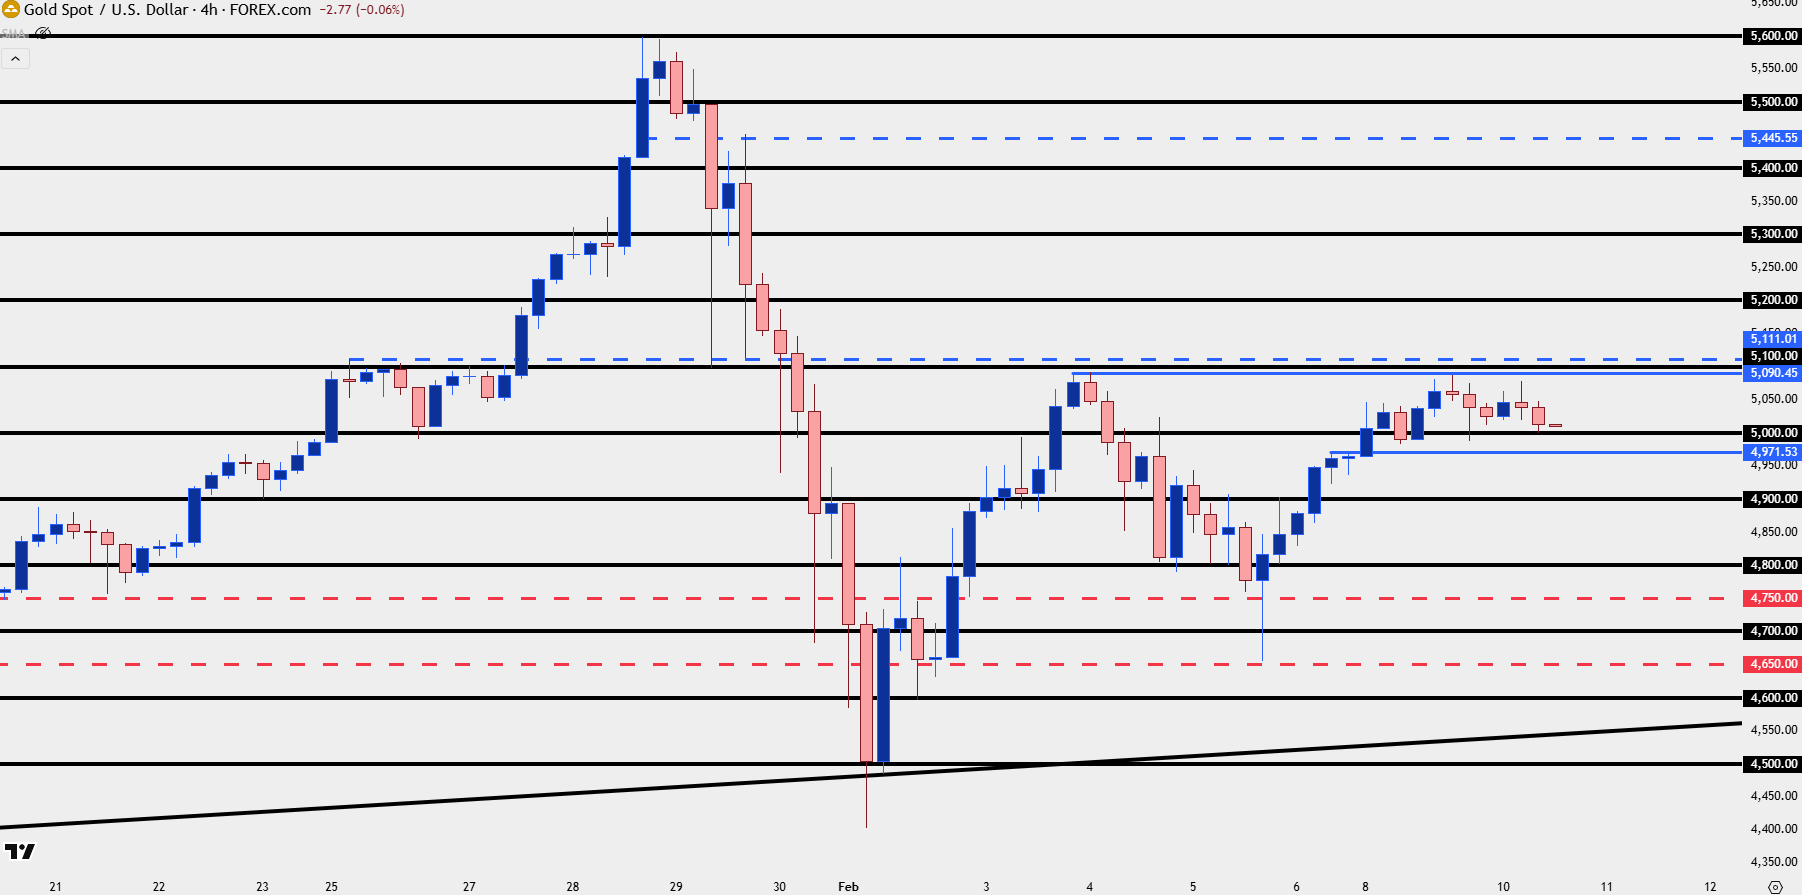
Chart prepared by James Stanley; data derived from Tradingview
The USD
The US Dollar was riding a bullish wave as of last week’s webinar and as I highlighted then a big spot of resistance potential was coming closer to being in the picture.
That finally played on Thursday – and since then – buyers have been stopped dead in their tracks.
Of interest here is just how impactful the USD/JPY pair has been to the matter, as the carry unwind episode from a couple weeks ago helped to push a significant swing low, and a deep oversold reading on the daily chart. As USD/JPY recovered last week so too did the USD, until resistance traded, at least. But now the big question is whether USD/JPY stops its descent following a surprising showing after Japanese election results over the weekend.
US Dollar Daily Chart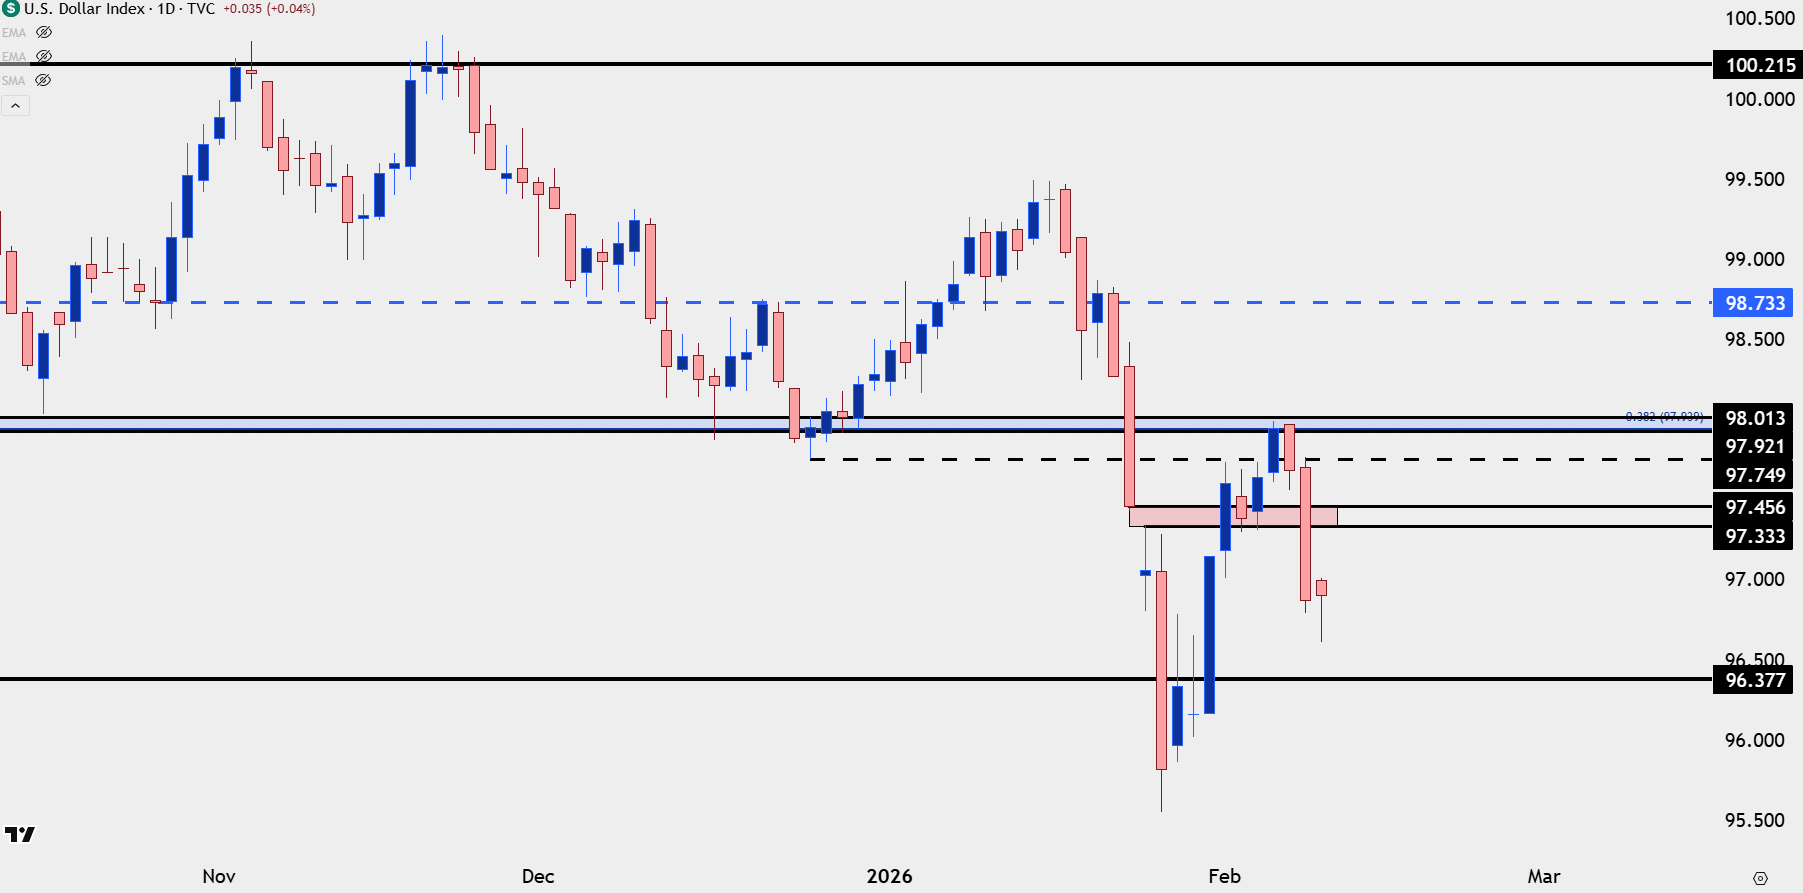
Chart prepared by James Stanley; data derived from Tradingview

USD/JPY
While President Trump has been clear in his desire for a weaker US Dollar, it’s a key ally that’s at least partially responsible for why the Dollar has held up as well as it has over the past couple of years. The below chart shows USD/JPY overlaid on DXY, and as you can see, the pair remains elevated even as the Dollar has been significantly less strong.
Considering that the Yen is a 13.6% component of the DXY basket, and the US Dollar is in the numerator of the USD/JPY quote, the difference below is quite stark. You’ll notice the USD/JPY pair in blue and the DXY basket in red.
US Dollar (in red) v/s USD/JPY (in blue)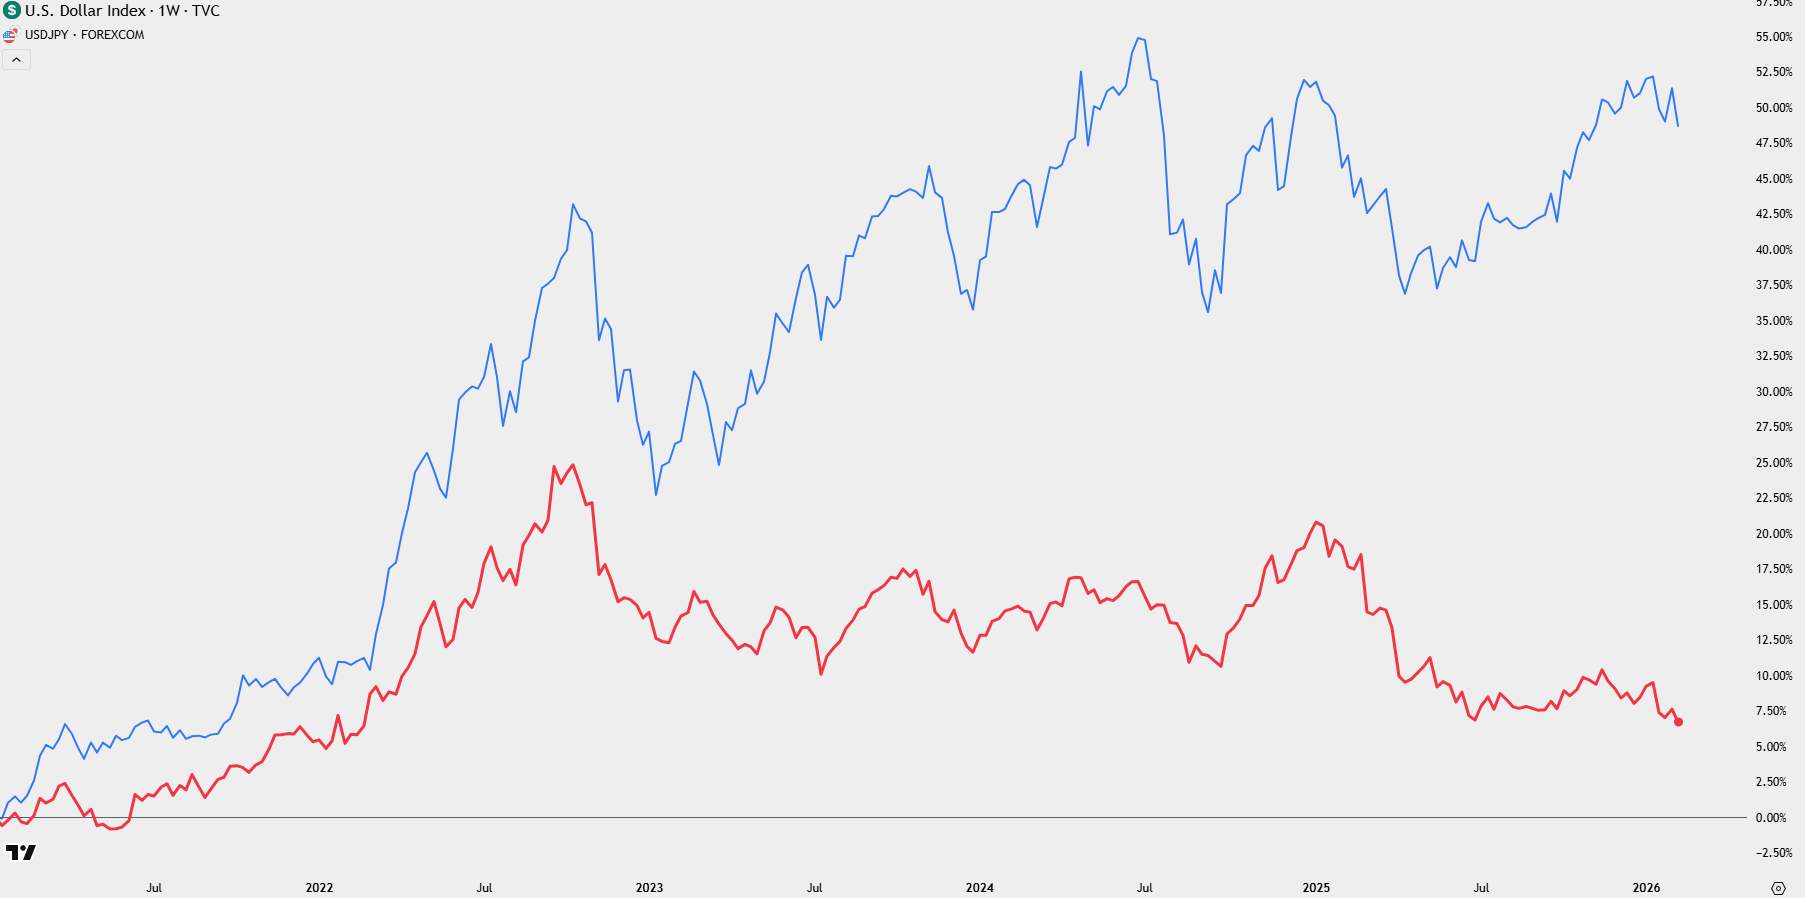
Chart prepared by James Stanley; data derived from Tradingview
USD/JPY
One of the reasons that USD/JPY is so much higher than DXY on a relative basis is a built-in long position, which is at least partly driven by hedges in the carry trade. The challenge is that if we do see a fast movement of USD-weakness that spurs more carry unwind, the leverage that was driven by that trade could also come out quickly, such as we saw in July of 2024.
Also of concern is USD/JPY near the 160.00 level, as the Finance Minister has openly talked about the prospect of intervention as that price gets close, which also keeps open the possibility of intervention after Sanae Takaichi’s decisive win in this weekend’s election.
This all makes for a more difficult case to chase the USD/JPY pair but the premise of support remains solid, as there’s still a bias to the long side of USD/JPY given carry rates.
At this point, we’re seeing a major zone tested at 154.45-155.00, and this is the same zone I was using in December as support from prior resistance.
USD/JPY Daily Price Chart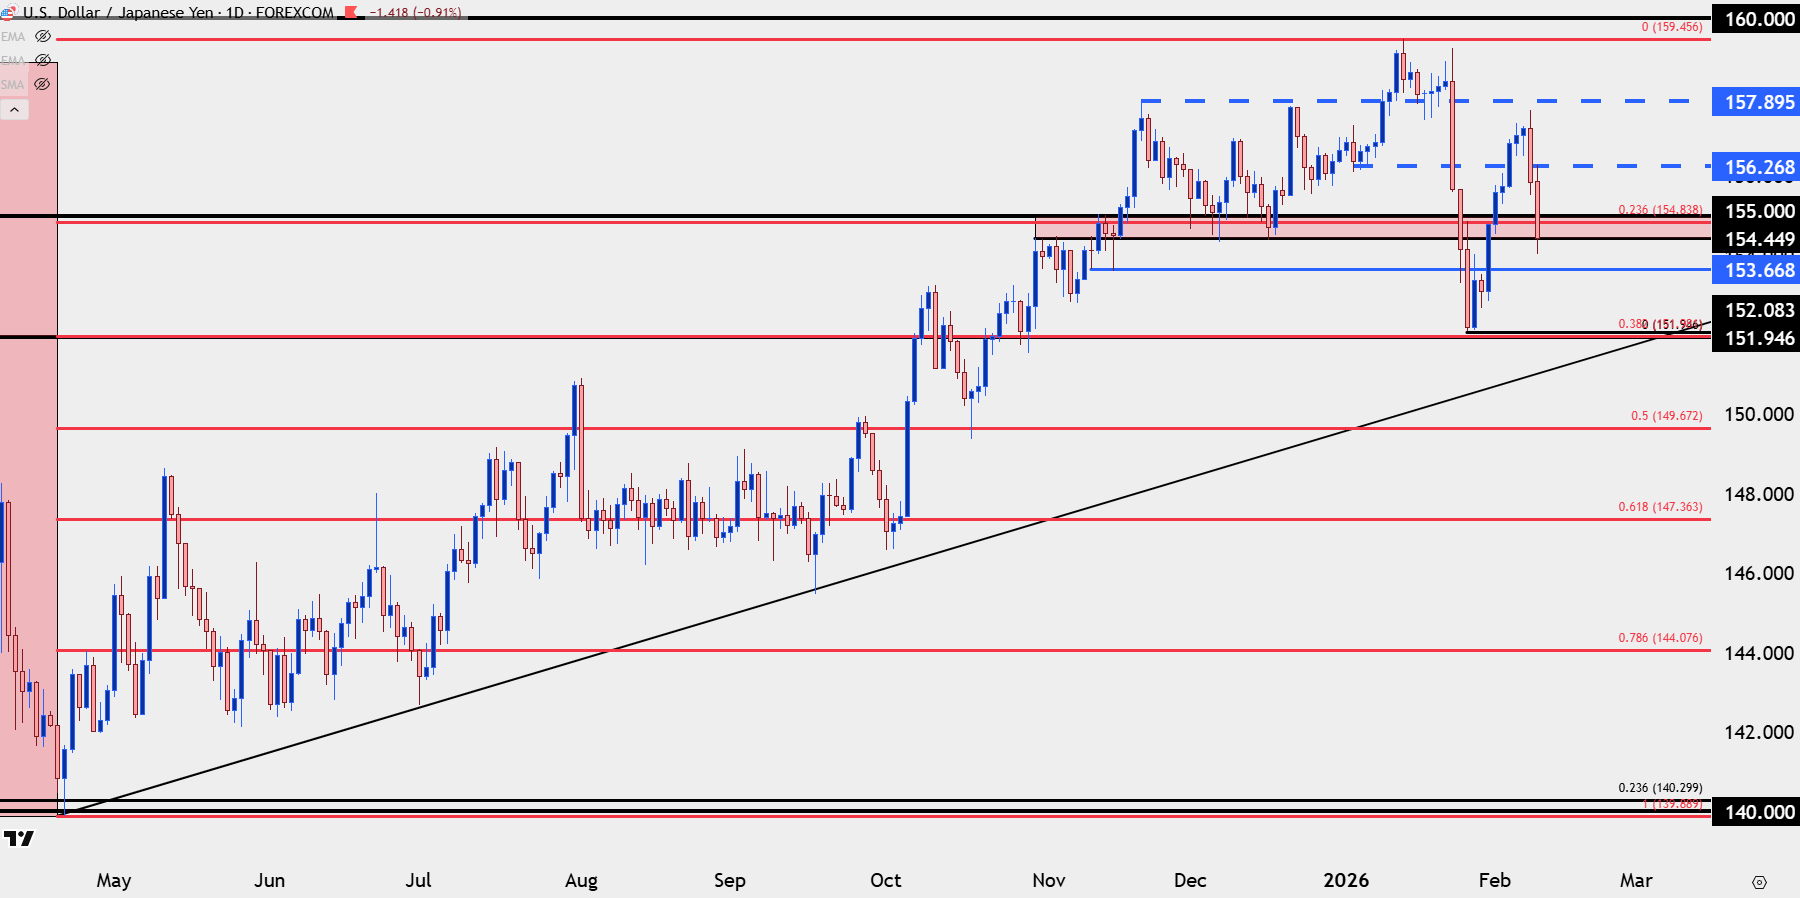
Chart prepared by James Stanley; data derived from Tradingview
GBP/JPY
In a similar vein, GBP/JPY is of interest as price is peeling back towards a zone that held support for four days following the carry unwind theme from a couple weeks ago. That support soon led to a fresh 18-year high so the focus is on the 210 zone in the near-term.
GBP/JPY Daily Chart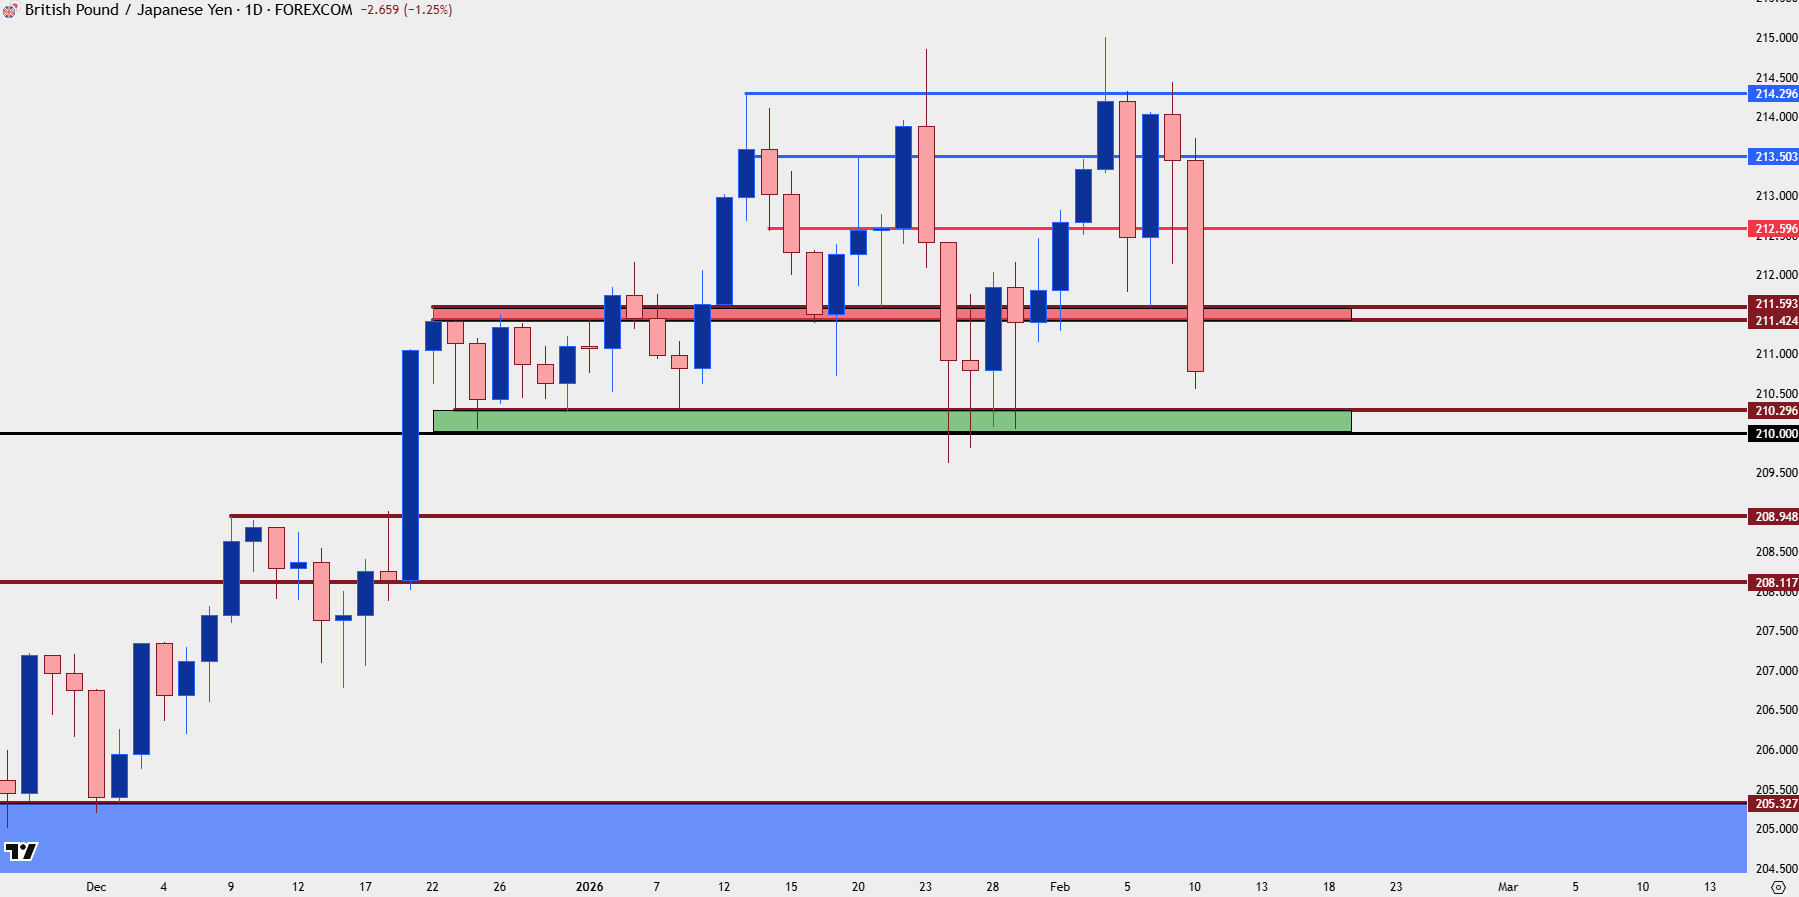
Chart prepared by James Stanley; data derived from Tradingview
EUR/JPY
While GBP/JPY jumped up to a fresh high after that support at 210, EUR/JPY held a lower-high that pushed in just yesterday. The daily chart takes on tone of an evening star and today’s sell-off is sizable, so caution is required here. But, there’s a similar zone of support in the 182.65-183.16 area with the 182.00 level of support from prior resistance just below that.
EUR/JPY Daily Chart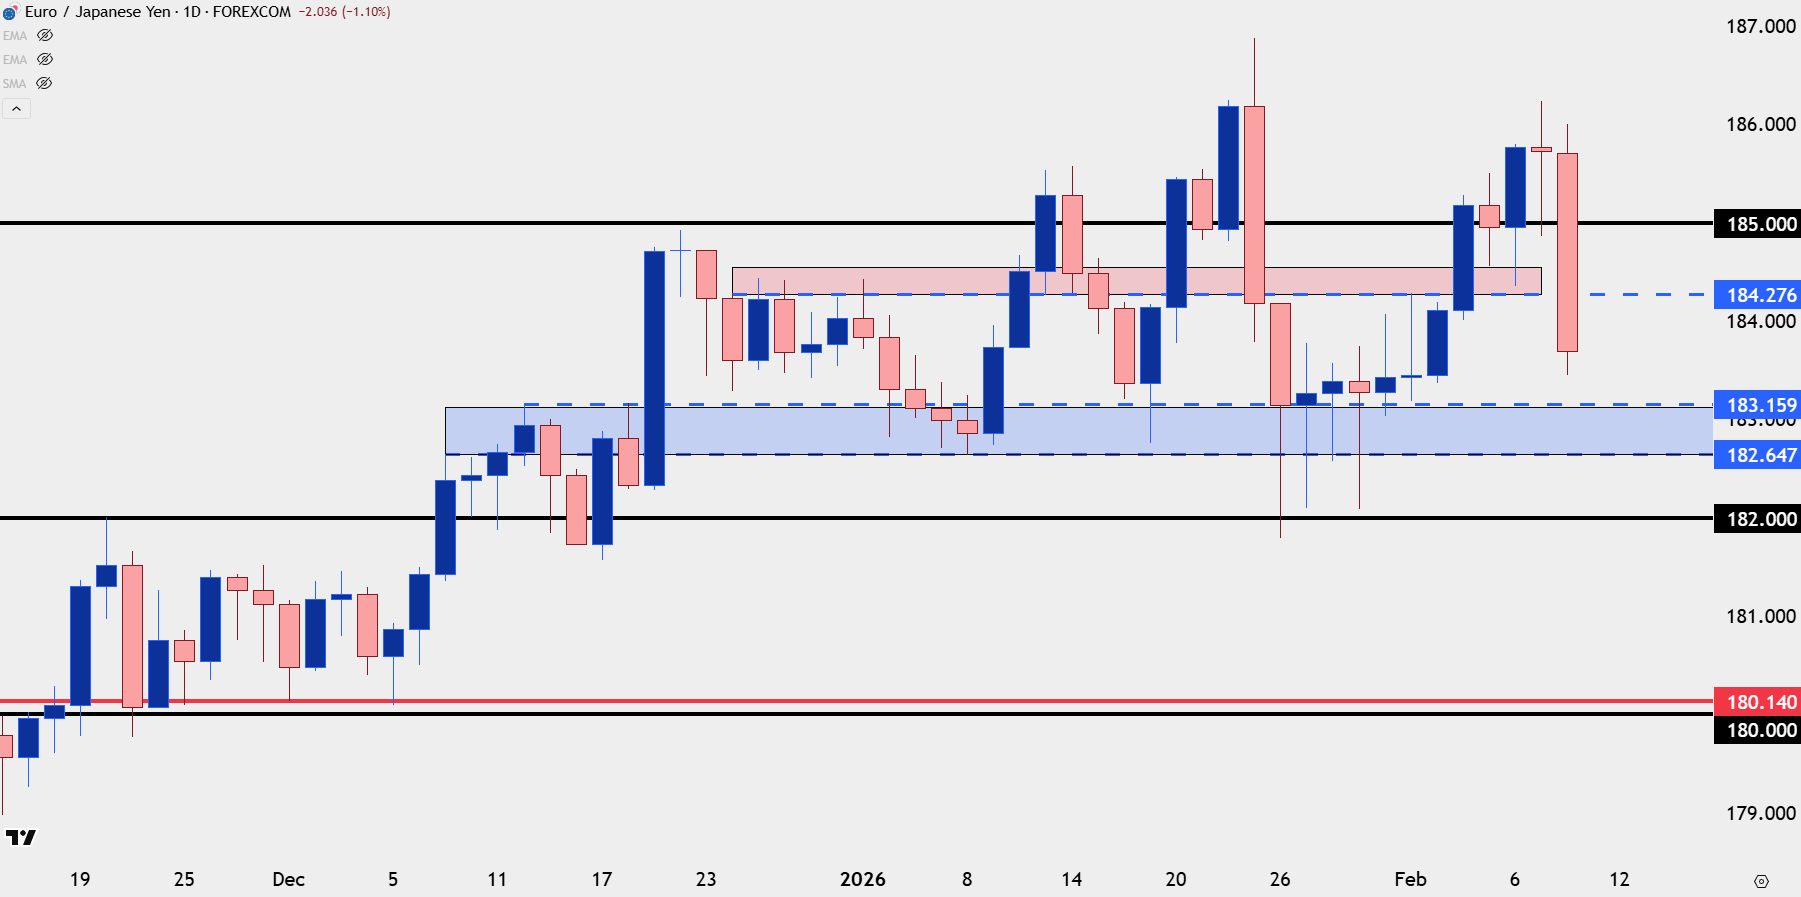
Chart prepared by James Stanley; data derived from Tradingview

EUR/USD
This has been a fairly clean move, all factors considered. Last week was showing grind on short-term charts and the Friday pullback in USD helped to push a bullish move in EUR/USD that extended through the weekly open.
At this point, price is right at the 1.1909-1.1919 zone and that’s stalled the move for the past day and change. While I expect the 1.2000 level to be problematic in bullish continuation scenarios, there’s now higher-low support potential at the area around prior resistance of 1.1837.
EUR/USD Four-Hour Chart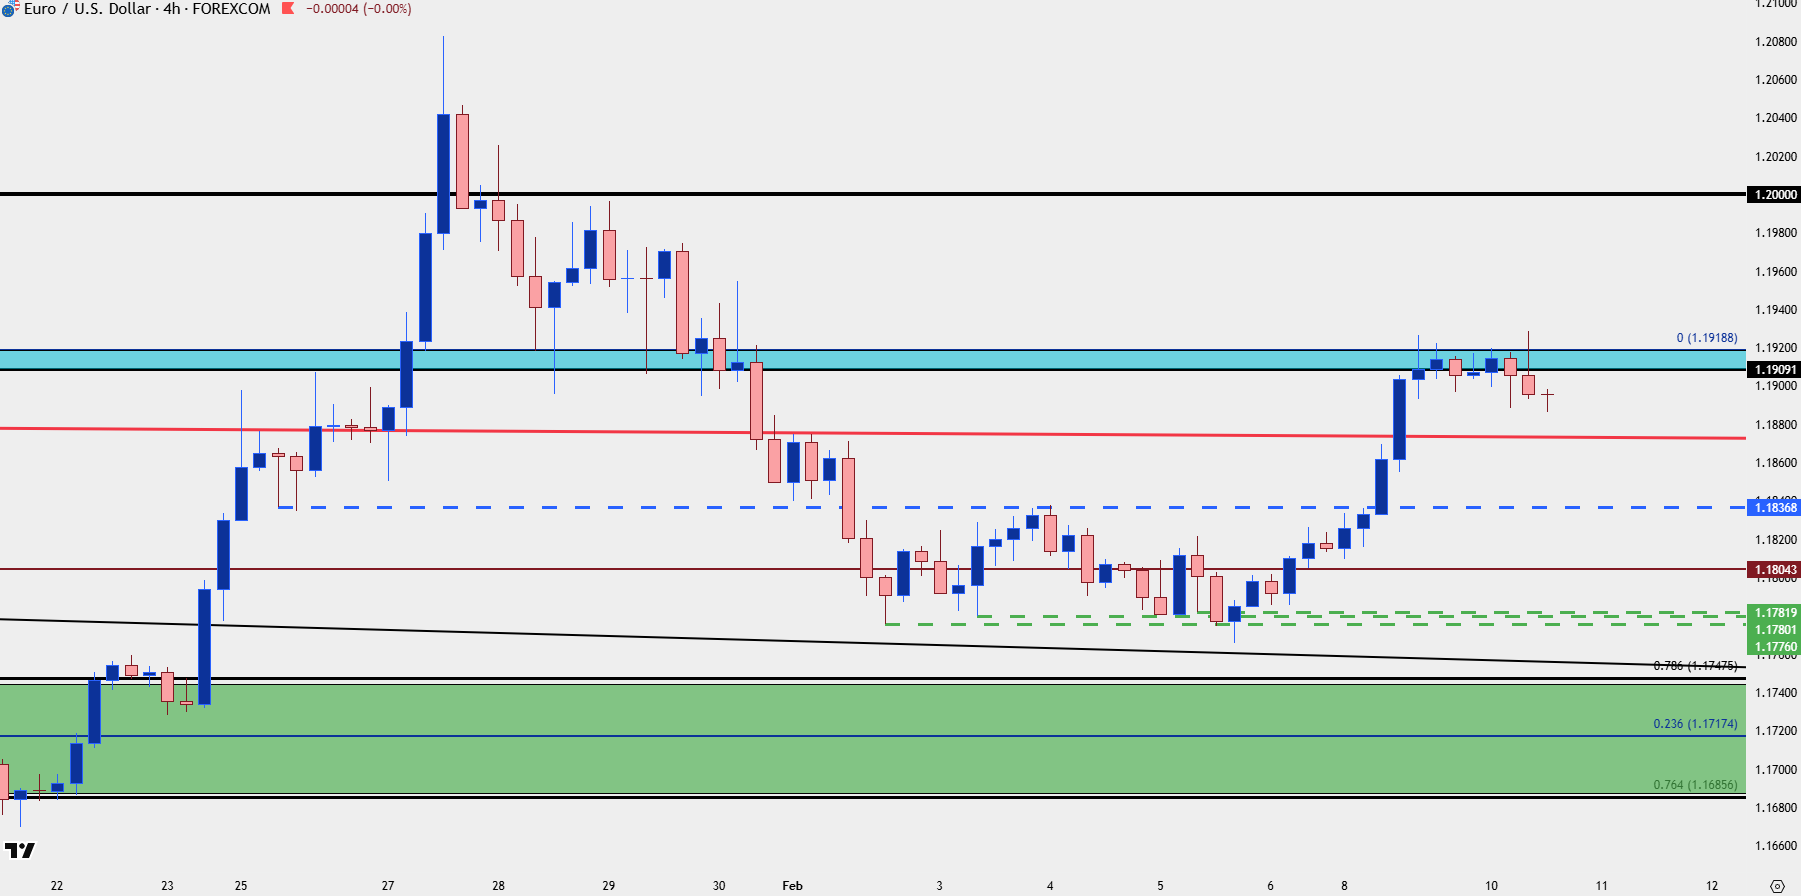
Chart prepared by James Stanley; data derived from Tradingview
GBP/USD
Cable got hit hard late last week after the BoE meeting and that sent the pair spiraling to the bottom of my ‘s2’ zone. But, sellers started to slow there and since then bulls have been clawing back, with a short-term higher-high after a higher-low. This keeps the door open for upside and at this point there could be a case as this being a more attractive venue than EUR/USD for USD-weakness scenarios.
Regardless, I expect USD to be pushed by the USD/JPY pair and the positioning that’s still built in there, but there’s now workable structure on the long side of GBP/USD that wasn’t quite there when I looked at the pair on Friday.
GBP/USD Four-Hour Chart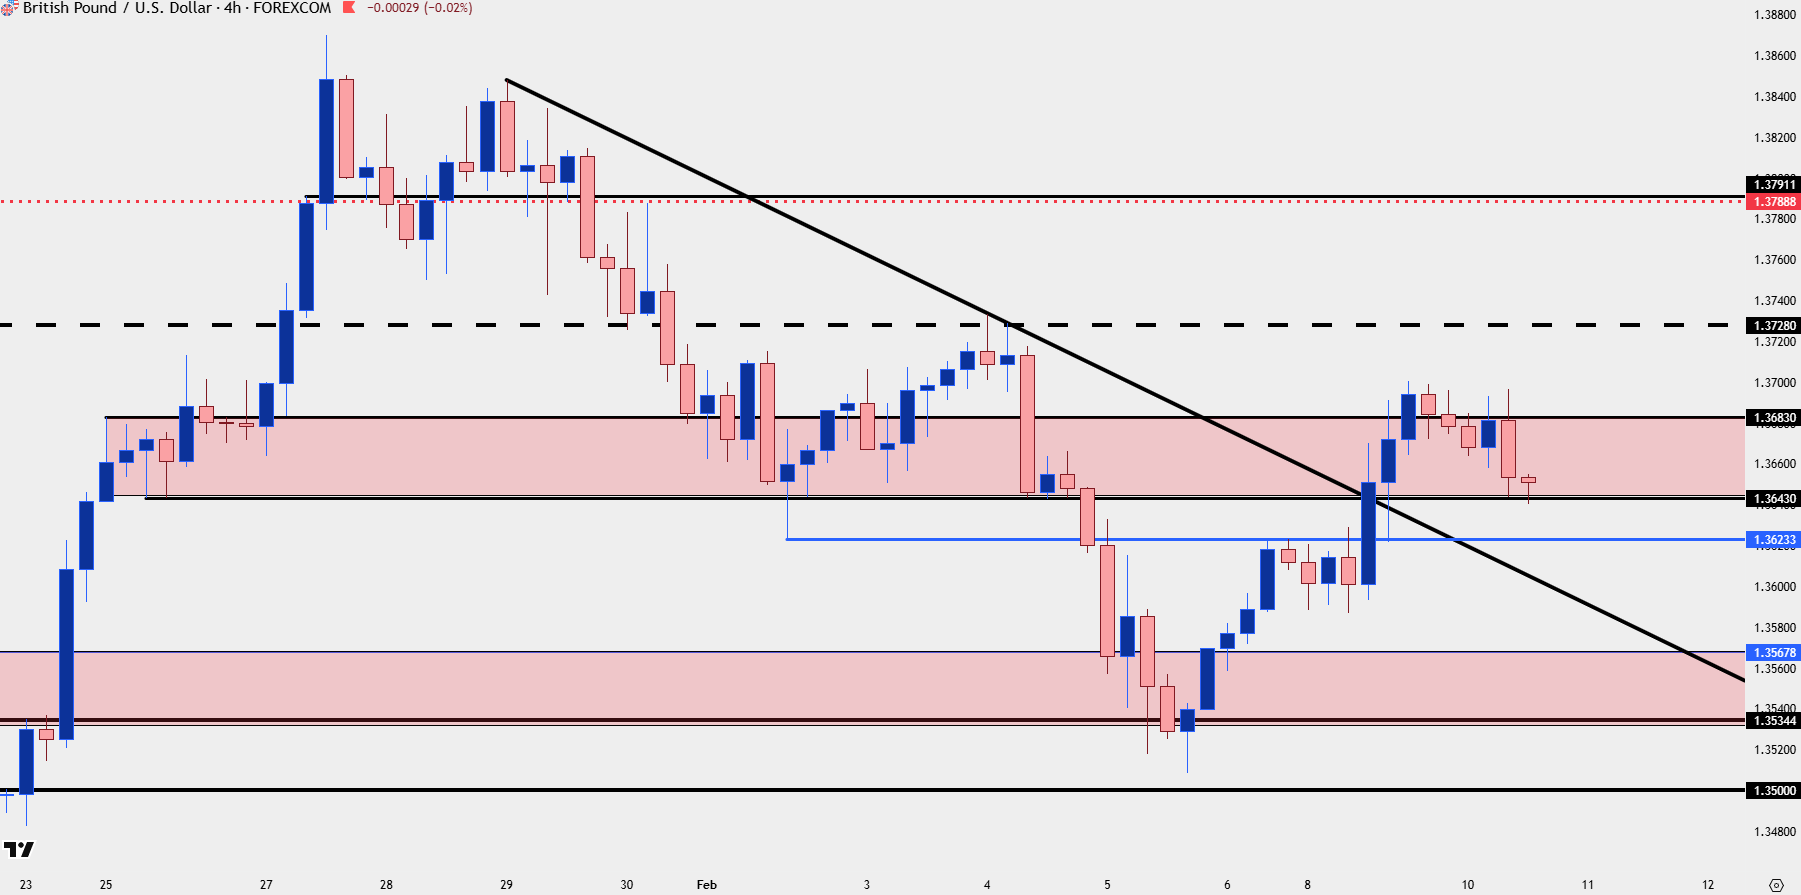
Chart prepared by James Stanley; data derived from Tradingview
--- written by James Stanley, Senior Market Analyst, Global Macro





