


The European Central Bank rate decision hasn’t shown much impact for price yet, although if reading between the lines there has been a slight build of higher-lows as the sell-off that came into this week has suddenly stalled.
At this point, bulls can probably be somewhat happy about the fact that the reversal that hit last week, exposing a wide upper wick on the weekly chart, hasn’t seen much follow-through so far this week, save for a bit of extension on Monday that pushed price down into its current spot of support.
EUR/USD Weekly Chart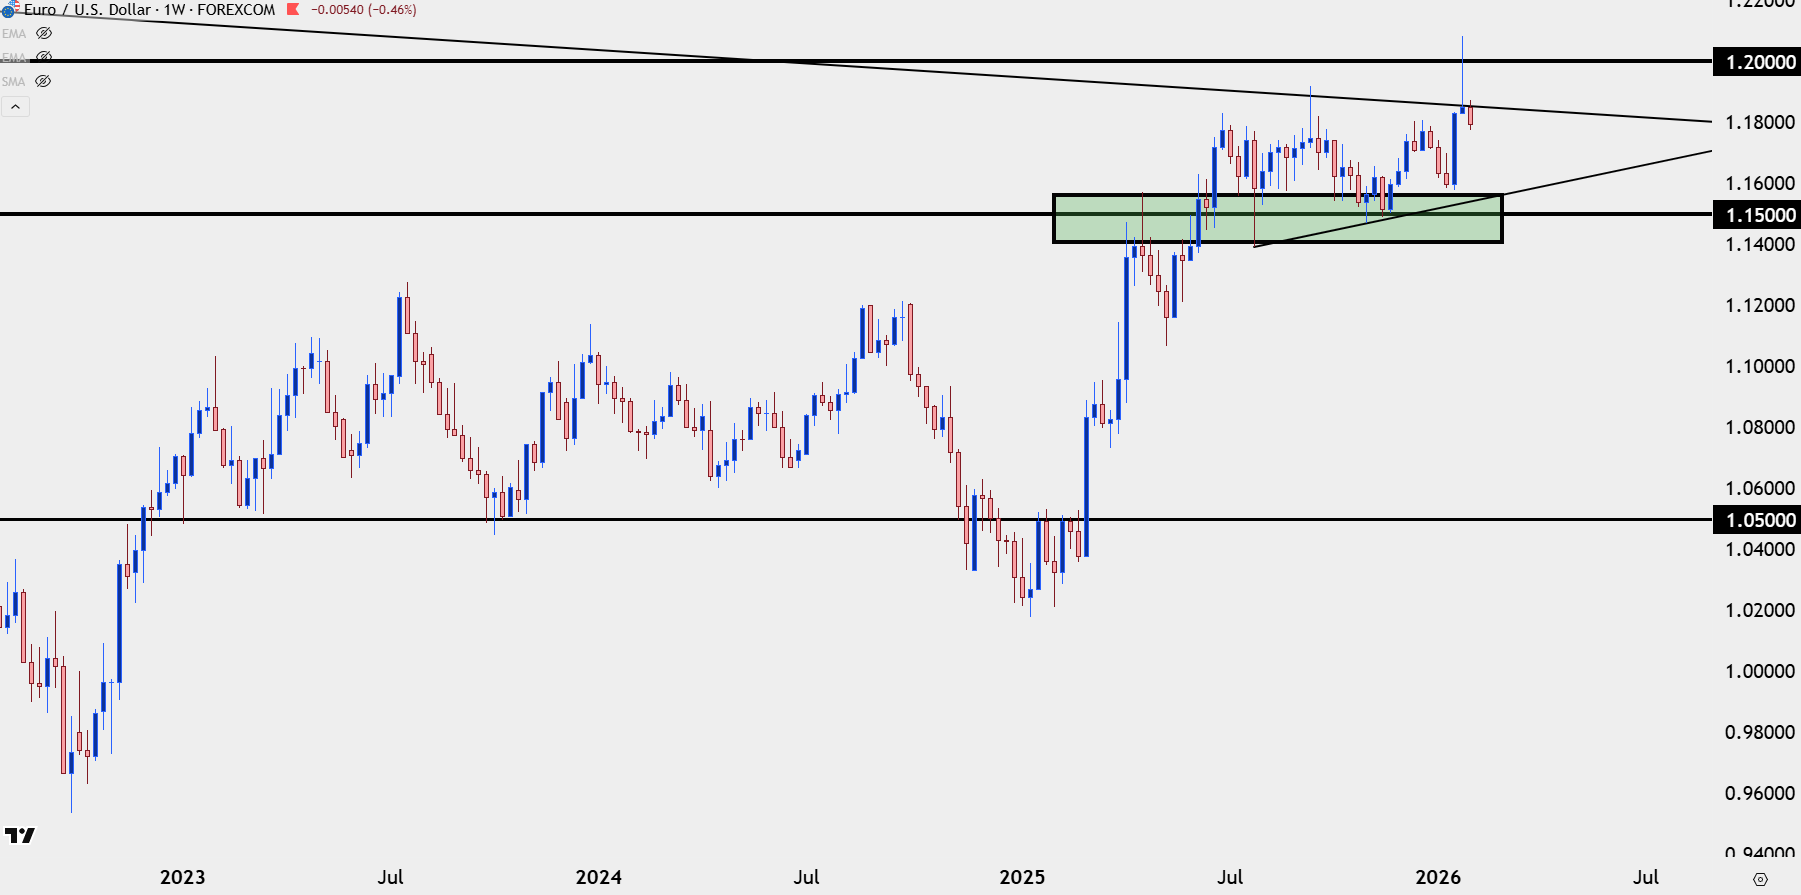
Chart prepared by James Stanley; data derived from Tradingview

EUR/USD Daily
From the daily chart there’s still some hope for bulls as the pullback that held through the weekly open has largely been stalled since that support on Monday. There is more context for support structure below, with long-term Fibonacci levels at 1.1748 and 1.1686 to go along with the 1.1717 level, which is related to the mid-January and late-December swing-lows in the pair.
Also of note, the aggressive overbought reading that had showed up to go along with the oversold reading in DXY early last week has since eased.
EUR/USD Daily Chart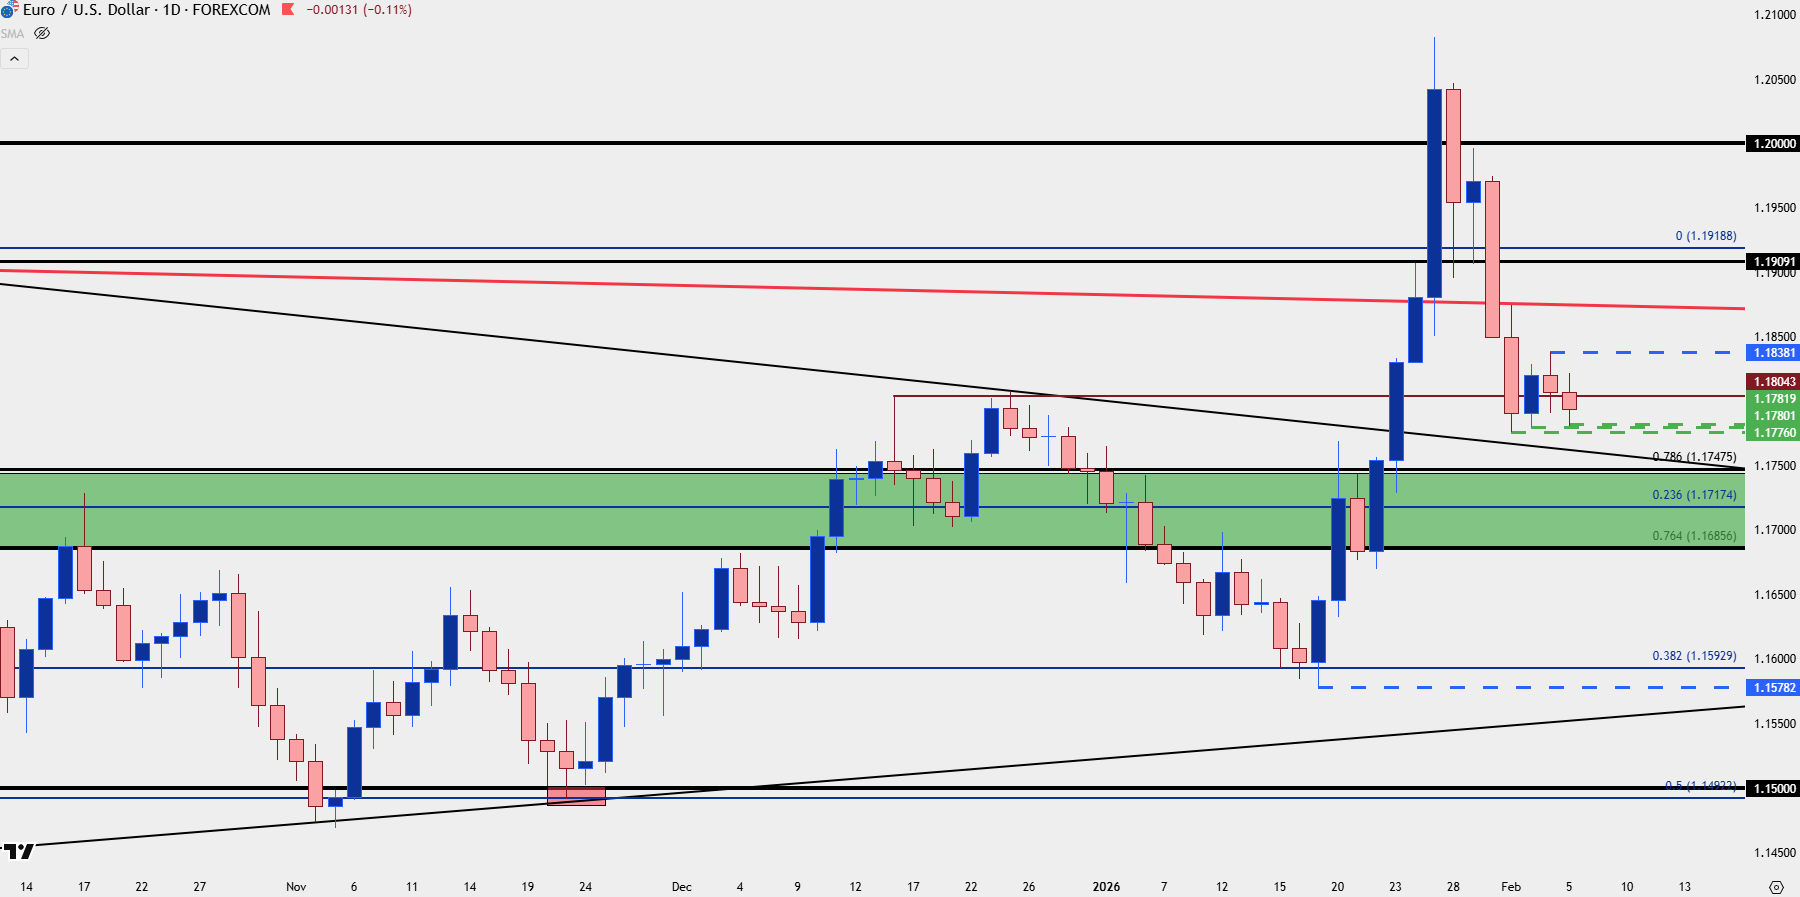
Chart prepared by James Stanley; data derived from Tradingview
EUR/USD Shorter-Term: Head and Shoulders
Head and shoulders patterns aren’t the easiest setups to work with and given that the neckline has to break for the pattern to activate, many end up not coming to fruition. This is also one of the things non-technical traders will point to as the reason that they prefer fundamentals or gut instinct or guesswork or whatever else they might use. But, the fact of the matter is the benefit of such a pattern is the context around it: That support has held for now four days and there’s so far been a diminishing impact of that. If sellers do finally slip through, the move could be sizable, and in this case, the distance from the head to the neckline is approximately 60 pips, which would point to a push towards 1.1716.
The pattern is negated by a break of the head which plots at 1.1838 and in that scenario, the daily chart above would illustrate a clean hold of support following the pullback from the failed run at 1.2000.
EUR/USD Hourly Price Chart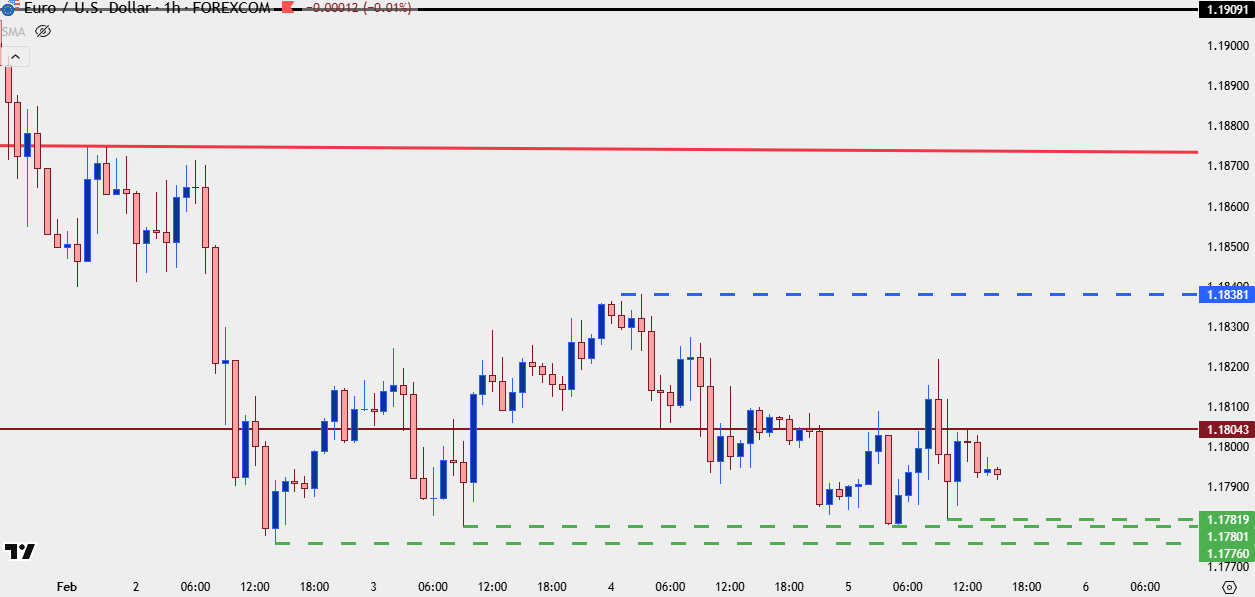
Chart prepared by James Stanley; data derived from Tradingview
--- written by James Stanley, Senior Market Analyst, Global Macro






