



Euro Technical Analysis: EUR/USD, EUR/JPY, EUR/AUD
EUR/USD faces downside risk, EUR/JPY tests key resistance near 186, while EUR/AUD shows signs of a bullish reversal from long-term support.
Share this:

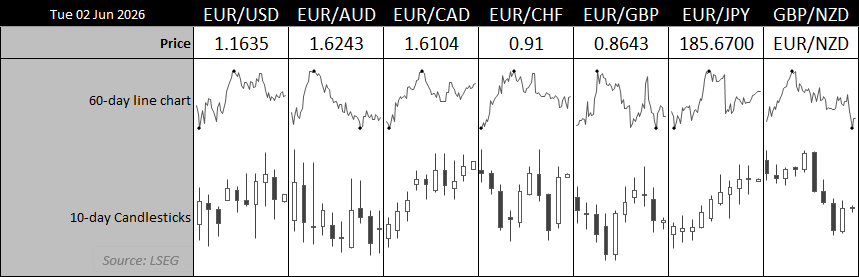
The euro is approaching important technical levels against several major currencies. EUR/USD is showing signs of weakness beneath key moving averages as demand for the US dollar improves, EUR/JPY is testing a major resistance zone amid intervention risks, and EUR/AUD is showing early signs of a bullish reversal from long-term support. Here are the key technical levels and price action setups traders should be watching this week.
View related analysis:
- FX Futures Positioning: US Dollar Bulls Return, Yen Bears Tease MOF
- How to Read the COT Report to Track Forex Market Sentiment
- Australian Dollar Outlook: AUD/USD Extends Gains, But Pullback Risks Remain
- Gold Outlook: Peace Hopes Support Gold, Options Market Signals Caution
- AUD/USD Bear Case Builds as AUD/NZD Signals Top, GBP/AUD Eyes Rebound
View related analysis:
- FX Futures Positioning: US Dollar Bulls Return, Yen Bears Tease MOF
- How to Read the COT Report to Track Forex Market Sentiment
- Australian Dollar Outlook: AUD/USD Extends Gains, But Pullback Risks Remain
- Gold Outlook: Peace Hopes Support Gold, Options Market Signals Caution
- AUD/USD Bear Case Builds as AUD/NZD Signals Top, GBP/AUD Eyes Rebound
Source: LSEG
EUR/USD Technical Analysis: Euro vs US Dollar
EUR/USD Meets Resistance at Key Moving Averages
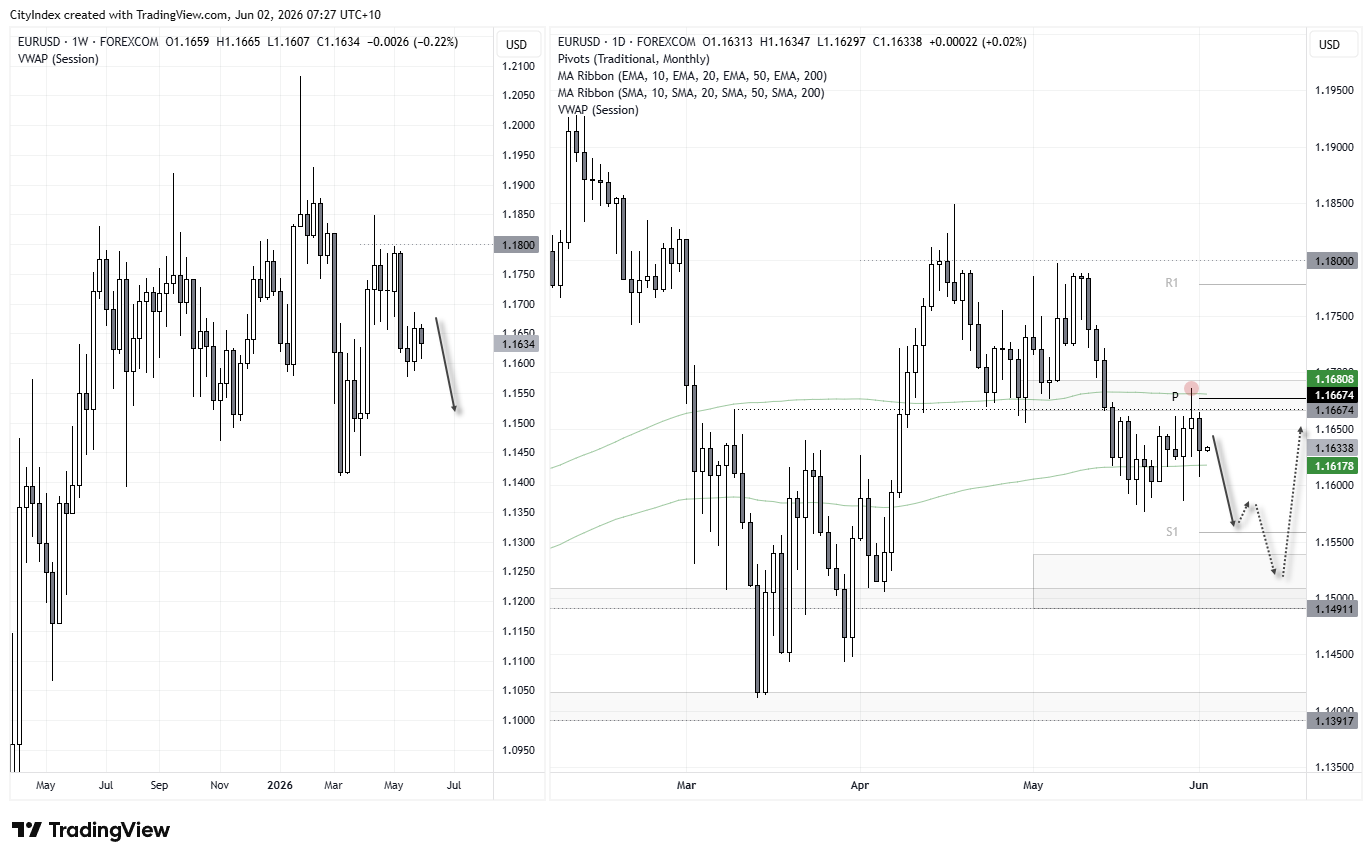
My suspicions that the US dollar may have another bout of strength up its sleeve were given a boost on Monday following yet another reversal in sentiment surrounding alleged peace talks in the Middle East. This has seen bearish momentum return around a cluster of key resistance levels on EUR/USD and potentially paves the way for the euro's next leg lower against the US dollar.
A doji formed on Friday after resistance was met at the 200-day SMA before EUR/USD retreated lower and closed around its 30 April low. The daily RSI (2) also flirted with overbought territory.
EUR/USD Bears Eye a Move Towards 1.1550
Prices rolled over on Monday to form a bearish engulfing candle, although for now EUR/USD is holding above the 1.16 handle and the 200-day EMA. If tensions in the Middle East continue to escalate and crude oil prices remain elevated, EUR/USD could be staring at a move towards the weekly S1 pivot near 1.1550. A break beneath that level would bring the 1.15 handle and weekly S2 pivot into focus for bears.
Source: Forex.com, TradingView


EUR/AUD Technical Analysis: Euro vs Australian Dollar
EUR/AUD Monthly Chart Signals a Potential Bullish Reversal
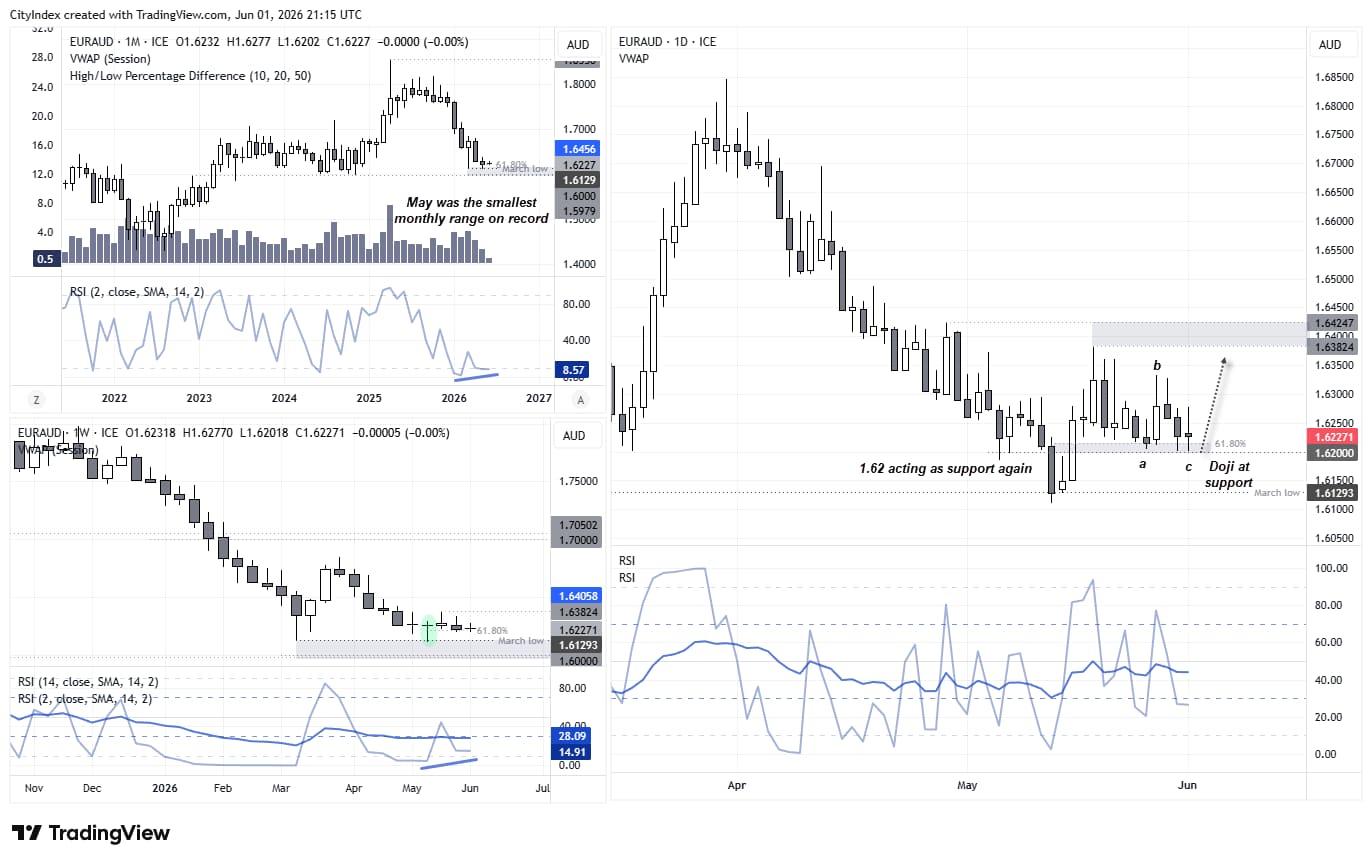
There are clues across multiple timeframes that EUR/AUD price action may be trying to turn the tide against its bearish trend from the 2025 high. The euro has fallen more than 13% since its April 2025 high, yet its high-to-low range of just 0.5% produced its smallest monthly candle on record. It also formed a spinning-top doji, warning that bearish momentum may be fading. A bullish divergence also formed on the monthly RSI (2) within oversold territory.
EUR/AUD Price Action Shows Support Emerging Above 1.62
The weekly chart shows a false break of its March low, with a bullish pin bar coinciding with bullish RSI divergence in oversold territory.
The daily chart shows EUR/AUD bursting higher in the middle of May following a failed intraday break of the March low. Prices have since retraced in an apparent three-wave move, although support has emerged around 1.62. What makes this setup particularly appealing is that it appears to be a step behind a similar pattern on GBP/AUD, which rallied from its own support level on Monday.
Given the bearish sentiment surrounding EUR/AUD and the multiple reversal signals highlighted above, EUR/AUD appears to be a credible bullish reversal candidate. Should support at 1.62 continue to hold, the technical bias favours a deeper recovery despite the broader bearish trend.
Source: ICE, TradingView
EUR/JPY Technical Analysis: Euro vs Japanese Yen
EUR/JPY Approaches Key Resistance Around 186
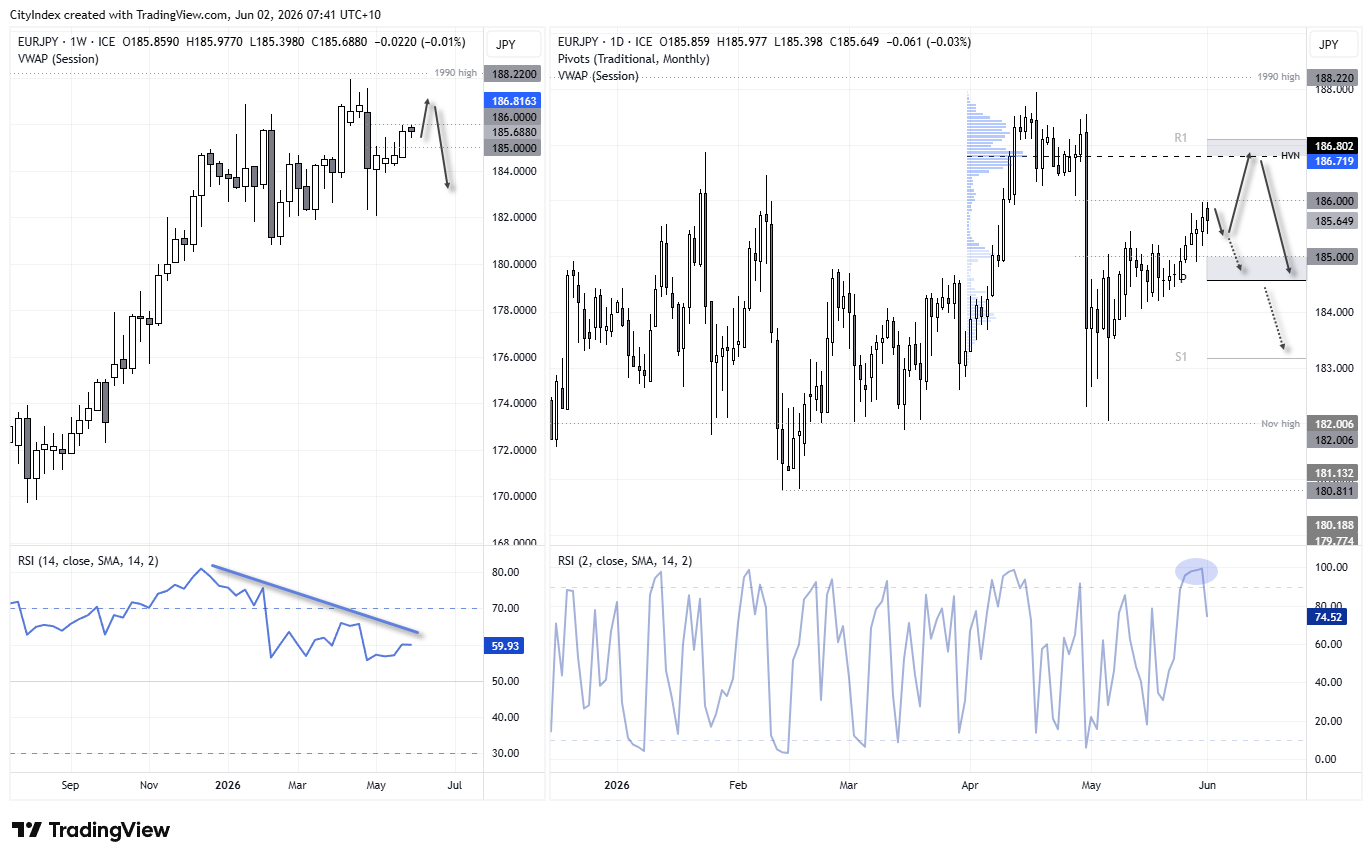
The euro may be approaching a pivotal level against the Japanese yen, although whether EUR/JPY turns sharply lower likely hinges on whether Japan's Ministry of Finance (MOF) decides to intervene in the currency market once again. Failure to do so could allow EUR/JPY to extend higher towards its next resistance cluster around 186.
EUR/JPY has posted four consecutive bullish weekly candles, its first such streak since June 2025. That said, the first three featured relatively small real bodies despite a strong bullish hammer kicking off the sequence, suggesting a degree of caution among bulls. The fourth candle, however, was far more convincing, which may lessen the significance of the earlier hesitation.
EUR/JPY Traders Watch for Yen Intervention Risk
Traders are clearly watching the 186 handle, given Monday's bearish candle respected that level. The daily RSI (2) was also deeply overbought by Friday's close, providing a technical case for a pause or pullback in the trend. Should prices move lower — presumably on the back of yen intervention — the 185 handle and monthly pivot point (184.57) come into focus.
However, if intervention fails to materialise, the path of least resistance may remain higher. In that scenario, bulls are likely to continue buying dips, bringing the high-volume node (HVN) around 186.80 and the 187 handle into focus. For now, that remains my preferred scenario.
Source: ICE, TradingView
View the full economic calendar
View the full economic calendar
-- Written by Matt Simpson
Follow Matt on Twitter @cLeverEdge
How to trade with City Index
You can trade with City Index by following these four easy steps:
- Open an account, or log in if you’re already a customer
• Open an account in the UK
• Open an account in Australia
• Open an account in Singapore
- Search for the market you want to trade in our award-winning platform
- Choose your position and size, and your stop and limit levels
- Place the trade
Latest market news




Open an account in minutes
Experience award-winning platforms with fast and secure execution, and enjoy tight spreads from 0.5 pts on FX and 0.3 pts on indices.
Economic calendar
Web Trader platform
Our sophisticated web-based platform is packed with features.
Related articles
Canadian Dollar Short-term Outlook: USD/CAD Five-Week Rally Hits a Wall at Major Resistance 10 14 2026
USD/CAD is holding near fresh yearly highs, but bearish divergence and a well-defined October range raise the stakes at major resistance.

EUR/USD Analysis: Euro Loses Ground After a Stronger-Than-Expected U.S. CPI Report
The trading week continues to unfold and weakness around the euro has once again become increasingly evident in the short term. This can be seen in the recent performance of EUR/USD, which has declined roughly 0.3% over the last three trading sessions, highlighting renewed strength in the U.S. dollar.

USD/JPY forecast: hot US CPI lifts the pair above its 200-day average
Hotter-than-expected US inflation has pushed USD/JPY above its 200-day moving average, putting 160 and the risk of Bank of Japan intervention back in focus. The breakout still needs to hold, and a failure could send the pair sharply lower.

This report is intended for general circulation only. It should not be construed as a recommendation, or an offer (or solicitation of an offer) to buy or sell any financial products. The information provided does not take into account your specific investment objectives, financial situation or particular needs. Before you act on any recommendation that may be contained in this report, independent advice ought to be sought from a financial adviser regarding the suitability of the investment product, taking into account your specific investment objectives, financial situation or particular needs.
StoneX Financial Pte. Ltd., may distribute reports produced by its respective foreign entities or affiliates within the StoneX group of companies or third parties pursuant to an arrangement under Regulation 32C of the Financial Advisers Regulations. Where the report is distributed to a person in Singapore who is not an accredited investor, expert investor or an institutional investor (as defined in the Securities Futures Act), StoneX Financial Pte. Ltd. accepts legal responsibility to such persons for the contents of the report only to the extent required by law. Singapore recipients should contact StoneX Financial Pte. Ltd. at 6826 9988 for matters arising from, or in connection with the report.
In the case of all other recipients of this report, to the extent permitted by applicable laws and regulations neither StoneX Financial Pte. Ltd. nor its associated companies will be responsible or liable for any loss or damage incurred arising out of, or in connection with, any use of the information contained in this report and all such liability is hereby expressly disclaimed. No representation or warranty is made, express or implied, that the content of this report is complete or accurate.
StoneX Financial Pte. Ltd. is not under any obligation to update this report.
Trading CFDs carries a high level of risk that may not be suitable for some investors. Consider your investment objectives, level of experience, financial resources, risk appetite and other relevant circumstances carefully. The possibility exists that you could lose some or all of your investments, including your initial deposits. If in doubt, please seek independent expert advice. Visit www.forex.com/en-sg/terms-and-policies for the complete Risk Disclosure Statement.