


European Open: Are geopolitical tensions set to push oil prices higher again?
With oil prices having fallen over 20% from their highs and Russia set to close gap supplies once more, we see the potential for oil to hit bid again.
Share this:

Asian Indices:
- Australia's ASX 200 index rose by 17.4 points (0.26%) and currently trades at 6,807.30
- Japan's Nikkei 225 index has fallen by -50.2 points (-0.18%) and currently trades at 27,649.05
- Hong Kong's Hang Seng index has risen by 287.7 points (1.4%) and currently trades at 20,850.64
- China's A50 Index has risen by 67.94 points (0.49%) and currently trades at 14,060.11
UK and Europe:
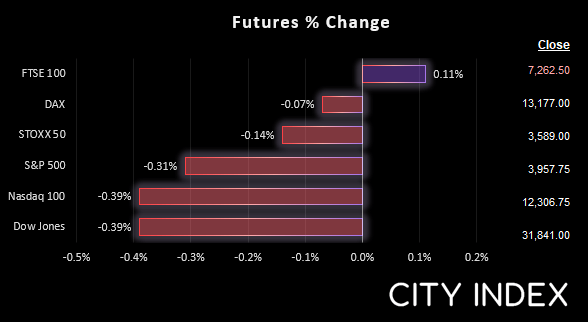
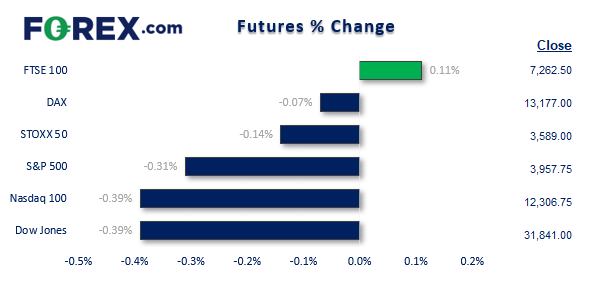
- UK's FTSE 100 futures are currently up 8 points (0.11%), the cash market is currently estimated to open at 7,314.30
- Euro STOXX 50 futures are currently down -5 points (-0.14%), the cash market is currently estimated to open at 3,599.16
- Germany's DAX futures are currently down -9 points (-0.07%), the cash market is currently estimated to open at 13,201.32
US Futures:
- DJI futures are currently down -126 points (-0.39%)
- S&P 500 futures are currently down -47.25 points (-0.38%)
- Nasdaq 100 futures are currently down -12.25 points (-0.31%)
Energy prices were higher overnight after Russia said it would cut its gas supply to Europe from Wednesday. This is a blow to hopes that economic pressures would ease across Europe after Russia previously said they would allow Ukraine to export grain from the Black Sea. And these fears have been exacerbated on reports that Russia is attacking coastal regions in the Black Sea area.
Naturally, supply concerns have resurfaced and this could continue to place upwards pressure on oil prices. Over the past two weeks we have seen managed funds trim their short exposure to WTI futures, and last week increased long exposure. So perhaps we have already seen a low in oil prices over the near-term.
Brent daily chart:
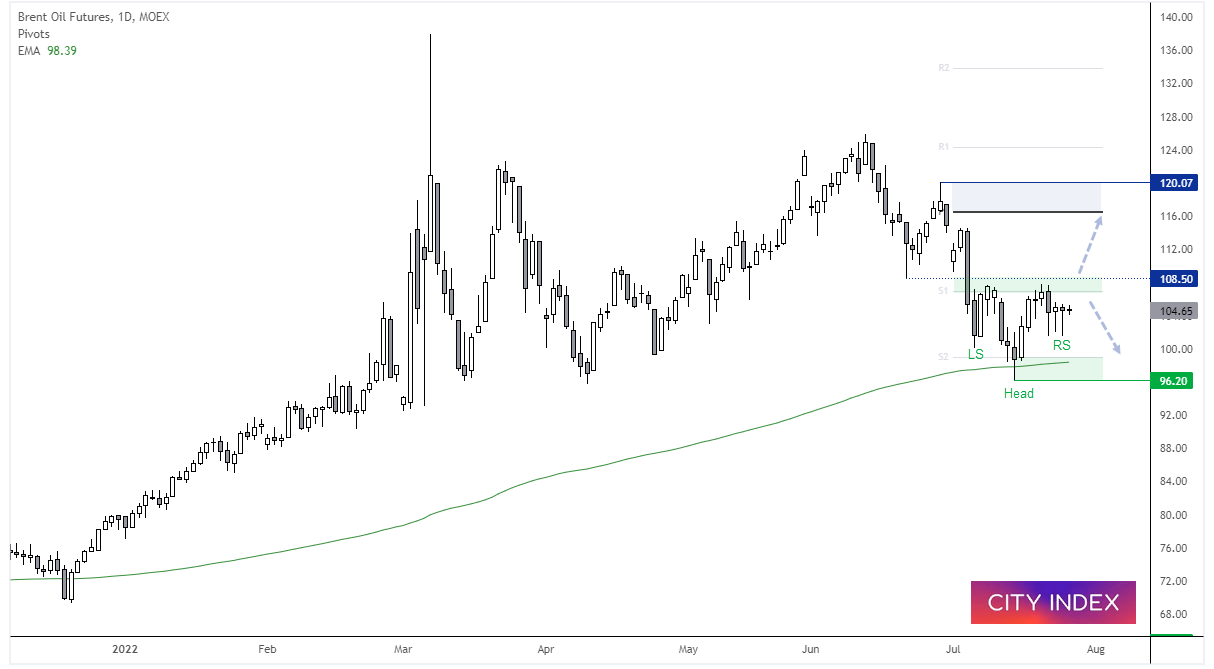
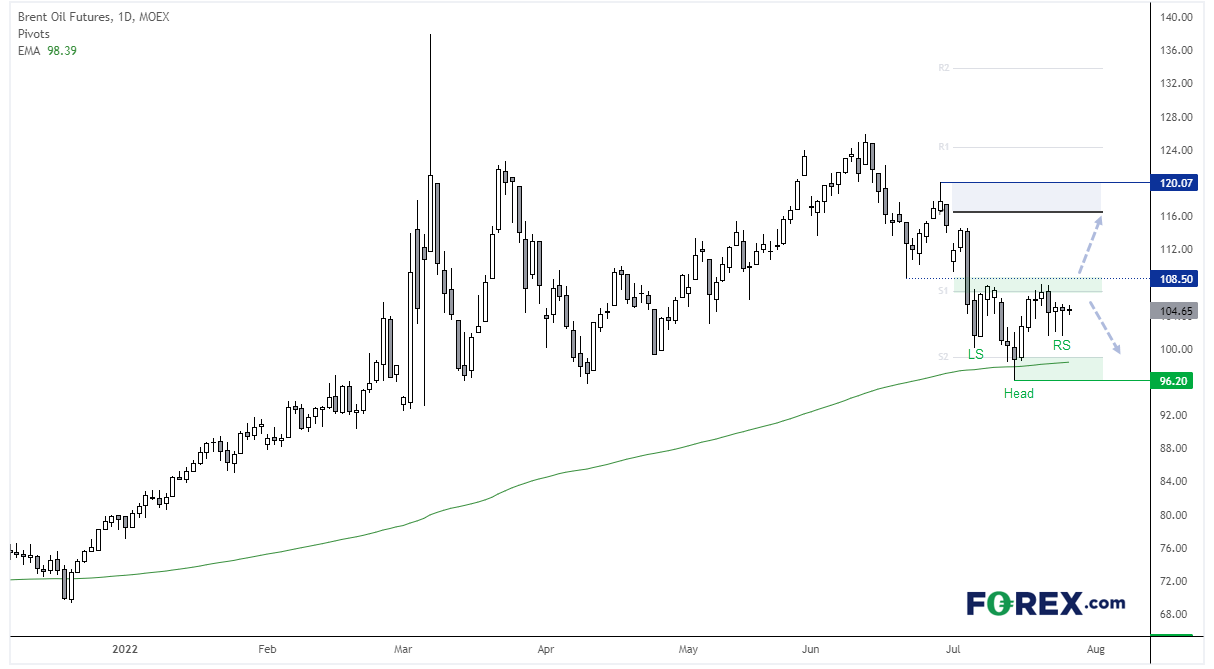
Brent fell around -23% from the June high before finding support at its 200-day eMA. Prices have since recovered back above $100 and retested a prior swing high, and a subsequent pullback leaves a potential inverted head and shoulders pattern (H&S) on the daily chart. Two bullish hammers have formed as part of a potential ‘right shoulders’ (RS).
If successful the pattern projects a target around $120, near the monthly pivot point. Traditionally traders would wait for a break above the neckline to confirm the pattern. However, an alternative approach is to enter during the ‘RS’ phase to anticipate the breakout, otherwise known as the Quasimodo pattern. The risk here is the market fails to break above resistance, but it can increase the potential reward to risk ratio. In either case, the bias would remain bullish above the recent hammer low / RS.
Cautious trade leads to tight ranges
Volatility was low overall as we head towards this week’s FOMC meeting. Traders continue to favour a 75-bp hike, although a 100-bp remains a noteworthy possibility. GBP was the strongest major currency whilst USD and CHF were the weakest, but with ranges remaining tight it is difficult to read too much into their relative strength.
FTSE 350 – Market Internals:
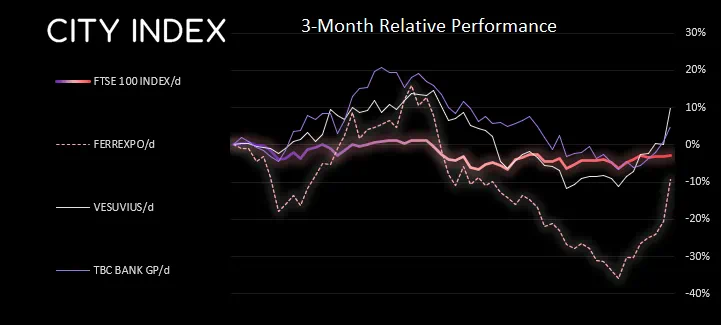
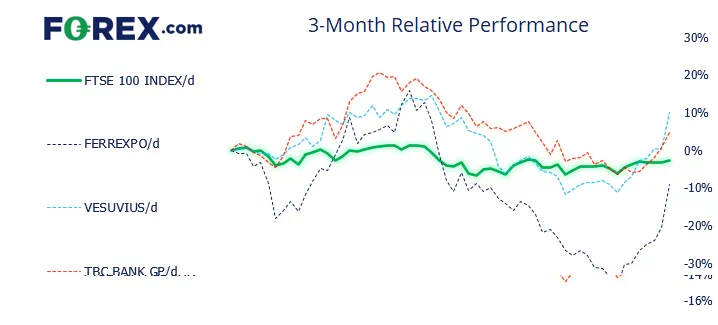
FTSE 350: 4075.64 (0.41%) 22 July 2022
- 157 (44.73%) stocks advanced and 176 (50.14%) declined
- 7 stocks rose to a new 52-week high, 1 fell to new lows
- 29.34% of stocks closed above their 200-day average
- 79.77% of stocks closed above their 50-day average
- 22.79% of stocks closed above their 20-day average
Outperformers:
- + 14.18% - Ferrexpo PLC (FXPO.L)
- + 9.91% - Vesuvius PLC (VSVS.L)
- + 4.01% - TBC Bank Group PLC (TBCG.L)
Underperformers:
- -6.45% - Jupiter Fund Management PLC (JUP.L)
- -4.81% - Chrysalis Investments Ltd (CHRY.L)
- -4.74% - Carnival PLC (CCL.L)
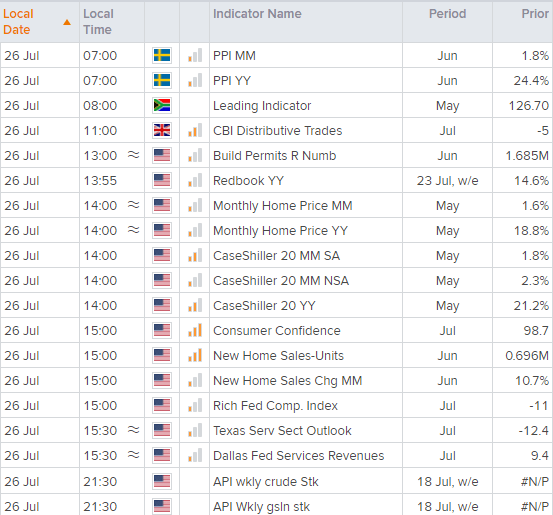
Economic events up next (Times in BST)
How to trade with City Index
You can easily trade with City Index by using these four easy steps:
- Open an account, or log in if you’re already a customer
• Open an account in the UK
• Open an account in Australia
• Open an account in Singapore
- Search for the company you want to trade in our award-winning platform
- Choose your position and size, and your stop and limit levels
- Place the trade
How to trade with FOREX.com
Follow these easy steps to start trading with FOREX.com today:
- Open a Forex.com account, or log in if you’re already a customer.
- Search for the pair you want to trade in our award-winning platform.
- Choose your position and size, and your stop and limit levels.
- Place the trade.
Latest market news


Open an account in minutes
Experience award-winning platforms with fast and secure execution, and enjoy tight spreads from 0.5 pts on FX and 0.3 pts on indices.
Economic calendar
Web Trader platform
Our sophisticated web-based platform is packed with features.
Related articles
EUR/USD Outlook: AI sentiment returns as French debt fears fades
French debt was the market's obsession a week ago. Now, short-term correlations suggest technology sentiment may be calling more of the shots, with central bank decisions and heavyweight tech earnings threatening to accelerate the euro's decline.
AUD, NZD, CAD: Commodity FX Faces a 24-Hour Central Bank Storm
Australian CPI and rate decisions from the RBNZ, BoC and Fed put AUD, NZD and CAD to the test, with inflation surprises and policy guidance in focus.
FOMC Meeting Preview: Is Warsh Even Capable of Delivering a Hawkish Hold?
Fed Funds futures traders are pricing in ~90% odds that the FOMC leaves rates unchanged this week, but the big question is whether FOMC Chairman Warsh can deliver a true hawkish hike.

This report is intended for general circulation only. It should not be construed as a recommendation, or an offer (or solicitation of an offer) to buy or sell any financial products. The information provided does not take into account your specific investment objectives, financial situation or particular needs. Before you act on any recommendation that may be contained in this report, independent advice ought to be sought from a financial adviser regarding the suitability of the investment product, taking into account your specific investment objectives, financial situation or particular needs.
StoneX Financial Pte. Ltd., may distribute reports produced by its respective foreign entities or affiliates within the StoneX group of companies or third parties pursuant to an arrangement under Regulation 32C of the Financial Advisers Regulations. Where the report is distributed to a person in Singapore who is not an accredited investor, expert investor or an institutional investor (as defined in the Securities Futures Act), StoneX Financial Pte. Ltd. accepts legal responsibility to such persons for the contents of the report only to the extent required by law. Singapore recipients should contact StoneX Financial Pte. Ltd. at 6826 9988 for matters arising from, or in connection with the report.
In the case of all other recipients of this report, to the extent permitted by applicable laws and regulations neither StoneX Financial Pte. Ltd. nor its associated companies will be responsible or liable for any loss or damage incurred arising out of, or in connection with, any use of the information contained in this report and all such liability is hereby expressly disclaimed. No representation or warranty is made, express or implied, that the content of this report is complete or accurate.
StoneX Financial Pte. Ltd. is not under any obligation to update this report.
Trading CFDs carries a high level of risk that may not be suitable for some investors. Consider your investment objectives, level of experience, financial resources, risk appetite and other relevant circumstances carefully. The possibility exists that you could lose some or all of your investments, including your initial deposits. If in doubt, please seek independent expert advice. Visit www.forex.com/en-sg/terms-and-policies for the complete Risk Disclosure Statement.