




EUR/USD Rate Cut Rally After Bullish Defense of 1.1000
EUR/USD is showing indecision in the weekly bar at this point, but the big item so far has been a bounce after buyers defended the 1.1000 level even as the European Central Bank posed another rate cut.
Share this:

EUR/USD Talking Points:
- The European Central Bank reduced rates again this week and the door is open for more possible softening in the months ahead.
- This might not be visible from the EUR/USD chart, however, as the pair posed a stark rally in the aftermath of that rate decision.
- I’ll be looking into these setups in the Tuesday webinar and you’re welcome to join, click here for registration information.
EUR/USD put in a sizable rally from the start of Q3 and into late-August trade. This pushed the pair to deeply-overbought conditions on the daily, and price even came close to overbought territory via RSI on the weekly chart, with a 69.8 read three weeks ago.
The fundamental case for such a move was lacking as the European Central Bank remains in a dovish position, with more rate cuts likely to follow the most recent adjustment on Thursday. And for the early part of the past week, it looked as though EUR/USD bears might be able to force a push. But the 1.1000 level proved to be a tough level for bears to beat as support showed two pips-above ahead of the ECB meeting, which then led to a strong bounce after the bank’s rate cut announcement.
At this point from the four-hour chart, we can see where this produced a higher-high above the prior lower-high. This is shorter-term but, it does provide some scope for buyers if they can defend that structure to make another forward push towards 1.1140 or perhaps even the 1.1200 level that turned-around price a few weeks ago.
EUR/USD Four-Hour Price Chart
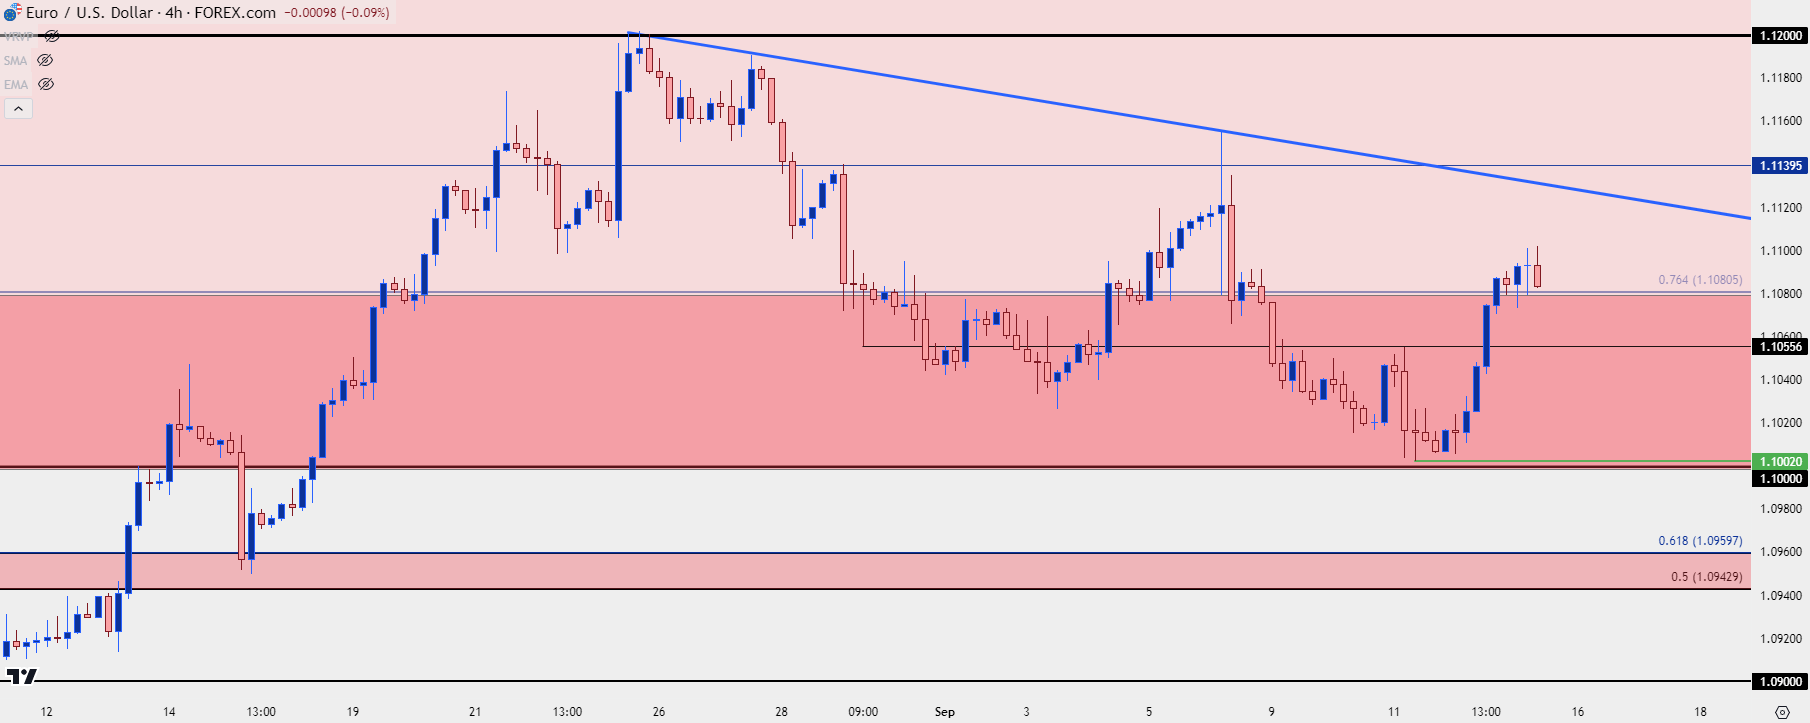 Chart prepared by James Stanley, EUR/USD on Tradingview
EUR/USD Daily: Possible Bull Flag
Taking a step back we can see some symmetry between recent support and resistance, helping to establish a channel. This could add some enthusiasm on the long side but the key will be a bullish breach of the formation, which also highlights the importance of 1.1140. And, shorter-term, the 1.1081 level.
Of course, for this formation to fill, we’ll likely need to see some continued USD-weakness and with FOMC on the calendar for next week, the range of possible outcomes widens significantly. The question there will likely go back to the Fed’s dot plot matrix and how many cuts the bank is looking to push for the rest of this year and through 2025 trade.
EUR/USD Daily Price Chart
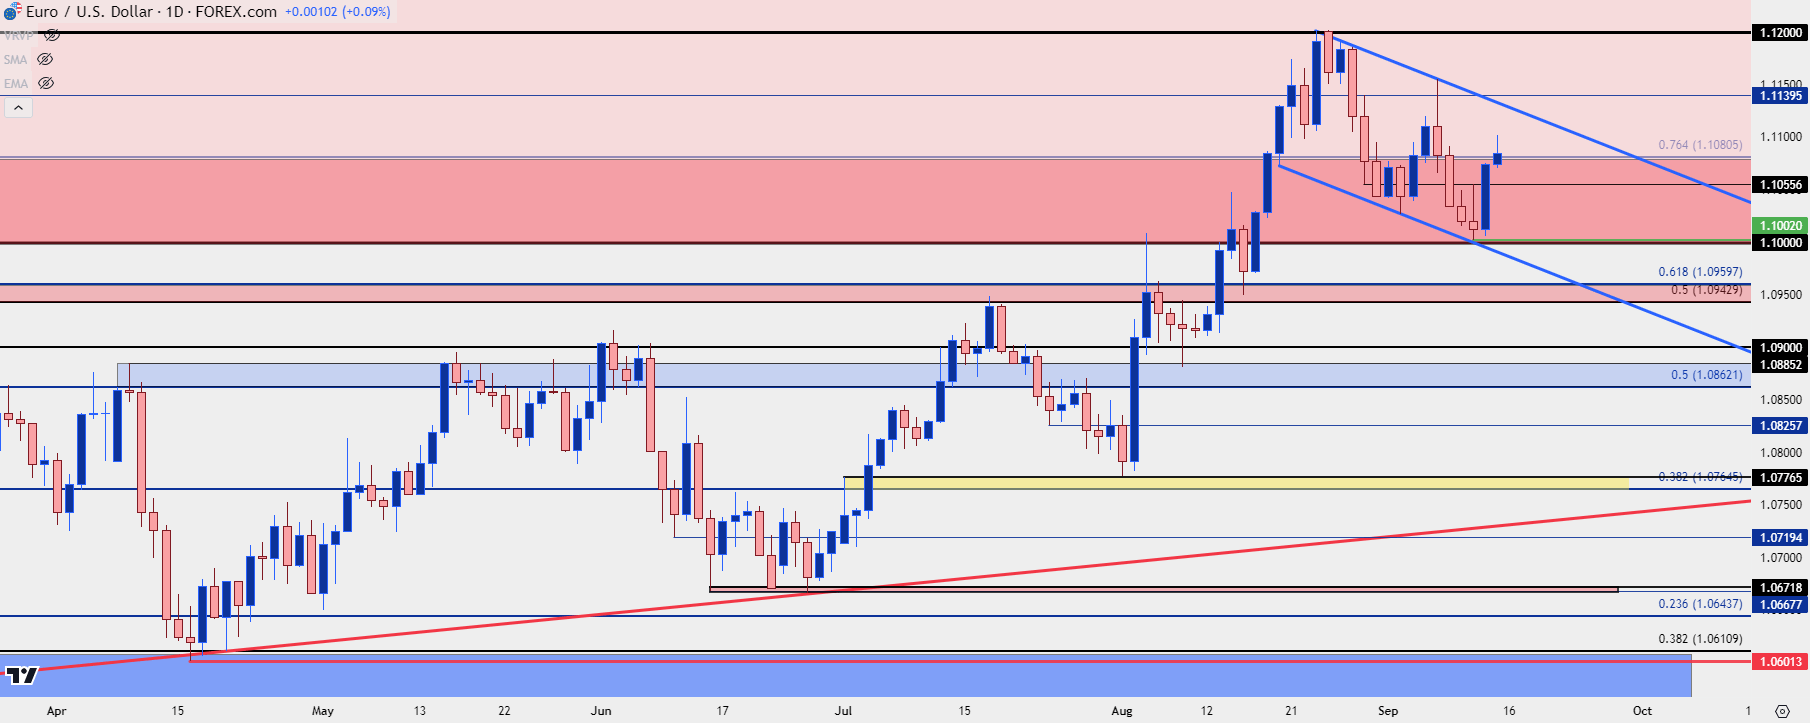 Chart prepared by James Stanley, EUR/USD on Tradingview
EUR/USD Big Picture
At this point, the case can still be made that EUR/USD exists within a year-and-a-half long range. Last year’s high printed right at the 61.8% Fibonacci retracement of the 2021-2022 major move at 1.1275, and that becomes the next major level in bullish scenarios for the pair in which buyers are able to push a break above the 1.1200 level that held the highs a few weeks ago.
This also places more importance on the 1.0943-1.1000 zone, which has so far exhibited support at prior resistance. If bulls fail to hold that then range continuation scenarios remain in-play.
EUR/USD Weekly Price Chart
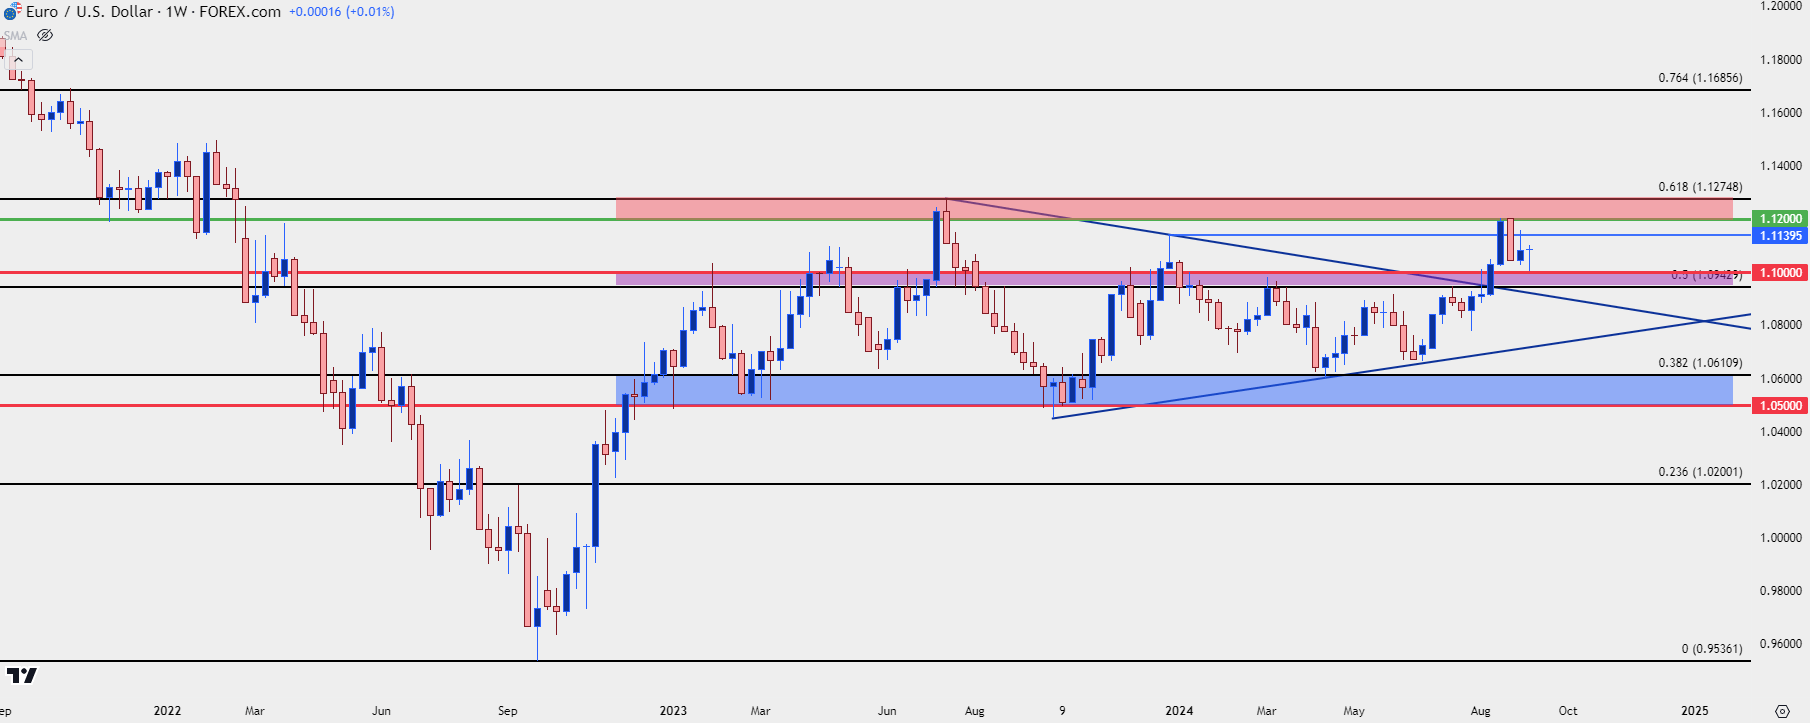 Chart prepared by James Stanley, EUR/USD on Tradingview
--- written by James Stanley, Senior Strategist
Related tags:
Latest market news




Open an account in minutes
Experience award-winning platforms with fast and secure execution, and enjoy tight spreads from 0.5 pts on FX and 0.3 pts on indices.
Economic calendar
Web Trader platform
Our sophisticated web-based platform is packed with features.
Related articles
Gold Rallies Towards a $4k Test – but Can Bulls Break the Trend?
Gold prices melted down last week but so far this week, a different tone has taken over. But can this turn into anything more than a short squeeze?

US Midterm Forecast: The Key Risks for Traders to Watch Through the US Elections
Prediction markets are pricing in nearly 75% odds of a Democratic sweep in this week’s US midterm elections, a development that would result in a split from the single party Republican rule of the past two years - what will it mean for markets?


Nasdaq 100 Forecast: NDX rebounds as oil prices fall and ahead of Apple earnings
U.S. stock indices are moving higher on Monday as tech and AI-related stocks steady following a shocking October. The mood remains cautious following the AI wobble, with more tech earnings due this week, U.S. midterm elections and a full U.S. economic data calendar.

This report is intended for general circulation only. It should not be construed as a recommendation, or an offer (or solicitation of an offer) to buy or sell any financial products. The information provided does not take into account your specific investment objectives, financial situation or particular needs. Before you act on any recommendation that may be contained in this report, independent advice ought to be sought from a financial adviser regarding the suitability of the investment product, taking into account your specific investment objectives, financial situation or particular needs.
StoneX Financial Pte. Ltd., may distribute reports produced by its respective foreign entities or affiliates within the StoneX group of companies or third parties pursuant to an arrangement under Regulation 32C of the Financial Advisers Regulations. Where the report is distributed to a person in Singapore who is not an accredited investor, expert investor or an institutional investor (as defined in the Securities Futures Act), StoneX Financial Pte. Ltd. accepts legal responsibility to such persons for the contents of the report only to the extent required by law. Singapore recipients should contact StoneX Financial Pte. Ltd. at 6826 9988 for matters arising from, or in connection with the report.
In the case of all other recipients of this report, to the extent permitted by applicable laws and regulations neither StoneX Financial Pte. Ltd. nor its associated companies will be responsible or liable for any loss or damage incurred arising out of, or in connection with, any use of the information contained in this report and all such liability is hereby expressly disclaimed. No representation or warranty is made, express or implied, that the content of this report is complete or accurate.
StoneX Financial Pte. Ltd. is not under any obligation to update this report.
Trading CFDs carries a high level of risk that may not be suitable for some investors. Consider your investment objectives, level of experience, financial resources, risk appetite and other relevant circumstances carefully. The possibility exists that you could lose some or all of your investments, including your initial deposits. If in doubt, please seek independent expert advice. Visit www.forex.com/en-sg/terms-and-policies for the complete Risk Disclosure Statement.