







FTSE Long And Short Of It Aveva Spirent Oxford
A technical look at potential long or short opportunities within the FTSE 350.
Share this:


- FTSE 100 teased traders with a break above 7,400 but it was not to be, seeing the index close at 7373.20 by Friday’s close. This means it remains within the 7000 – 7450 range it has calved out since August. Ultimately, we’d need Santa’s rally to kick into gear this week if there’s hope of a breakout at all.
- Construction and building materials sector remains the strongest YTD, and currently trades at its highest level since May 2018. Electronic and Electrical Equipment, General Retailers and General Financials are close behind and trade just off their highs.
- The Oil & Gas Index is on track for the weakest sector this year, currently down -9.4% YTD.
The following stocks, if not from the list above, have been selected due to displaying price action characteristics of interest.
Aveva Group plc CFD/DFT: This stock continues to show up on our watchlist as it continues to push to new highs. Friday’s bullish engulfing candle suggests a swing low could be in after forming a small flag pattern. However, unlike some equities on Friday, its bullish close was not so extreme that it looks immediately over extended and therefore due some mean reversion. Traders can either seek a break above 4600 or wait to see if a base builds above the 4310 – 4354 region.
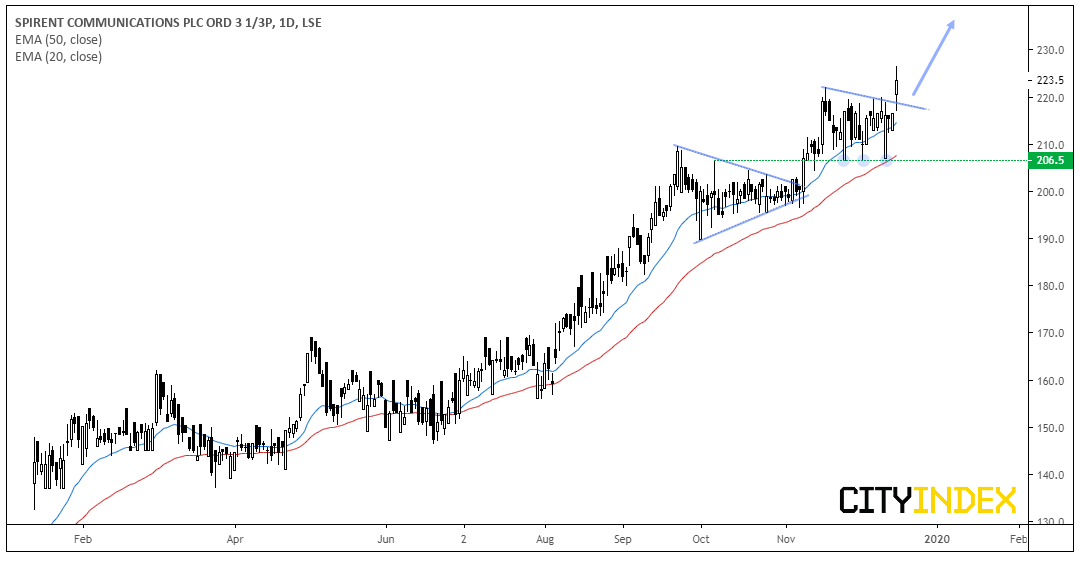
Spirent Communications PLC CFD/DFT: Closing the week at its highest level since 2001 on Friday, we see further upside potential. With three failed attempts to break below 206.50, there’s clearly demand around that level so we remain bullish whilst prices trade above it. We can see that patience would be required here as price action tends to alternative between bullish and bearish frequently, yet the trend is clearly pointing higher.
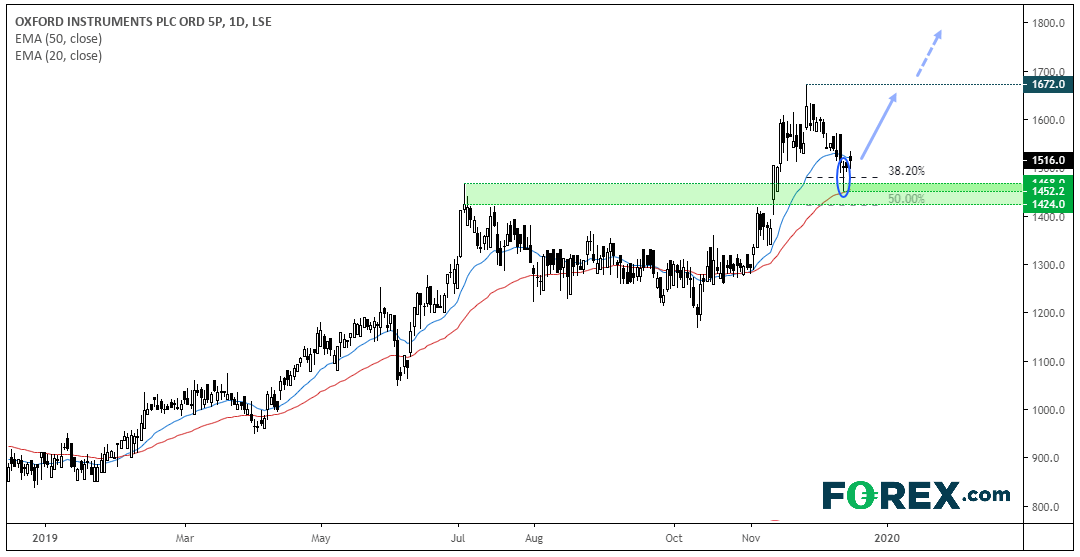
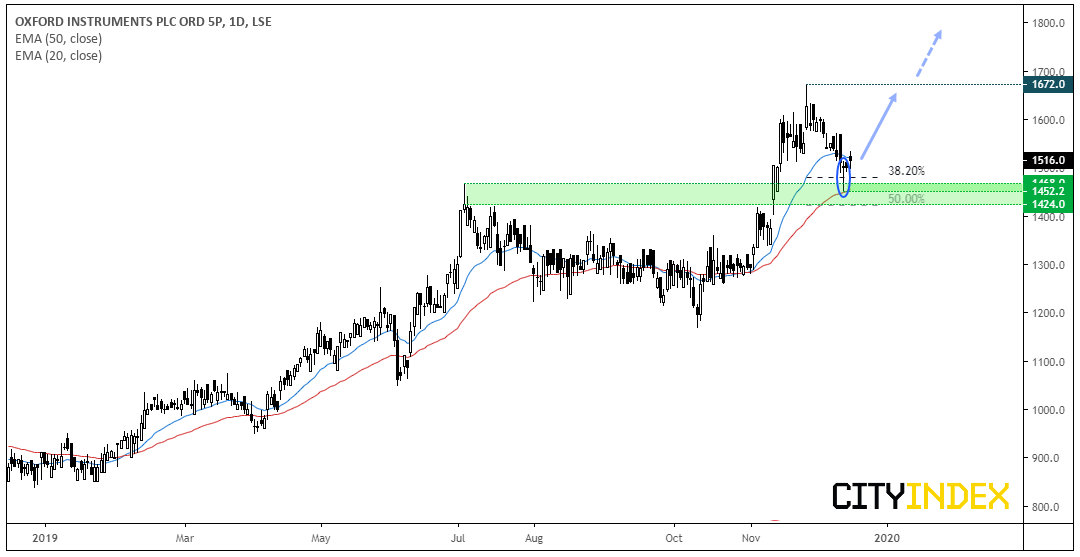
Oxford Instruments CFD/DFT: Since hitting a 5.5 year high, we’ve seen a retracement test (yet close above) the 38.2% Fibonacci level with a bullish pinbar. Moreover, the 50-day eMA is acting as support and it’s in the vicinity of the June highs. We therefor suspect the corrective low is in. Bulls could wait for a break of a corrective line or Friday’s high to assume bullish resumption and for a retest of the 1672 high. A close below 1424 places it onto the backburner.
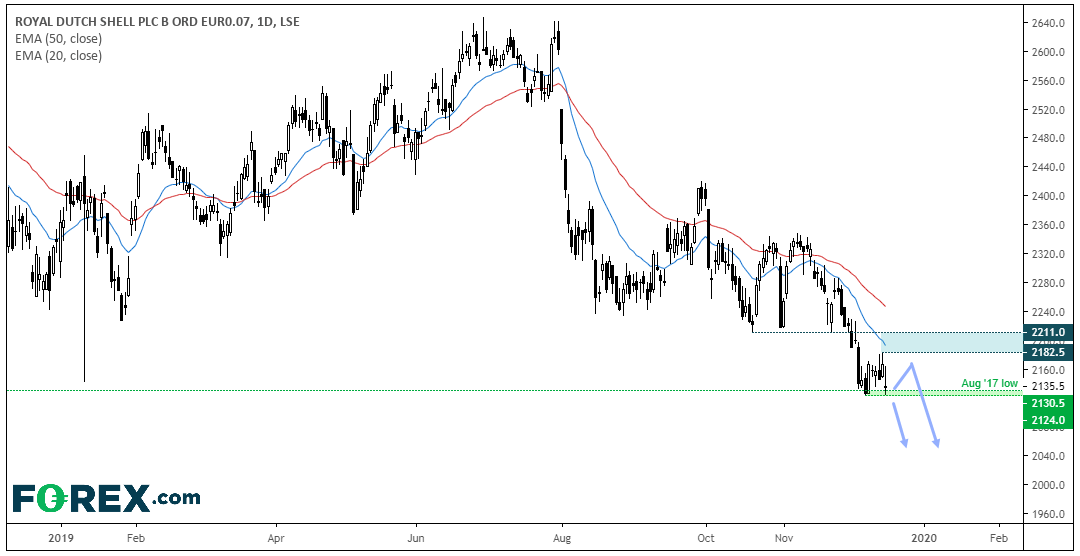
Royal Dutch Shell A CFD/DFT: Prices are on the cup of breaking to new lows. However, as we saw a heavy volume day respect support, it leaves room for a bounce prior to its next breakdown. Bias remains bearish below the 2182.50 high. Whilst a break above this key level doesn’t mean it won’t break to new lows later, it does place it onto the backburner. Whereas a direct break below 2124 assumes bearish continuation.

- FTSE 100 teased traders with a break above 7,400 but it was not to be, seeing the index close at 7373.20 by Friday’s close. This means it remains within the 7000 – 7450 range it has calved out since August. Ultimately, we’d need Santa’s rally to kick into gear this week if there’s hope of a breakout at all.
- Construction and building materials sector remains the strongest YTD, and currently trades at its highest level since May 2018. Electronic and Electrical Equipment, General Retailers and General Financials are close behind and trade just off their highs.
- The Oil & Gas Index is on track for the weakest sector this year, currently down -9.4% YTD.
The following stocks, if not from the list above, have been selected due to displaying price action characteristics of interest.
Aveva Group plc CFD/DFT: This stock continues to show up on our watchlist as it continues to push to new highs. Friday’s bullish engulfing candle suggests a swing low could be in after forming a small flag pattern. However, unlike some equities on Friday, its bullish close was not so extreme that it looks immediately over extended and therefore due some mean reversion. Traders can either seek a break above 4600 or wait to see if a base builds above the 4310 – 4354 region.
Spirent Communications PLC CFD/DFT: Closing the week at its highest level since 2001 on Friday, we see further upside potential. With three failed attempts to break below 206.50, there’s clearly demand around that level so we remain bullish whilst prices trade above it. We can see that patience would be required here as price action tends to alternative between bullish and bearish frequently, yet the trend is clearly pointing higher.
Oxford Instruments CFD/DFT: Since hitting a 5.5 year high, we’ve seen a retracement test (yet close above) the 38.2% Fibonacci level with a bullish pinbar. Moreover, the 50-day eMA is acting as support and it’s in the vicinity of the June highs. We therefor suspect the corrective low is in. Bulls could wait for a break of a corrective line or Friday’s high to assume bullish resumption and for a retest of the 1672 high. A close below 1424 places it onto the backburner.
Royal Dutch Shell A CFD/DFT: Prices are on the cup of breaking to new lows. However, as we saw a heavy volume day respect support, it leaves room for a bounce prior to its next breakdown. Bias remains bearish below the 2182.50 high. Whilst a break above this key level doesn’t mean it won’t break to new lows later, it does place it onto the backburner. Whereas a direct break below 2124 assumes bearish continuation.



Open an account in minutes
Experience award-winning platforms with fast and secure execution, and enjoy tight spreads from 0.5 pts on FX and 0.3 pts on indices.
Economic calendar
Web Trader platform
Our sophisticated web-based platform is packed with features.
Related articles

S&P 500 Forecast: SPX Continues to Drift Away from Record Highs
Recent trading sessions have done little to restore confidence in the equity market. Over the last four sessions, the S&P 500 has declined by nearly 1.00%, a move that highlights growing short-term weakness and keeps the index moving further away from its record-high territory.


RBA delivers 25bp hike, Bullock now the main event
The RBA delivered the expected 25bp hike, but Bullock’s press conference now looms as the bigger volatility risk for AUD/USD and the ASX 200.

S&P 500 forecast: Stocks extend drop as correction risks grow
US and global equity markets have extended Wednesday’s sell-off, with Wall Street opening lower after a weak handover from Asia and Europe. The deterioration in risk appetite has been spreading across global markets. The dollar was firmer, Treasury yields were holding onto yesterday’s gains, while gold, silver and bitcoin were all under pressure alongside equities and major currencies.

This report is intended for general circulation only. It should not be construed as a recommendation, or an offer (or solicitation of an offer) to buy or sell any financial products. The information provided does not take into account your specific investment objectives, financial situation or particular needs. Before you act on any recommendation that may be contained in this report, independent advice ought to be sought from a financial adviser regarding the suitability of the investment product, taking into account your specific investment objectives, financial situation or particular needs.
StoneX Financial Pte. Ltd., may distribute reports produced by its respective foreign entities or affiliates within the StoneX group of companies or third parties pursuant to an arrangement under Regulation 32C of the Financial Advisers Regulations. Where the report is distributed to a person in Singapore who is not an accredited investor, expert investor or an institutional investor (as defined in the Securities Futures Act), StoneX Financial Pte. Ltd. accepts legal responsibility to such persons for the contents of the report only to the extent required by law. Singapore recipients should contact StoneX Financial Pte. Ltd. at 6826 9988 for matters arising from, or in connection with the report.
In the case of all other recipients of this report, to the extent permitted by applicable laws and regulations neither StoneX Financial Pte. Ltd. nor its associated companies will be responsible or liable for any loss or damage incurred arising out of, or in connection with, any use of the information contained in this report and all such liability is hereby expressly disclaimed. No representation or warranty is made, express or implied, that the content of this report is complete or accurate.
StoneX Financial Pte. Ltd. is not under any obligation to update this report.
Trading CFDs carries a high level of risk that may not be suitable for some investors. Consider your investment objectives, level of experience, financial resources, risk appetite and other relevant circumstances carefully. The possibility exists that you could lose some or all of your investments, including your initial deposits. If in doubt, please seek independent expert advice. Visit www.forex.com/en-sg/terms-and-policies for the complete Risk Disclosure Statement.