





Gold Analysis: Bullish Bias Remains Firm in XAU/USD Above $3,000
The last two trading sessions in XAU/USD have confirmed a bullish bias, with gains exceeding 2% above the $3,000 per troy ounce level. This movement has strengthened the short-term bullish outlook for the safe-haven asset.
Share this:

The last two trading sessions in XAU/USD have confirmed a bullish bias, with gains exceeding 2% above the $3,000 per troy ounce level. This movement has strengthened the short-term bullish outlook for the safe-haven asset. The rally has been largely supported by recent comments from the White House regarding new additional tariffs, which have fueled persistent global economic uncertainty, giving gold a renewed opportunity to recover. As this uncertainty continues, upward pressure on gold could become even more relevant.
New Tariff Threats Come into Play
Since the onset of this new phase of trade tensions, gold has benefited from its role as a safe-haven asset, attracting capital from investors seeking protection amid a deteriorating market mood. This dynamic has recently propelled the metal to the symbolic $3,000 per ounce level, a historical high.
Now, comments from President Trump suggesting the imposition of a 25% tariff on imported cars and auto parts have reignited fears over global economic growth. As a result, risk assets have come under pressure, while safe-haven assets such as gold have capitalized on the moment, maintaining strong buying momentum.
The White House has indicated April 2 as the tentative date for these tariffs to take effect. Meanwhile, the European Union has stated it is working on a strategy to delay implementation, and other affected countries are preparing retaliatory measures. If these actions materialize, the situation could escalate into a full-scale trade war, far beyond the current war of words. Such scenarios must be taken seriously, as they may trigger greater fear in financial markets, further boosting demand for gold.
How Is Overall Market Sentiment Doing?
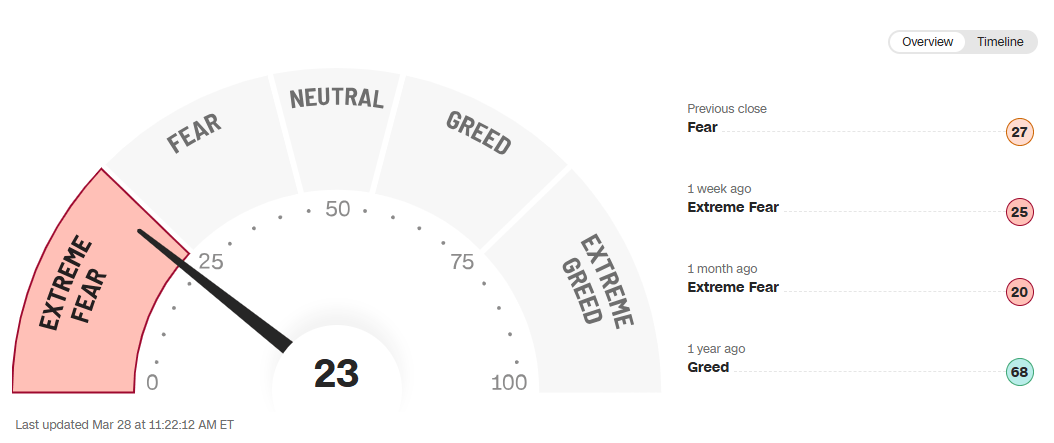
The CNN Fear & Greed Index currently sits at 23, deep in the “extreme fear” zone. This reading reflects the persistent distrust in the markets, primarily driven by the ongoing trade tensions initiated by the White House.
Source: CNN
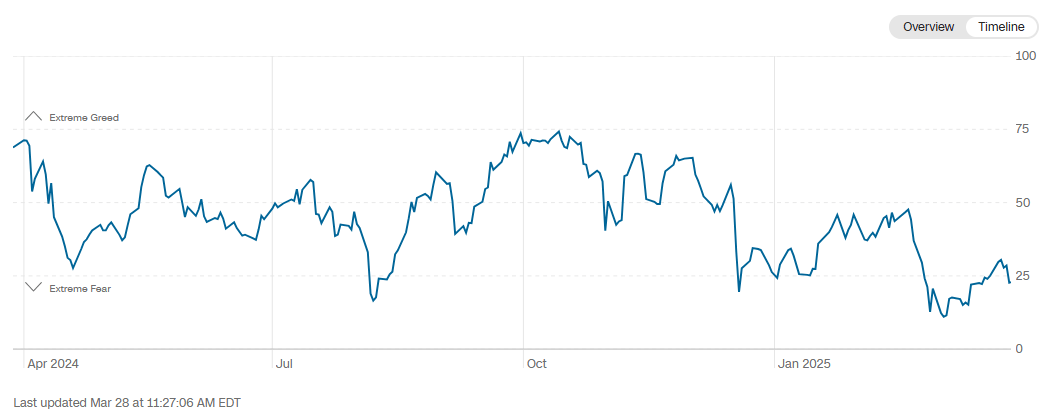
Since October 2024, the index has followed a clear downward trend, falling from levels of 71 (greed zone) to its current position. This prolonged decline shows the market has struggled to recover from a state of risk aversion, with no significant rebound in confidence observed so far.
Source: CNN
Considering this backdrop, it’s evident that loss of confidence has been a defining factor in recent months. It remains steady, mainly due to the persistent presence of international economic conflict. Unless the situation changes, gold (the most popular safe-haven asset) is likely to continue attracting capital from investors looking to avoid riskier assets. If this trend continues, buying pressure on XAU/USD could become even more important over the long term.
Technical Outlook for Gold
Source: StoneX, Tradingview
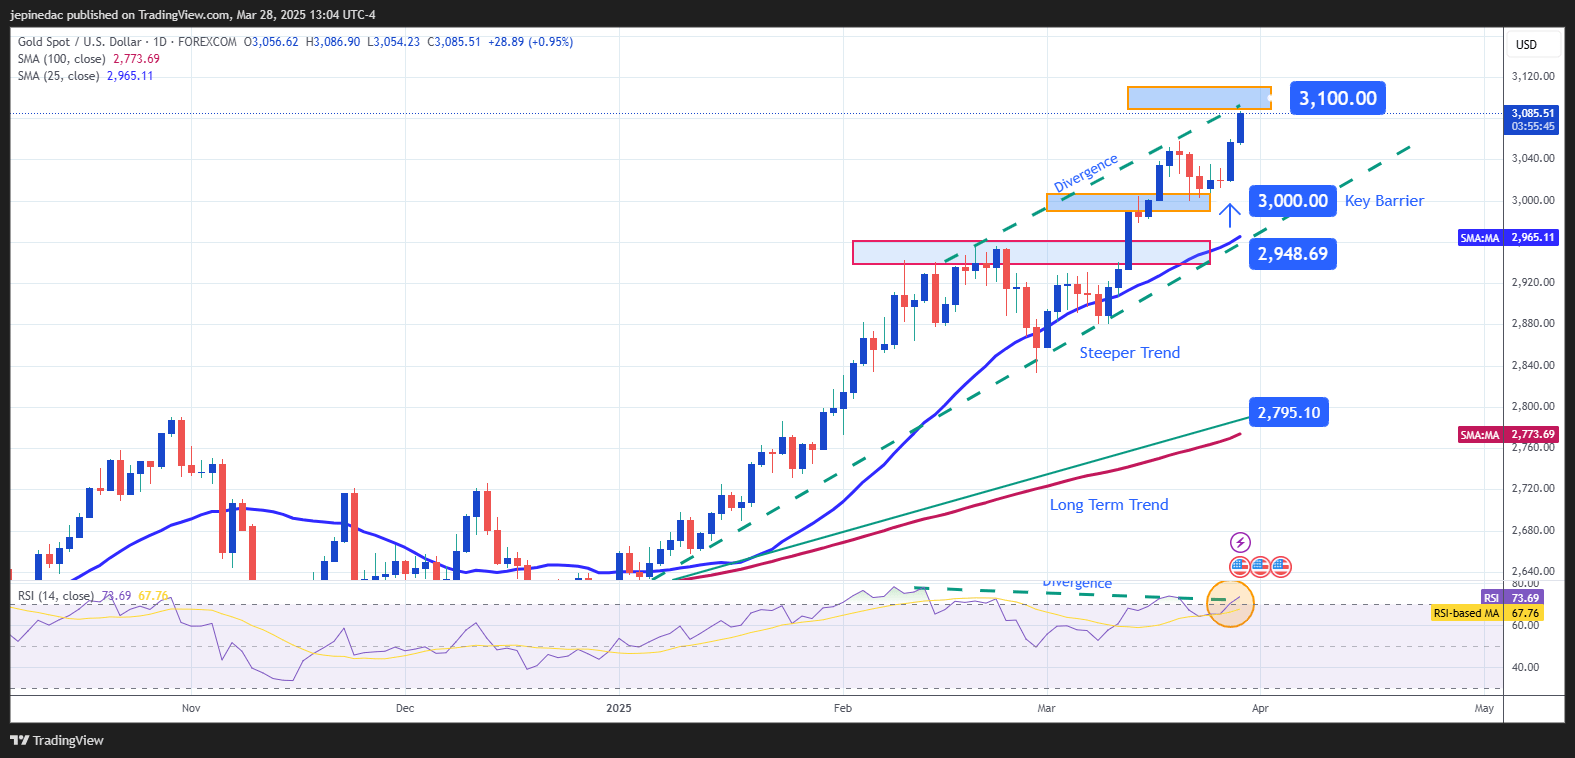
- Bullish Trend: The gold market has maintained a steady upward trend in recent months, and since early 2025, this move has steepened, breaking through the psychological barrier of $3,000 per ounce. The latest bullish push came close to reaching $3,100, and while the recent pace has been strong, it may lead to a technical pause. For now, the bullish structure remains the dominant formation on the chart.
- RSI: The Relative Strength Index (RSI) is hovering above the overbought level of 70, and a bearish divergence has started to form: while price action is making higher highs, the RSI is showing lower highs. This pattern may signal an imbalance caused by excessive bullish momentum, potentially triggering a downward correction in upcoming sessions.
Key Levels to Watch:
- $3,100 – Tentative resistance: This round number represents the next short-term resistance level. A sustained breakout above this area could reinforce the current bullish momentum.
- $3,000 – Key support: This is the most relevant short-term level, where any potential pullbacks may temporarily stabilize.
- $2,950 – Distant support: This level aligns with the current bullish trendline and the 25-period simple moving average. A break below this area could put the bullish structure at risk and give way to a stronger bearish bias.
Written by Julian Pineda, CFA – Market Analyst



Open an account in minutes
Experience award-winning platforms with fast and secure execution, and enjoy tight spreads from 0.5 pts on FX and 0.3 pts on indices.
Economic calendar
Web Trader platform
Our sophisticated web-based platform is packed with features.
Related articles

Gold Price Forecast: XAU/USD Plunges 12.4% Toward Critical Support 10 1 2026
Softer inflation has revived expectations for a Fed pause, but Friday’s payrolls could put gold’s recovery prospects to the test.


Gold Price Outlook: XAU/USD Resistance at $4200 Sets Up for NFP
It was a strong sell-off to start the week in gold and despite a Tuesday bounce, sellers are continuing to push following a resistance hit at the $4200 level.


Gold Forecast: Are Bears Regaining Control of XAU/USD?
The start of the trading week has not been particularly favorable for gold. This can be seen in recent XAU/USD price action, with the metal falling nearly 4.00% over the last two trading sessions and bringing renewed attention to a bearish bias within the market.
This report is intended for general circulation only. It should not be construed as a recommendation, or an offer (or solicitation of an offer) to buy or sell any financial products. The information provided does not take into account your specific investment objectives, financial situation or particular needs. Before you act on any recommendation that may be contained in this report, independent advice ought to be sought from a financial adviser regarding the suitability of the investment product, taking into account your specific investment objectives, financial situation or particular needs.
StoneX Financial Pte. Ltd., may distribute reports produced by its respective foreign entities or affiliates within the StoneX group of companies or third parties pursuant to an arrangement under Regulation 32C of the Financial Advisers Regulations. Where the report is distributed to a person in Singapore who is not an accredited investor, expert investor or an institutional investor (as defined in the Securities Futures Act), StoneX Financial Pte. Ltd. accepts legal responsibility to such persons for the contents of the report only to the extent required by law. Singapore recipients should contact StoneX Financial Pte. Ltd. at 6826 9988 for matters arising from, or in connection with the report.
In the case of all other recipients of this report, to the extent permitted by applicable laws and regulations neither StoneX Financial Pte. Ltd. nor its associated companies will be responsible or liable for any loss or damage incurred arising out of, or in connection with, any use of the information contained in this report and all such liability is hereby expressly disclaimed. No representation or warranty is made, express or implied, that the content of this report is complete or accurate.
StoneX Financial Pte. Ltd. is not under any obligation to update this report.
Trading CFDs carries a high level of risk that may not be suitable for some investors. Consider your investment objectives, level of experience, financial resources, risk appetite and other relevant circumstances carefully. The possibility exists that you could lose some or all of your investments, including your initial deposits. If in doubt, please seek independent expert advice. Visit www.forex.com/en-sg/terms-and-policies for the complete Risk Disclosure Statement.