



Gold and Silver Forecast: Are Precious Metals Near a Major Turning Point?
Gold and Silver Forecast: Gold and silver continue to trade within technically vulnerable zones, keeping the risk of another leg lower alive before a longer-term accumulation opportunity emerges—unless key resistance levels are reclaimed
Share this:

Gold and silver continue to trade within technically vulnerable zones, keeping the risk of another leg lower alive before a longer-term accumulation opportunity emerges—unless key resistance levels are reclaimed.
Key Market Developments
- Gold continues to hold above 3,930, while daily momentum remains below the neutral threshold.
- Silver remains above 55, although daily momentum also stays below neutral.
- The US Dollar Index (DXY) continues to trade above the critical 100.20–100.60 support zone, with daily momentum remaining constructive.
Together, these conditions suggest that further confirmation is still needed before a sustainable bullish reversal can develop in precious metals.
At the same time, they reinforce the broader strength of the US dollar against major currencies and metals, supported by:
- Markets continuing to price a meaningful probability of another Fed rate hike later this year, with Fed funds futures still implying over a 50% probability of tighter policy during Q4 2026.
- Federal Reserve Chair Kevin Warsh's emphasis on returning inflation to the 2% target while balancing labour market and growth risks.
- Seasonal liquidity rebalancing heading into the summer months, increasing the potential for volatility.
- In May 2026, Indian Prime Minister Narendra Modi publicly encouraged households to postpone non-essential gold purchases for roughly one year amid elevated oil prices, pressure on foreign exchange reserves, and rupee weakness. As India remains one of the world's largest consumers of physical gold, this may have contributed to softer sentiment toward precious metals since March 2026.
CME FedWatch Tool
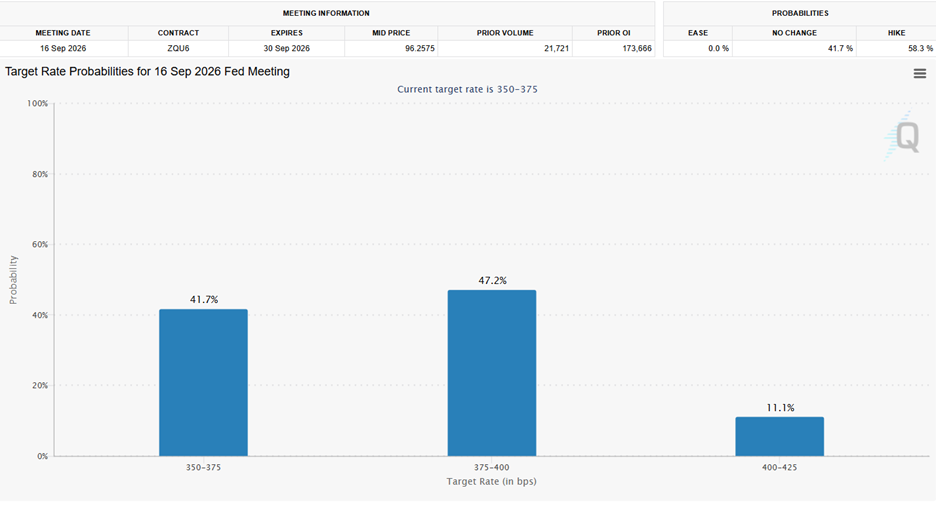
Source: CME
Long-Term Bullish Case Remains Intact
Despite current headwinds, the structural outlook for precious metals remains constructive.
Central banks continue increasing their allocation to gold as part of reserve diversification, while growing industrial demand—particularly for silver through technology, electronics and the energy transition—continues to provide long-term support.
Consequently, the current correction may ultimately evolve into either:
- another opportunity to participate in the broader secular bull market, or
- an attractive long-term dip-buying opportunity.
You can follow this analysis live during the daily MENA Market Call
Key Technical Scenarios
Gold Price Forecast: Multi-Timeframe Technical Confluence
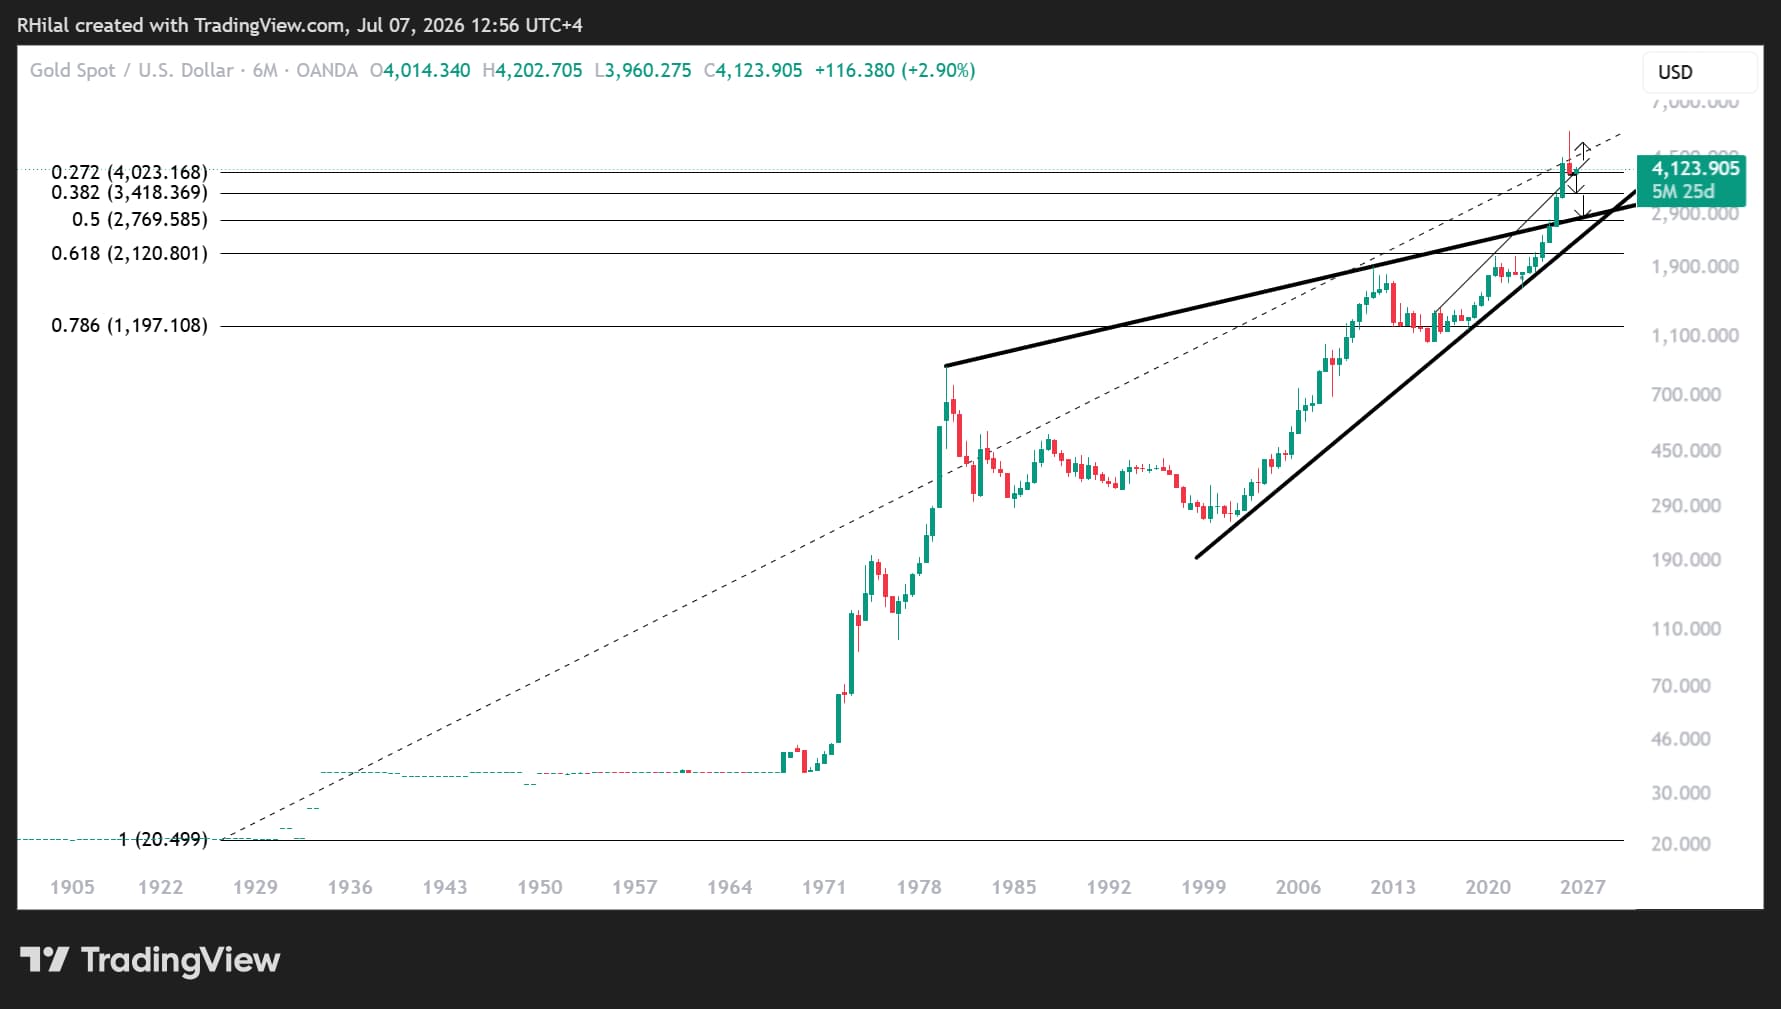
6-Month Time Frame (Log Scale)
Source: TradingView
Key observations
Gold is testing the 27.2% Fibonacci retracement of the secular advance between 1920 and 2026.
This represents one of the most important technical levels on the long-term chart.
A confirmed close below 4,020-3930 would expose the next major Fibonacci support zones:
- 3,500–3,400
- 38.2% Fibonacci retracement
- Former five-month resistance throughout 2025
- 2,800–2,700
- Upper boundary of the 1980–2024 consolidation
- 50% Fibonacci retracement
On the upside, sustained trading above: 4,020 - 4,180 -4,370–4,400 would reinforce confidence towards the long-term bullish continuation scenario, breaking above the descending resistance since March 2026.
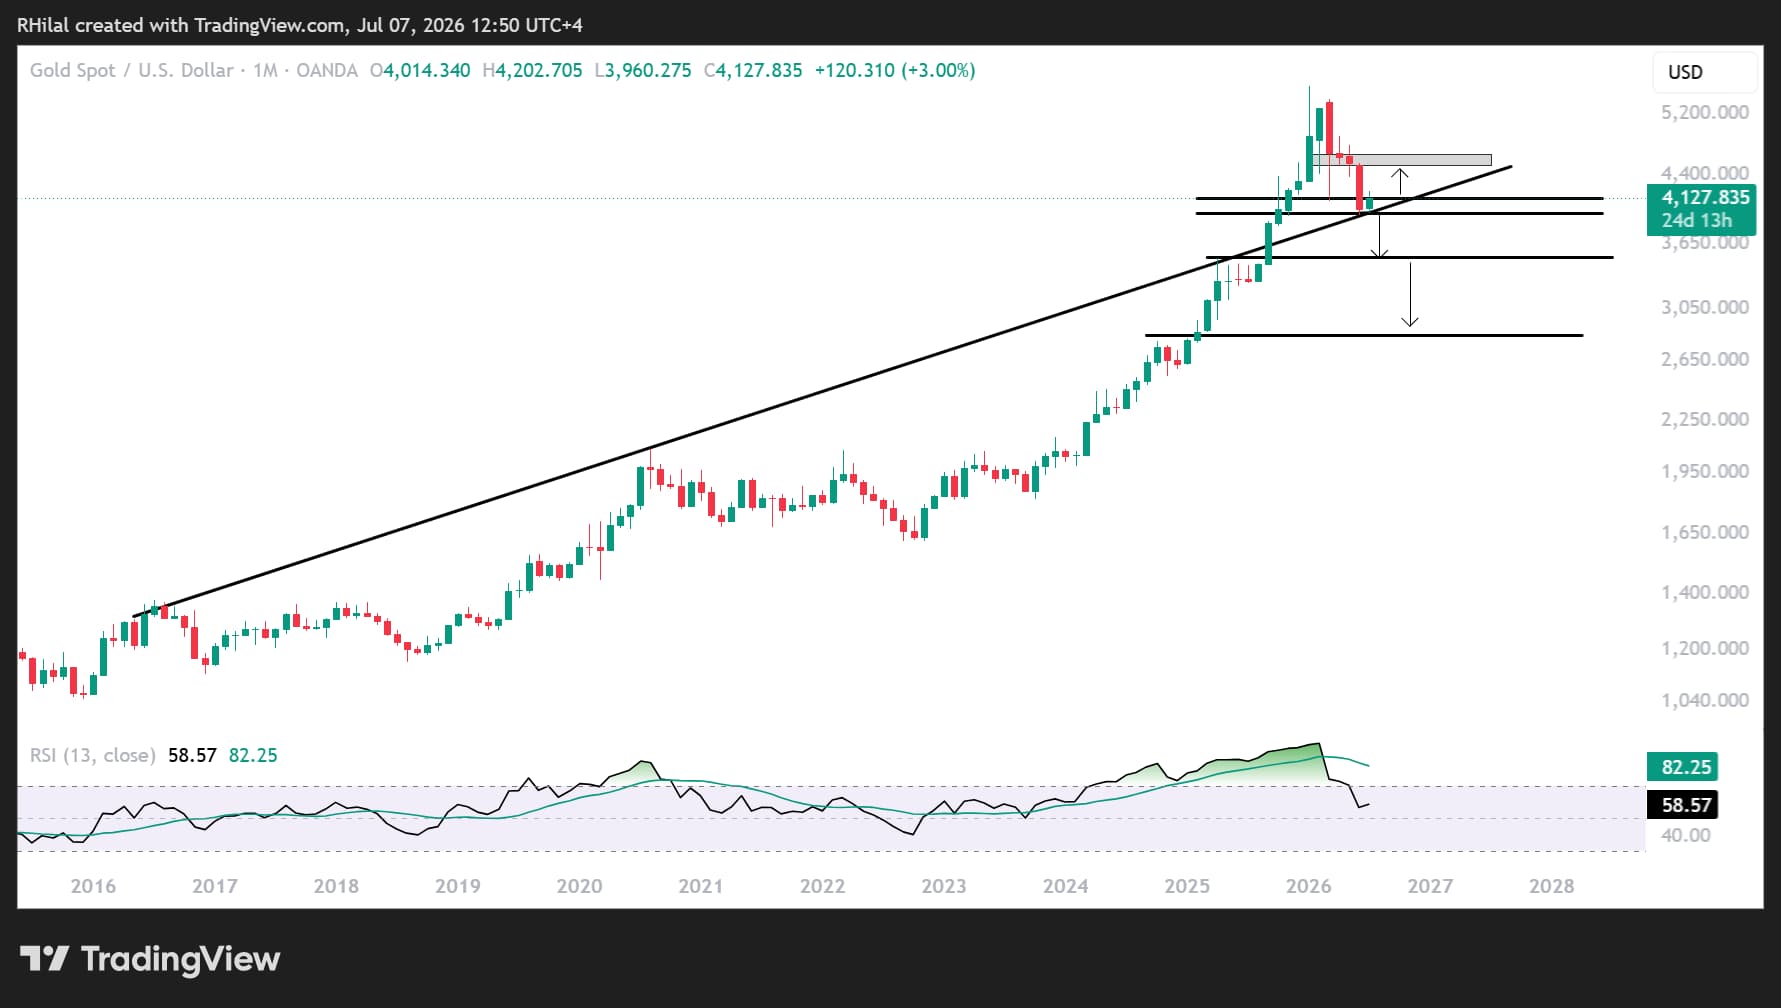
Monthly Time Frame (Log Scale)
Source: TradingView
Key observations
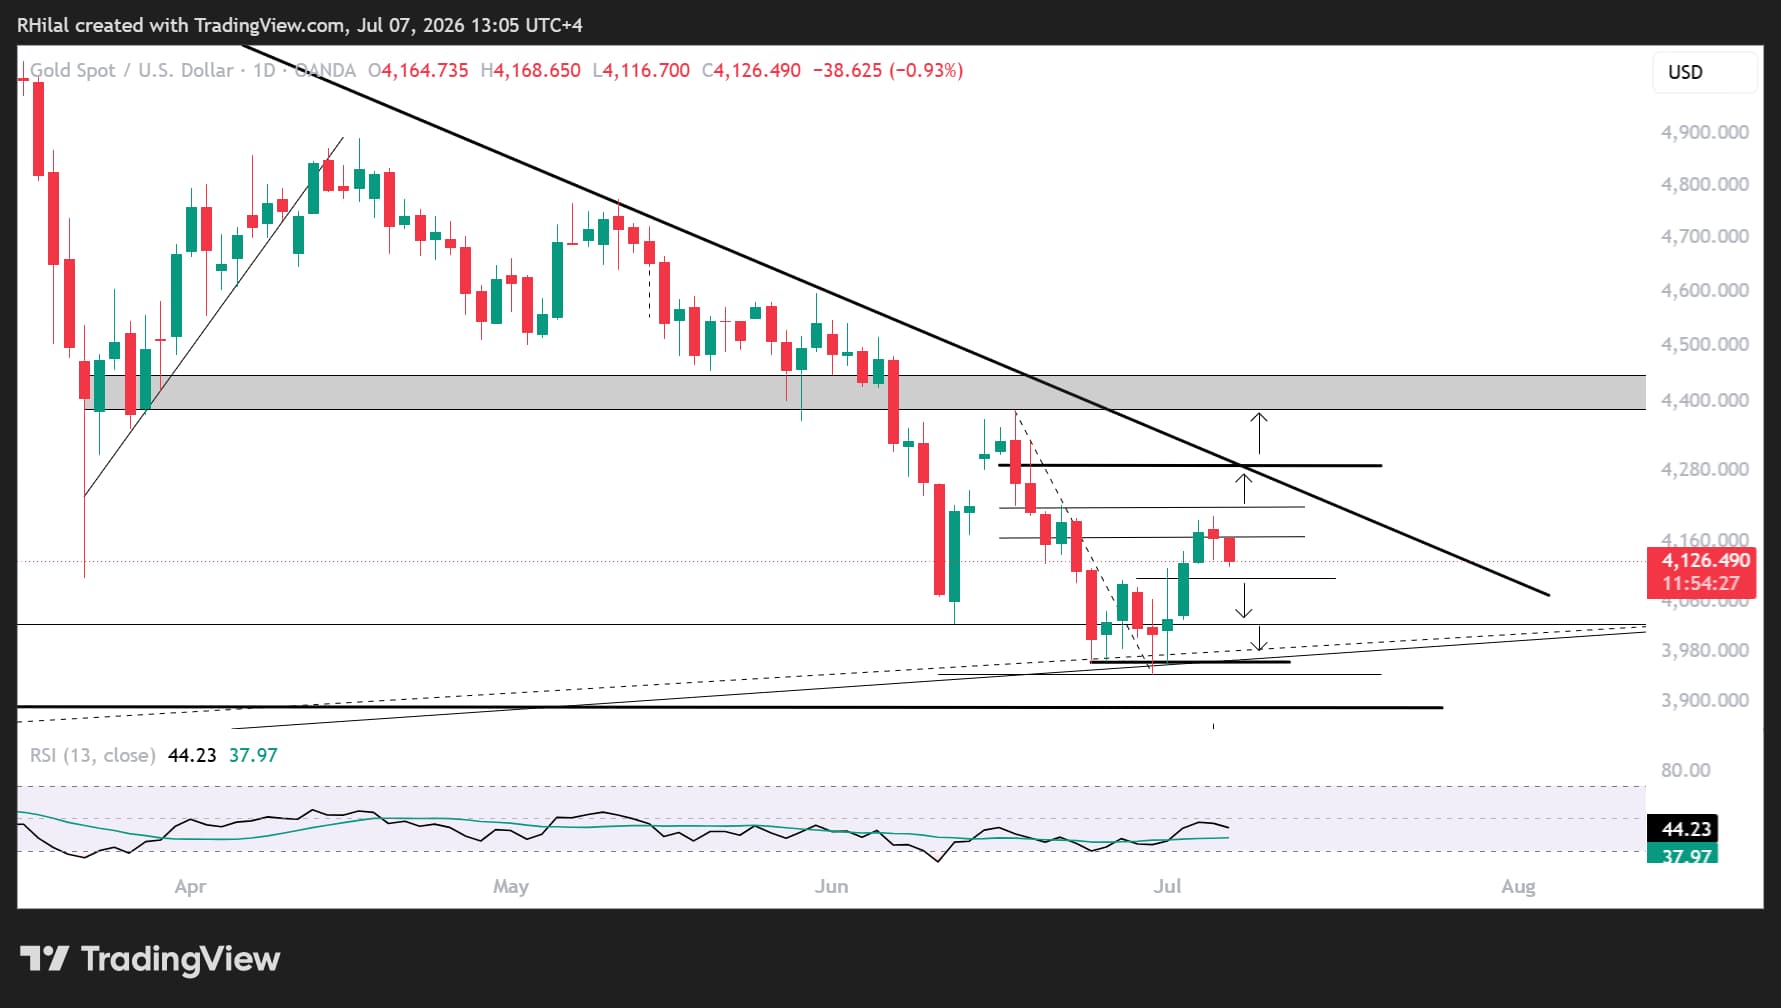
Gold continues attempting to rebound from the long-term trendline connecting successive highs since 2016, while 3,930 remains a critical support level.
This creates another layer of technical confluence with the long-term 27.2% Fibonacci retracement.
A decisive monthly break below this trendline would strengthen the case for a heavy move toward the previously identified support zones.
However, the 3,460–3,500 area stands out as a high-probability zone for renewed buying interest before considering any broader bearish extension.
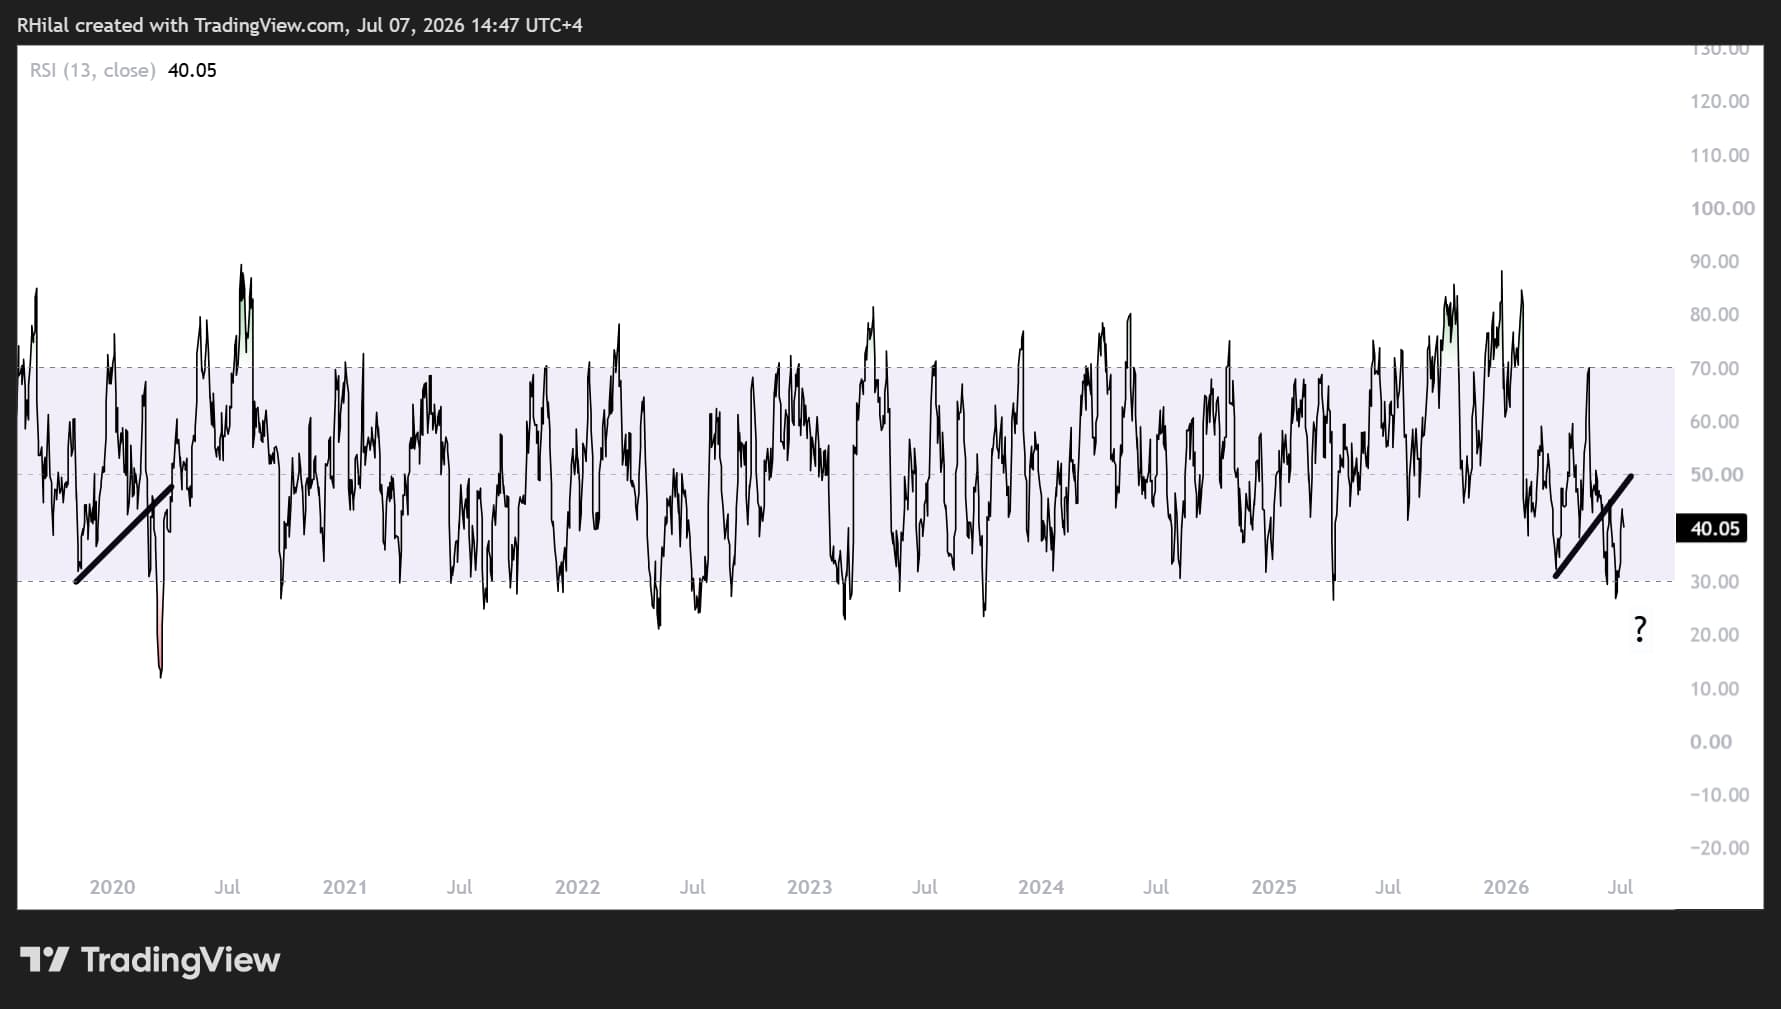
Importantly, monthly momentum continues to hold above the neutral threshold, suggesting the secular uptrend has not yet been invalidated, even though daily momentum remains below the neutral mark.
Daily Time Frame (Log Scale)
Source: TradingView
Near-term outlook
Gold's rebound from 3,930 toward 4,180 continues to be capped by the descending trendline that has guided prices lower since March 2026.
Should selling pressure intensify below:
- 4,090
- 4,020
- 3,930
the next downside objectives become:
- 3,880–3,810 (October 2025 lows) - short term
- 3,650 - short term
- 3,500–3,400 - long term
Conversely, a sustained breakout above the descending trendline, 4370-4400, would provide the first meaningful confirmation that a bullish reversal is underway.
Silver Price Forecast: Daily Time Frame (Log Scale)
Source: TradingView
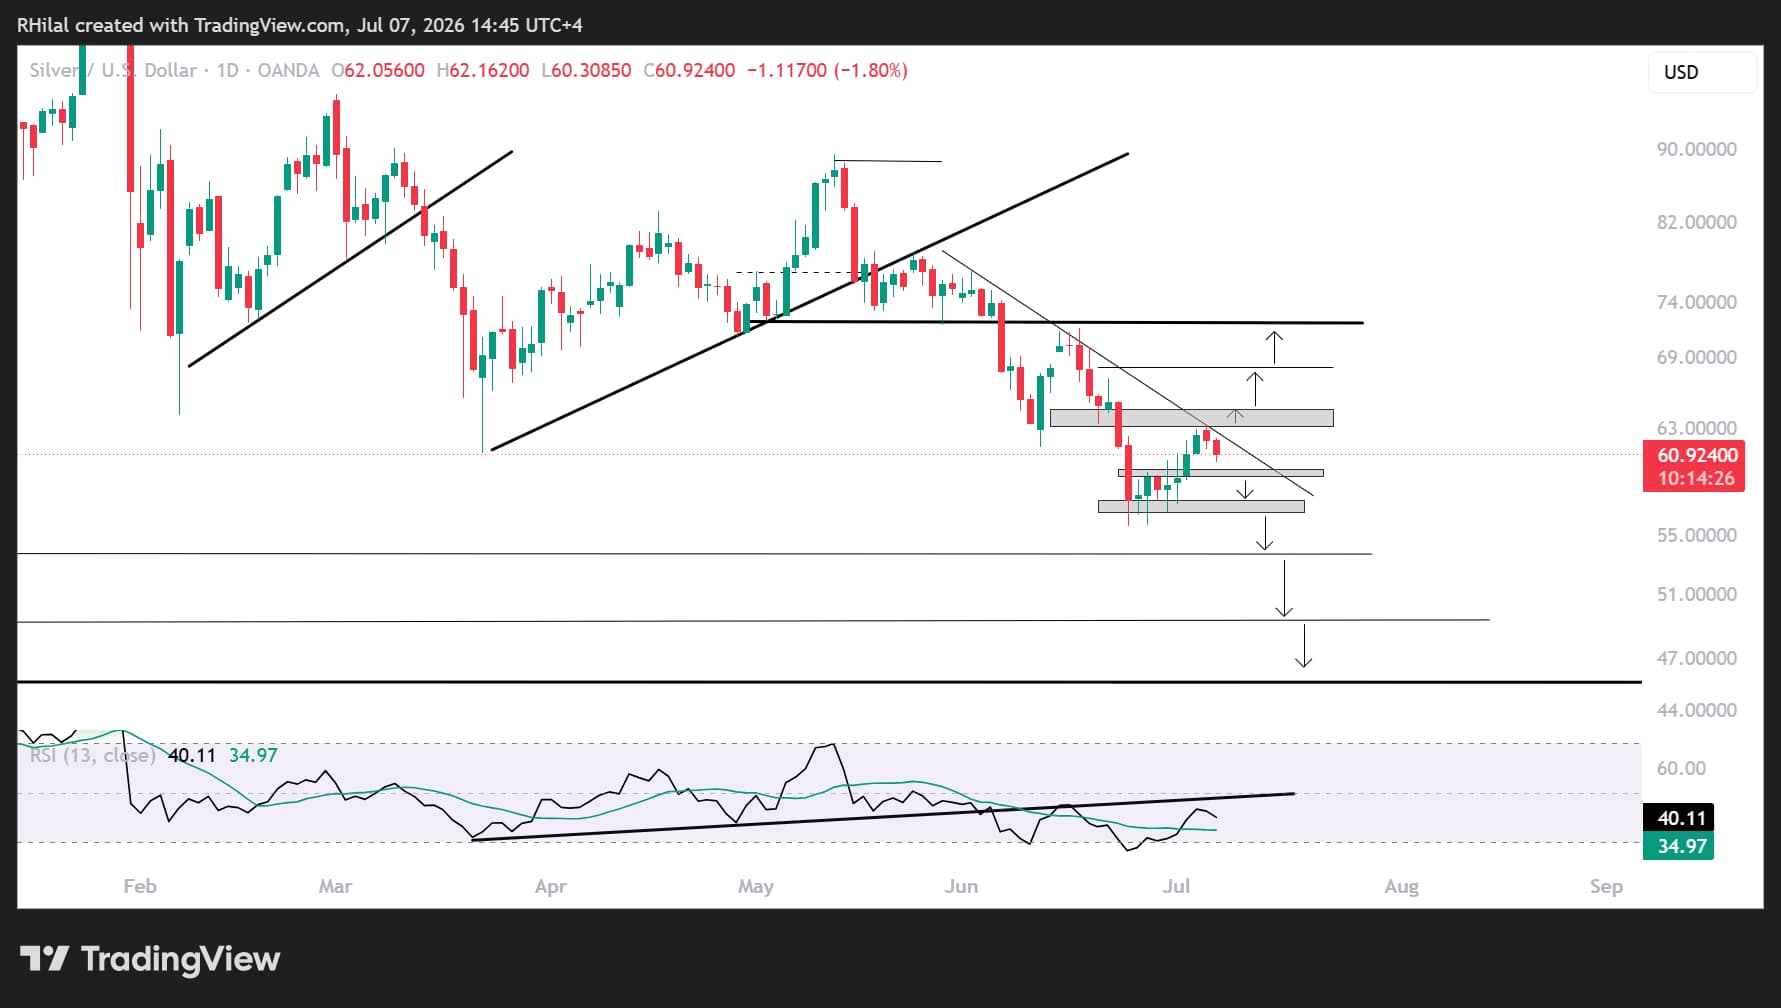
Silver remains under pressure around the important 60 psychological level.
Prices continue trading beneath the descending trendline that has been in place since May 2026, while daily momentum remains below the neckline of the developed head-and-shoulders pattern.
Together, these factors keep downside risks elevated while highlighting the need for additional bullish confirmation before confidence in a sustained recovery can increase.
Should silver break back below 59, the following downside targets become relevant:
- 56 - short term
- 53.80 - short term
- 50 - long term
- 46 - long term
The broader 55–45 region represents a major long-term technical support area, aligning with:
- Former resistance from the 1980–2024 consolidation.
- The 61.8% Fibonacci retracement of the secular advance between 1920 and 2026.
On the upside, silver would need to reclaim: 64.60 - 68.00 - 72.00 before the broader technical outlook shifts back toward a constructive bullish bias.
Written by Razan Hilal, CMT
X: @Rh_waves
Latest market news




Open an account in minutes
Experience award-winning platforms with fast and secure execution, and enjoy tight spreads from 0.5 pts on FX and 0.3 pts on indices.
Economic calendar
Web Trader platform
Our sophisticated web-based platform is packed with features.
Related articles
Swiss Franc Short-term Outlook: USD/CHF Selloff Nears Critical Support Ahead of NFP 11 4 2026
USD/CHF bears are closing in on critical trend support, with the next reaction likely to determine whether the October decline has further to run.

US Midterm Fallout: What Does the “Blue Tsunami” Mean for the S&P 500?
Democrats made sweeping gains in the US midterm elections, winning control of both the House and Senate - what does it mean for the S&P 500 and the AI trade?

Euro Technical Outlook: EUR/USD Support Reversal Sets Up Breakout Test Ahead of NFP 11 4 2026
Euro bulls are attempting to build on the rebound from recent lows, but pivotal resistance still stands in the way of a larger EUR/USD recovery.
This report is intended for general circulation only. It should not be construed as a recommendation, or an offer (or solicitation of an offer) to buy or sell any financial products. The information provided does not take into account your specific investment objectives, financial situation or particular needs. Before you act on any recommendation that may be contained in this report, independent advice ought to be sought from a financial adviser regarding the suitability of the investment product, taking into account your specific investment objectives, financial situation or particular needs.
StoneX Financial Pte. Ltd., may distribute reports produced by its respective foreign entities or affiliates within the StoneX group of companies or third parties pursuant to an arrangement under Regulation 32C of the Financial Advisers Regulations. Where the report is distributed to a person in Singapore who is not an accredited investor, expert investor or an institutional investor (as defined in the Securities Futures Act), StoneX Financial Pte. Ltd. accepts legal responsibility to such persons for the contents of the report only to the extent required by law. Singapore recipients should contact StoneX Financial Pte. Ltd. at 6826 9988 for matters arising from, or in connection with the report.
In the case of all other recipients of this report, to the extent permitted by applicable laws and regulations neither StoneX Financial Pte. Ltd. nor its associated companies will be responsible or liable for any loss or damage incurred arising out of, or in connection with, any use of the information contained in this report and all such liability is hereby expressly disclaimed. No representation or warranty is made, express or implied, that the content of this report is complete or accurate.
StoneX Financial Pte. Ltd. is not under any obligation to update this report.
Trading CFDs carries a high level of risk that may not be suitable for some investors. Consider your investment objectives, level of experience, financial resources, risk appetite and other relevant circumstances carefully. The possibility exists that you could lose some or all of your investments, including your initial deposits. If in doubt, please seek independent expert advice. Visit www.forex.com/en-sg/terms-and-policies for the complete Risk Disclosure Statement.