



Gold Forecast: XAU/USD loses strength ahead of the Fed decision
Once again, gold is showing signs of short-term weakness. Over the last 4 trading sessions, XAU/USD has accumulated a decline of nearly -2.4%, highlighting a relevant selling bias ahead of the Federal Reserve decision.
Share this:

Once again, gold is showing signs of short-term weakness. Over the last 4 trading sessions, XAU/USD has accumulated a decline of nearly -2.4%, highlighting a relevant selling bias ahead of the Federal Reserve decision.
For now, selling pressure remains in place as the market waits for a possible more aggressive tone from the U.S. central bank. This expectation has limited gold’s ability to sustain a consistent recovery and could continue to affect the precious metal if the Fed confirms a more restrictive stance for upcoming decisions.


Fed day arrives
During tomorrow’s session, July 29, 2026, the Federal Reserve is expected to announce its decision. According to the latest probability table from CME Group, the market assigns a probability above 70% that the central bank will keep interest rates unchanged, meaning no major surprises are expected in the immediate decision.
However, the most relevant point will be the central bank’s message after the announcement. The market will remain focused on whether the probability of a possible rate hike for the September 16 meeting remains near 56%. The Fed’s comments could help confirm whether a higher interest rate may become part of the U.S. monetary policy outlook over the coming months.
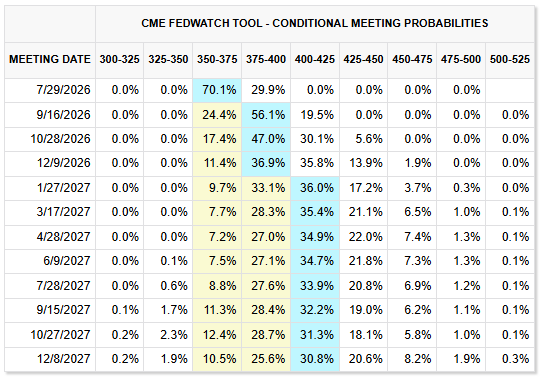
Source: CMEGROUP
Attention will also be on the central bank’s assessment of inflation. This has been one of the main factors leading the market to consider possible rate hikes. As of the June data, annual inflation measured by the CPI stood at 3.5%. Although this reading moved away from the year’s high of 4.2%, it remains above the Fed’s 2.00% target.
For this reason, the central bank could once again highlight inflation as an important risk that may require a more aggressive stance over the next few months. This scenario would not be entirely unexpected, considering that current inflation levels remain far from the official target.
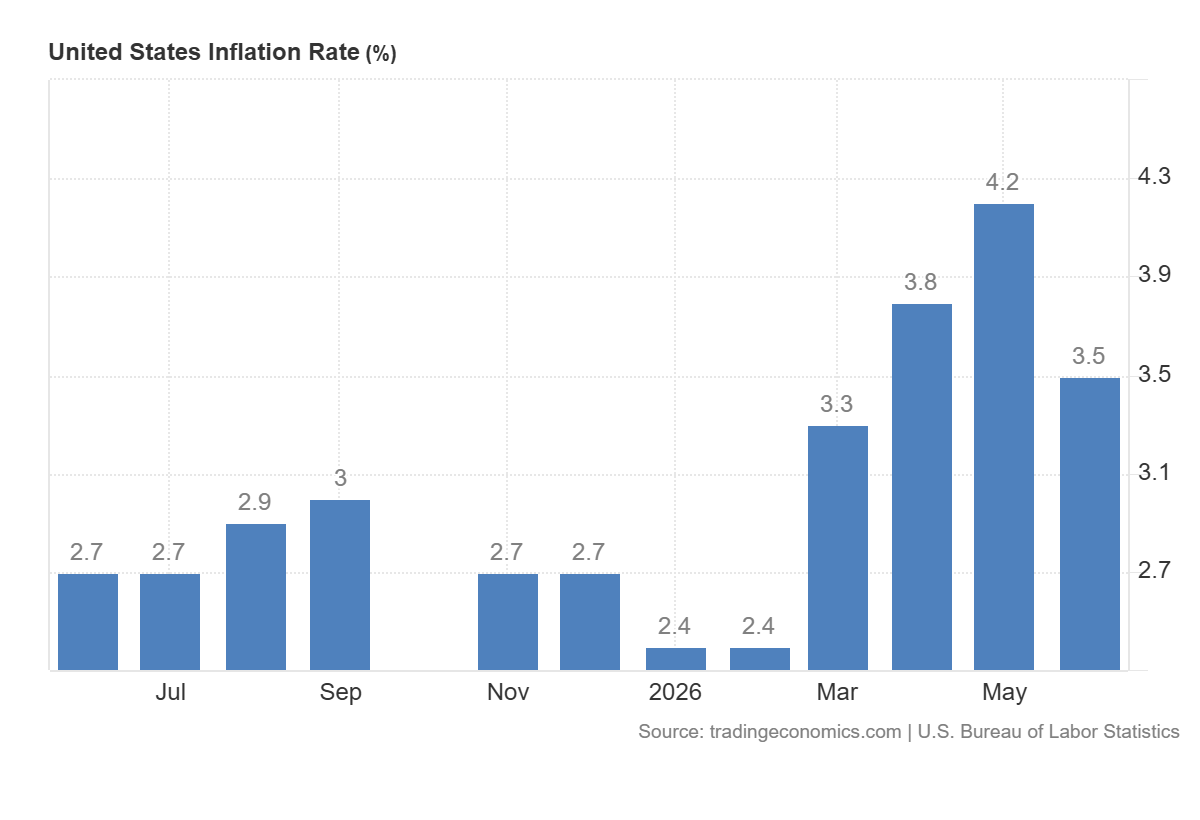
Source: TradingEconomics
In this context, a more aggressive Fed could continue to strengthen the U.S. bond market. In previous sessions, the 10-year Treasury yield reached new 2026 highs, increasing the appeal of one of the most important safe-haven markets.
This dynamic is key for gold, as bonds are positioned as one of its main substitute markets. When yields rise, gold’s relative appeal can decline, especially because the precious metal does not pay interest. This inverse relationship has already been observed in recent sessions: while bond yields maintain an upward slope, gold has shown weakness.
In fact, the correlation coefficient remains near -0.75, reflecting a strong inverse relationship between yield movements and the price of gold.
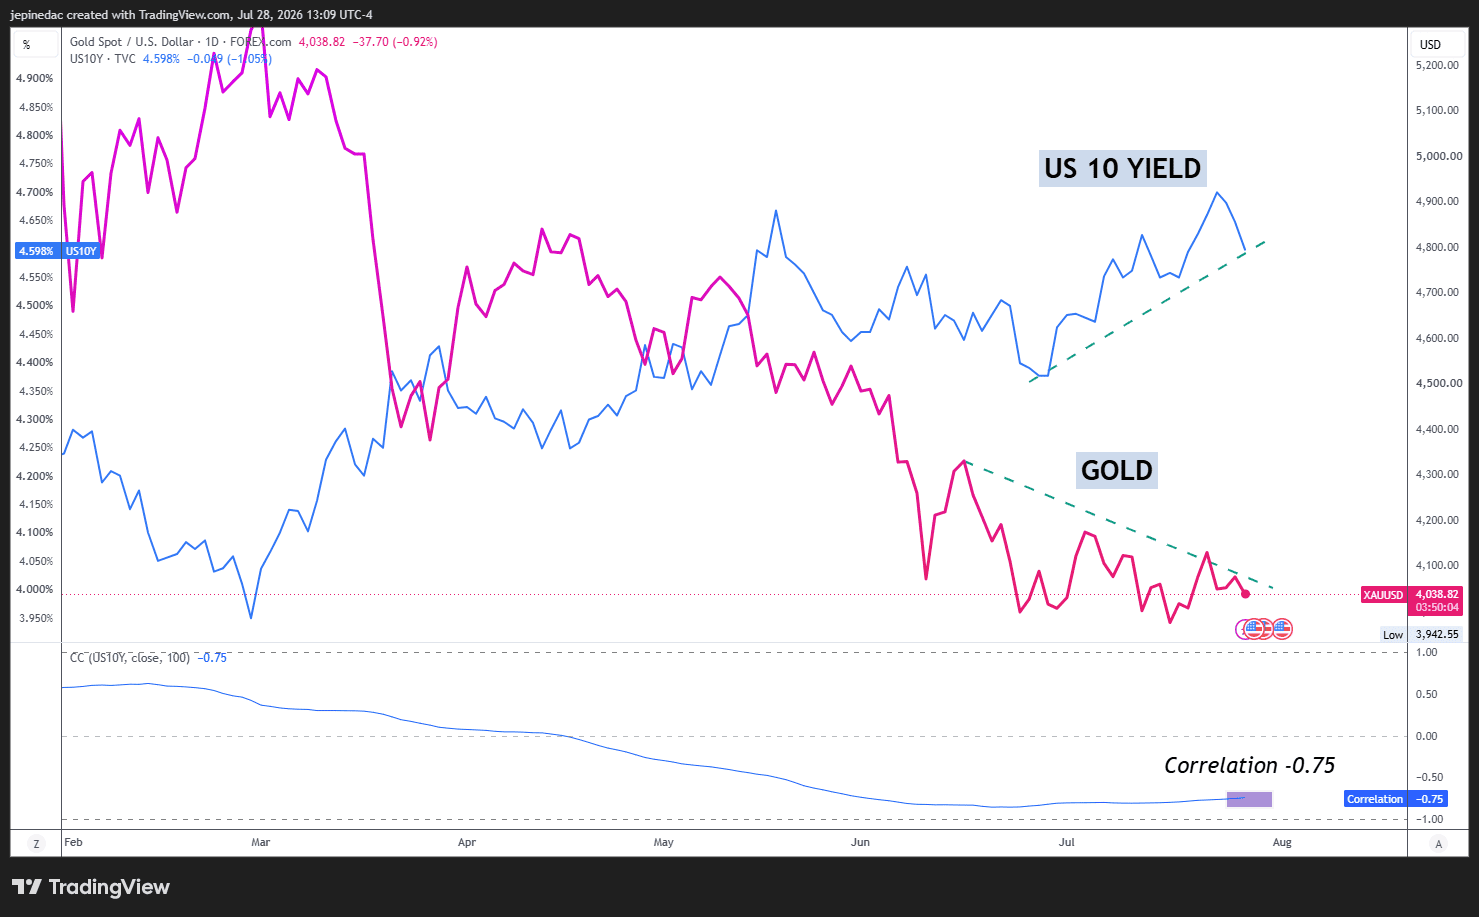
Source: TVC, StoneX, Tradingview
The dynamic continues to depend heavily on the behavior of yields. If the bond market continues to offer more attractive returns, it could keep limiting room for a consistent recovery in gold. In addition, if the Fed reinforces expectations of a more aggressive monetary policy stance, yields could remain strong and limit demand for XAU/USD over the next few trading sessions.
Technical forecast for gold
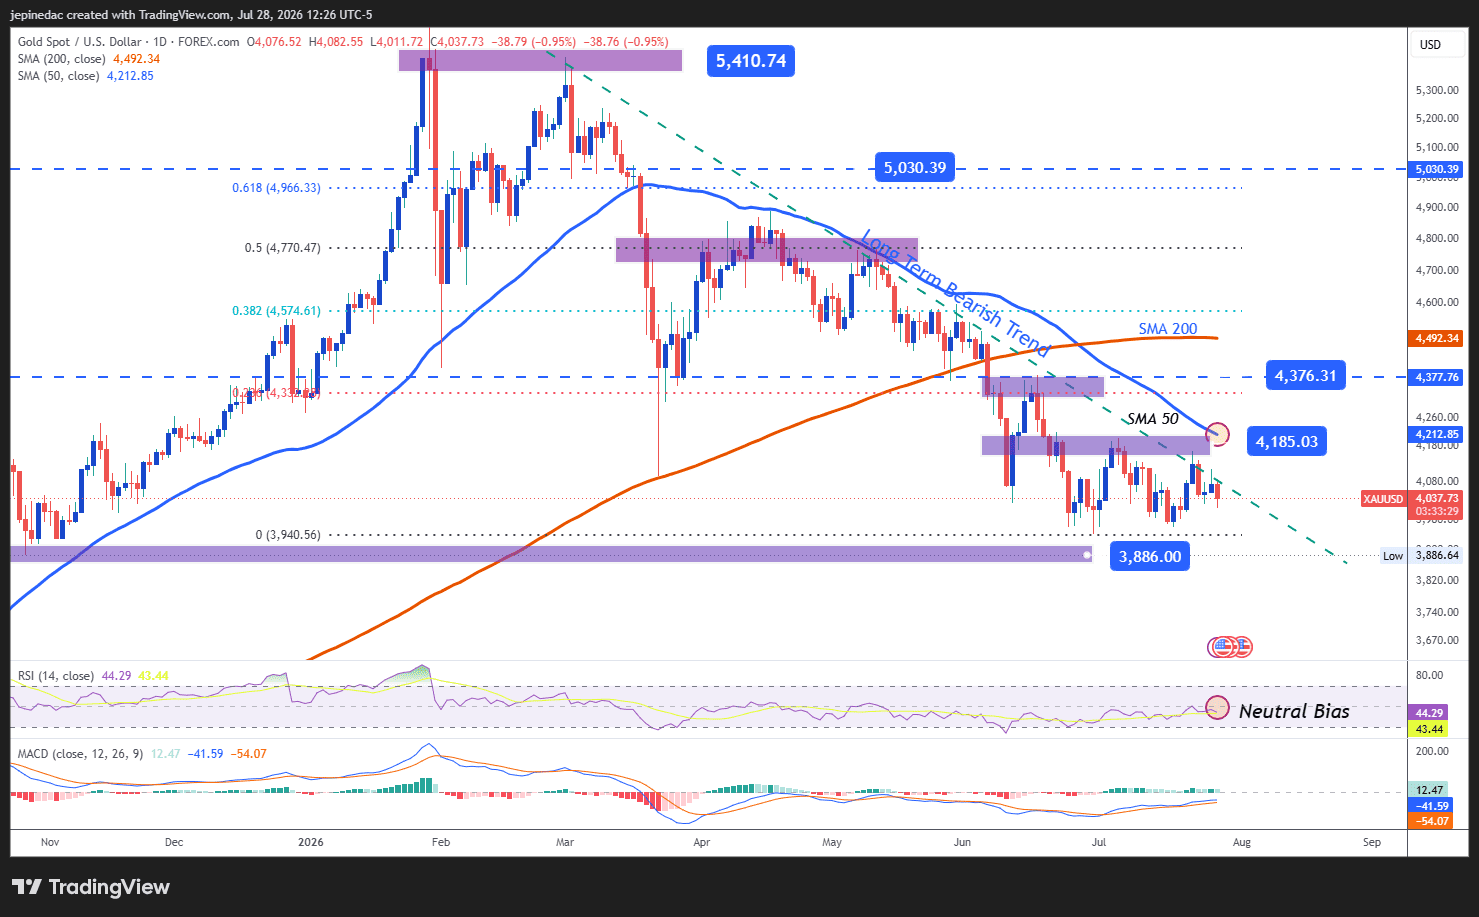
Source: StoneX, Tradingview
- Neutrality begins to gain relevance: Although gold’s daily chart still maintains a long-term bearish trend line, recent movements have started to show a more neutral short-term phase. If price fails to define a clear direction over the next few sessions, a more relevant sideways range could begin to form and become key for the coming trading weeks.
- RSI: Now, the RSI is moving near the neutral 50 level. This suggests a balance between bullish and bearish impulses over the last 14 sessions. This dynamic reflects a possible indecision bias that could continue if the indicator maintains this behavior.
- MACD: A similar reading can be seen in the MACD, as the histogram remains close to the neutral 0 area. This suggests that the average strength of short-term moving averages is in balance, reinforcing the possibility of an indecision phase in gold.
Key levels to watch:
- 4,376 USD – Crucial resistance: This relevant bullish barrier coincides with the 23.6% Fibonacci retracement and with important highs from previous weeks. Price movements above this area could open room for the formation of a short-term bullish trend line over the next few sessions.
- 4,185 USD – Near-term barrier: This key neutral area aligns with the long-term bearish trend line and the 50-period simple moving average. Moves above this level could weaken the bearish structure seen in previous months. However, if price fails to move consistently away from this reference, it could continue to highlight a phase of indecision and open room for a more relevant sideways range.
- 3,886 USD – Critical support: This level is associated with relevant lows from October 2025 and is considered the next most important bearish barrier. Movements toward this area could once again highlight a clearer selling bias and extend the bearish trend line as the dominant technical structure over the coming trading weeks.
Written by Julian Pineda, CFA, CMT – Market Analyst
Follow him on: @julianpineda25
Latest market news



Open an account in minutes
Experience award-winning platforms with fast and secure execution, and enjoy tight spreads from 0.5 pts on FX and 0.3 pts on indices.
Economic calendar
Web Trader platform
Our sophisticated web-based platform is packed with features.
Related articles

Crude Oil, DXY Outlook: Geopolitical Risks Halt Sell-Offs in the Dollar and Oil
The U.S. Dollar Index, Brent and WTI are rebounding from key support levels and oversold conditions after steep sell-offs. U.S.–Iran tensions, inflation risks and rate expectations remain in focus.


Gold Reclaims $4,000, Bulls Eye Reversal with Seasonality Tailwind
Gold futures rebound above $4,000 as falling US yields, improving sentiment and bullish seasonality raise hopes of a significant reversal.

Crude Oil Prices Fall, What the U.S. Midterms Mean for Brent
Crude oil prices have pulled back more than 11% from October highs, in line with U.S.-Iran negotiation hopes and shifting U.S. midterm expectations.
This report is intended for general circulation only. It should not be construed as a recommendation, or an offer (or solicitation of an offer) to buy or sell any financial products. The information provided does not take into account your specific investment objectives, financial situation or particular needs. Before you act on any recommendation that may be contained in this report, independent advice ought to be sought from a financial adviser regarding the suitability of the investment product, taking into account your specific investment objectives, financial situation or particular needs.
StoneX Financial Pte. Ltd., may distribute reports produced by its respective foreign entities or affiliates within the StoneX group of companies or third parties pursuant to an arrangement under Regulation 32C of the Financial Advisers Regulations. Where the report is distributed to a person in Singapore who is not an accredited investor, expert investor or an institutional investor (as defined in the Securities Futures Act), StoneX Financial Pte. Ltd. accepts legal responsibility to such persons for the contents of the report only to the extent required by law. Singapore recipients should contact StoneX Financial Pte. Ltd. at 6826 9988 for matters arising from, or in connection with the report.
In the case of all other recipients of this report, to the extent permitted by applicable laws and regulations neither StoneX Financial Pte. Ltd. nor its associated companies will be responsible or liable for any loss or damage incurred arising out of, or in connection with, any use of the information contained in this report and all such liability is hereby expressly disclaimed. No representation or warranty is made, express or implied, that the content of this report is complete or accurate.
StoneX Financial Pte. Ltd. is not under any obligation to update this report.
Trading CFDs carries a high level of risk that may not be suitable for some investors. Consider your investment objectives, level of experience, financial resources, risk appetite and other relevant circumstances carefully. The possibility exists that you could lose some or all of your investments, including your initial deposits. If in doubt, please seek independent expert advice. Visit www.forex.com/en-sg/terms-and-policies for the complete Risk Disclosure Statement.