


Gold, GBP/USD Forecast: Two trades to watch
Gold tumbles to a fresh 14-month low on hawkish Fed rhetoric. GBP/USD falls to a yearly low on USD strength and after cooler-than-forecast UK inflation data.
Share this:

Gold tumbles to a fresh 14-month low on hawkish Fed rhetoric
Gold has fallen to a fresh 14-month low as hawkish Fed expectations have lifted the U.S. dollar to a 19-month high and pushed Treasury yields higher.
Minutes from the October FOMC meeting showed strong alignment among Fed officials on the need for further rate hikes. At the October meeting, the Fed left rates unchanged at 3.75% to 4% in a 10-to-2 vote, having hiked rates by 25 basis points in September.
The market is pricing in a 93% probability of a 25-basis-point hike next month and a 10% probability of a 50-basis-point hike. Three interest rate hikes are expected between now and March next year.
U.S. Treasury yields are rising, with the 10-year yield above 5% and flashing strong technical signals of a sustained upward move. The U.S. dollar has also risen to a 19-month high.
Together, these developments are taking the shine off non-yielding, dollar-denominated gold.
It will likely take the Federal Reserve adopting a more dovish stance towards the end of the hiking cycle for gold to recover.
Gold forecast – technical analysis
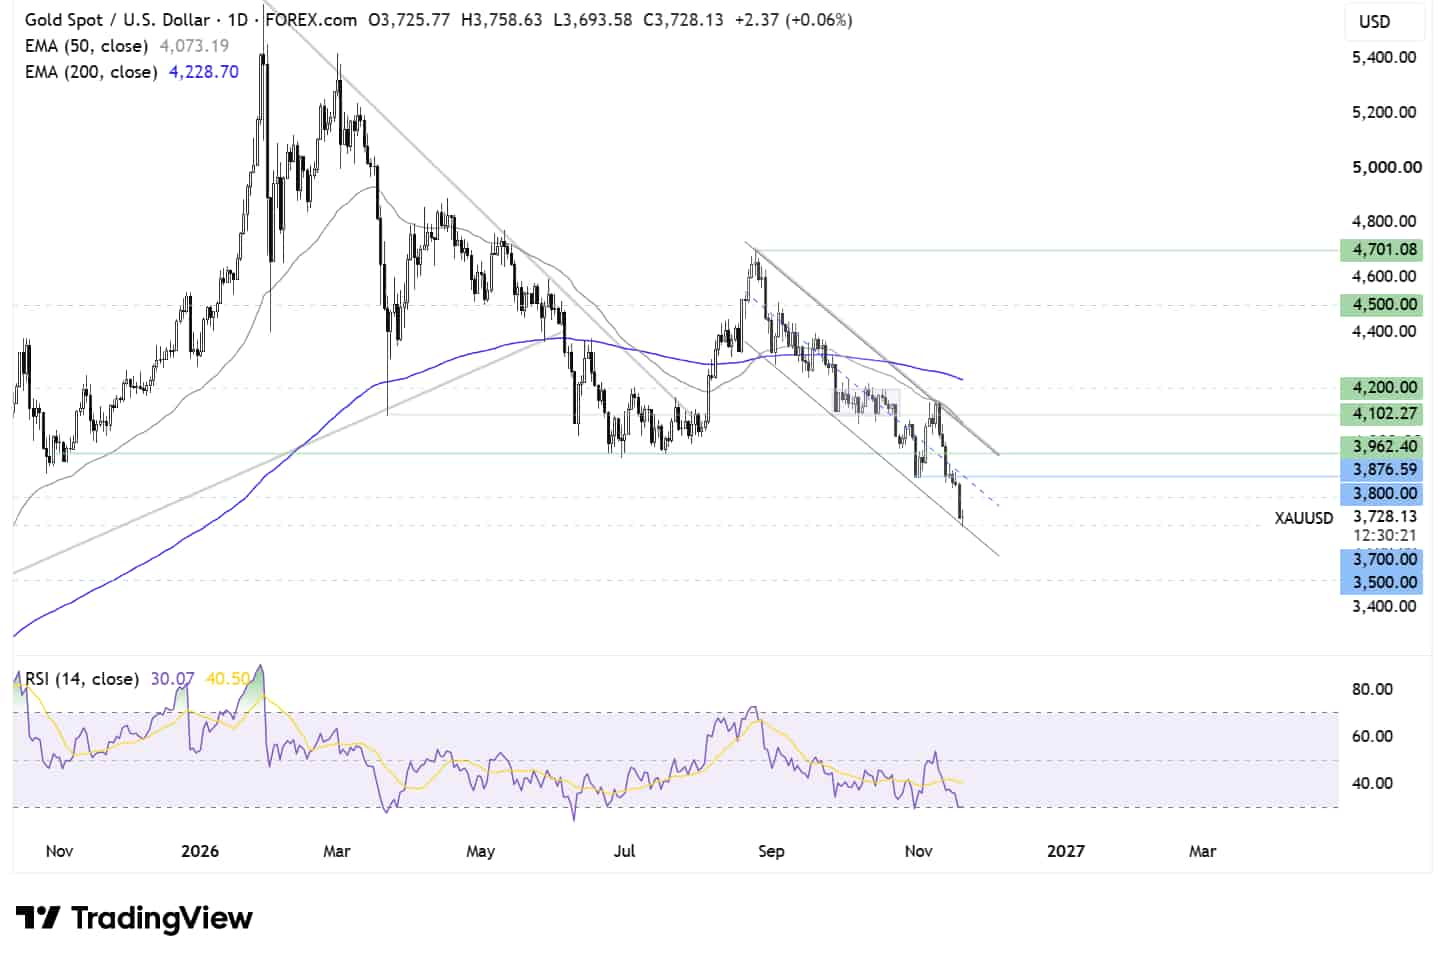
XAU/USD has dropped to a 14-month low below $3,700. The price is trading in a descending channel and below both its 50 and 200 EMAs, keeping the technical picture bearish. The RSI is approaching oversold territory, although there are few signs of a reversal at this stage. Yesterday's decisive break below $3,800 has reinforced the bearish bias.
Sellers will look to break below support at $3,700, the 2026 low and the lower boundary of the falling channel. A sustained move below here would open the door towards $3,500, the round-number level and the 2025 high.
Should support at $3,700 hold, buyers would first need to reclaim $3,880, the October low and the midpoint of the descending channel. A break above here would bring the 50 EMA and July low at $3,960 into focus, followed by $4,150, the November high.
A rise above $4,150 creates a higher high and improves the technical outlook, bringing the 200 EMA at $4,230 into focus,
GBP/USD falls to a yearly low on USD strength and after cooler than forecast UK inflation data
GBP/USD is under pressure around the 1.3135 level, trading down 1.75% so far in November amid persistent U.S. dollar strength.
The U.S. dollar has extended its gains following hawkish Federal Reserve expectations. While the central bank left rates unchanged at the October meeting, following a 25-basis-point hike in September, the latest minutes saw officials express confidence in the need for further rate hikes to curb inflation.
The market is pricing in a 90% probability of a 25-basis-point hike in December and a 10% chance of a 50-basis-point hike. Three hikes are priced in between now and March.
Meanwhile, data this week showed that UK inflation rose by 3.6% year on year in October, up from 3.5% in September, but below expectations of 3.75%. Core inflation and services inflation, which the Bank of England watches closely, both defied expectations of a rise and held steady.
This suggests there is still little clear evidence of indirect effects from the energy shock passing through into core or services inflation. However, indirect effects could become more visible over time.
The Bank of England sees headline inflation reaching almost 5% by Q2 2027.
The market is pricing in around an 80% probability of a hike from the Bank of England in December, down from 90% ahead of the data. The market is also pricing in four rate hikes between now and the end of next year, which appears quite aggressive. Any unwinding of these expectations could pull GBP/USD lower.
GBP/USD forecast – technical analysis
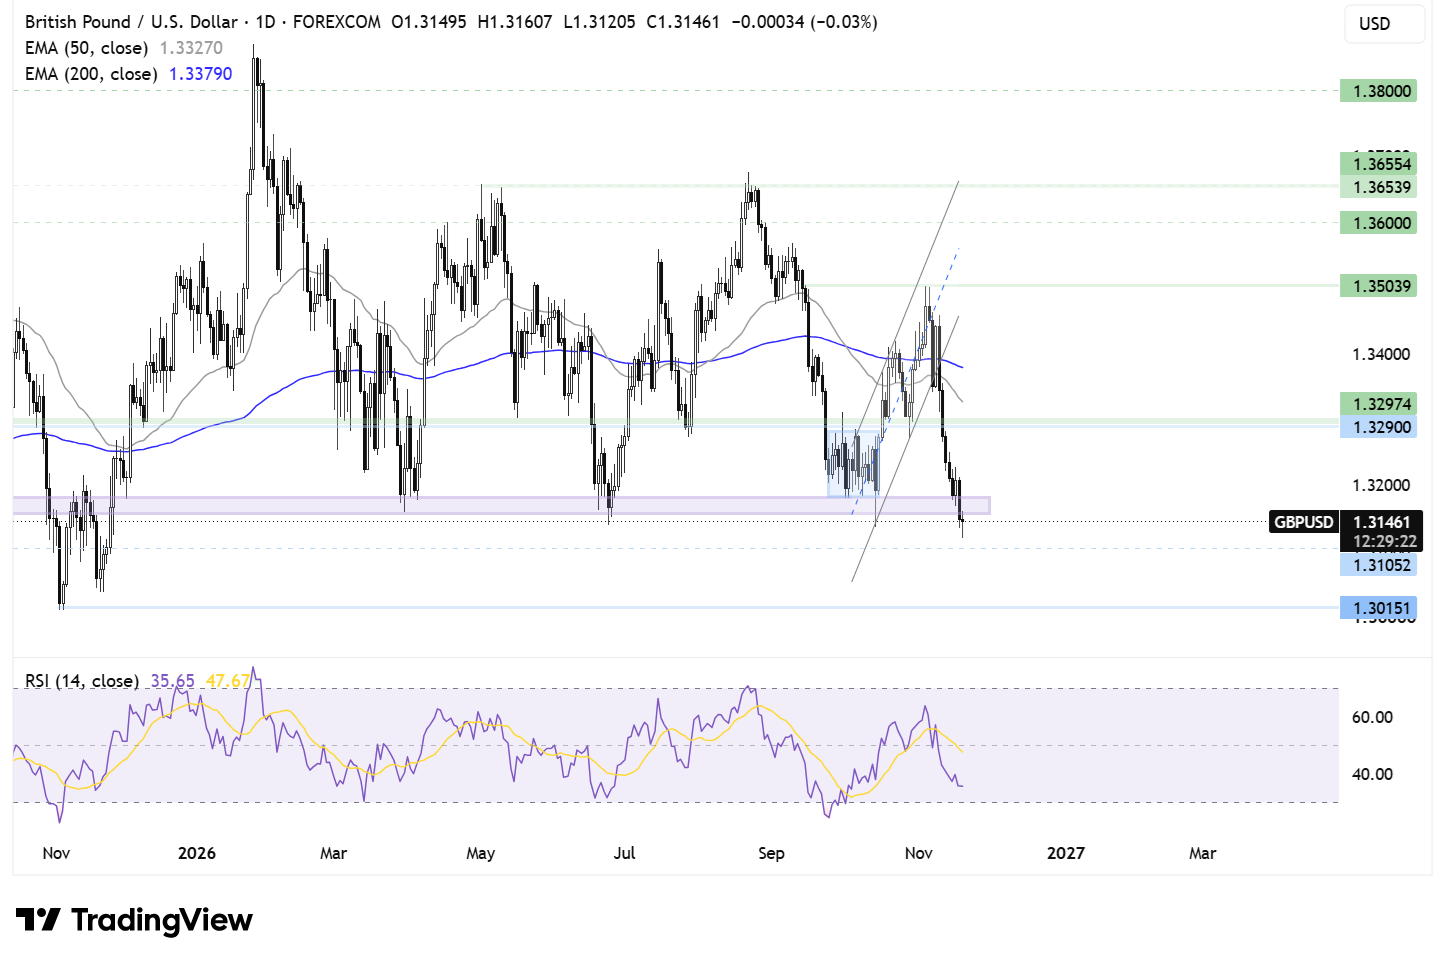
GBP/USD has broken below the key 1.3200 support zone, dropping to 1.3120, a fresh yearly low. With the RSI below 50 but not yet in oversold territory, there is potential for further downside. 1.3100 is the next near-term target, ahead of 1.3150, the 2025 low.
Any recovery would need to regain the 1.3150–1.3200 zone and rise above 1.3300 resistance. This would help put the price on a slightly firmer footing before exposing the 50 EMA at 1.3330 and the 200 EMA at 1.3380. A rise above 1.3500 is needed to create a higher high.
Related tags:



Open an account in minutes
Experience award-winning platforms with fast and secure execution, and enjoy tight spreads from 0.5 pts on FX and 0.3 pts on indices.
Economic calendar
Web Trader platform
Our sophisticated web-based platform is packed with features.
Related articles
Gold, GBP/USD Forecast: Two trades to watch
Gold tumbles to a fresh 14-month low on hawkish Fed rhetoric. GBP/USD falls to a yearly low on USD strength and after cooler-than-forecast UK inflation data.

Gold's Rout Accelerates as FOMC Minutes Bolster the US Doller
Gold extends its selloff as hawkish FOMC minutes reinforce Fed rate hike expectations, lifting the US dollar and pressuring gold prices across major currencies.


Gold Breaks Down but is This a Sign of What’s to Come?
Gold prices have broken down to a fresh yearly low and the next obvious level-lower is the $3500 spot that held the highs ahead of Jerome Powell’s Jackson Hole appearance last year.

This report is intended for general circulation only. It should not be construed as a recommendation, or an offer (or solicitation of an offer) to buy or sell any financial products. The information provided does not take into account your specific investment objectives, financial situation or particular needs. Before you act on any recommendation that may be contained in this report, independent advice ought to be sought from a financial adviser regarding the suitability of the investment product, taking into account your specific investment objectives, financial situation or particular needs.
StoneX Financial Pte. Ltd., may distribute reports produced by its respective foreign entities or affiliates within the StoneX group of companies or third parties pursuant to an arrangement under Regulation 32C of the Financial Advisers Regulations. Where the report is distributed to a person in Singapore who is not an accredited investor, expert investor or an institutional investor (as defined in the Securities Futures Act), StoneX Financial Pte. Ltd. accepts legal responsibility to such persons for the contents of the report only to the extent required by law. Singapore recipients should contact StoneX Financial Pte. Ltd. at 6826 9988 for matters arising from, or in connection with the report.
In the case of all other recipients of this report, to the extent permitted by applicable laws and regulations neither StoneX Financial Pte. Ltd. nor its associated companies will be responsible or liable for any loss or damage incurred arising out of, or in connection with, any use of the information contained in this report and all such liability is hereby expressly disclaimed. No representation or warranty is made, express or implied, that the content of this report is complete or accurate.
StoneX Financial Pte. Ltd. is not under any obligation to update this report.
Trading CFDs carries a high level of risk that may not be suitable for some investors. Consider your investment objectives, level of experience, financial resources, risk appetite and other relevant circumstances carefully. The possibility exists that you could lose some or all of your investments, including your initial deposits. If in doubt, please seek independent expert advice. Visit www.forex.com/en-sg/terms-and-policies for the complete Risk Disclosure Statement.