



Gold Sell-Off Stalls but Can Bulls Force a Turn?
Gold has dropped by as much as 13% from the August highs, and almost 30% from the January highs. More recently, however, bulls have been putting up a fight at the $4100 level that and that’s the item of importance for this week.
Share this:

Gold Talking Points:
- Gold has taken some hits as the August breakout went into reversal.
- But like we saw in June and July, big support showed at a major psychological level with $4100 coming into play over the past couple weeks after $4k helped to set the floor this summer.
There can be large differences between short and long-terms, and that dichotomy has been clear so far this year in Gold. After coming into the year riding a massive wave of strength and overbought conditions, a sizable reversal in January led to a bounce that ran into March. But, that’s when the Iran scenario started to take over headlines and as fears of inflation entered the equation, Gold sellers took over.
In June, at the FOMC rate decision, a hawkish Fed gave investors even less reason to be excited about the long side of Gold. A more hawkish Fed combined with that jump in inflation made it seem as though holding a non-yielding asset like Gold or Bitcoin could be a sub-optimal route. And, accordingly, after Kevin Warsh’s first meeting atop the Fed, Gold finally broke down to re-test the $4k level.
But it’s what happened then that is of interest, as repeated attempts from sellers to push a breakdown failed, and from the weekly chart, you can see that there wasn’t a single week where spot Gold closed below the big figure, hinting that some market players were using this bearish short-term backdrop as opportunity to accumulate.
Gold Weekly Chart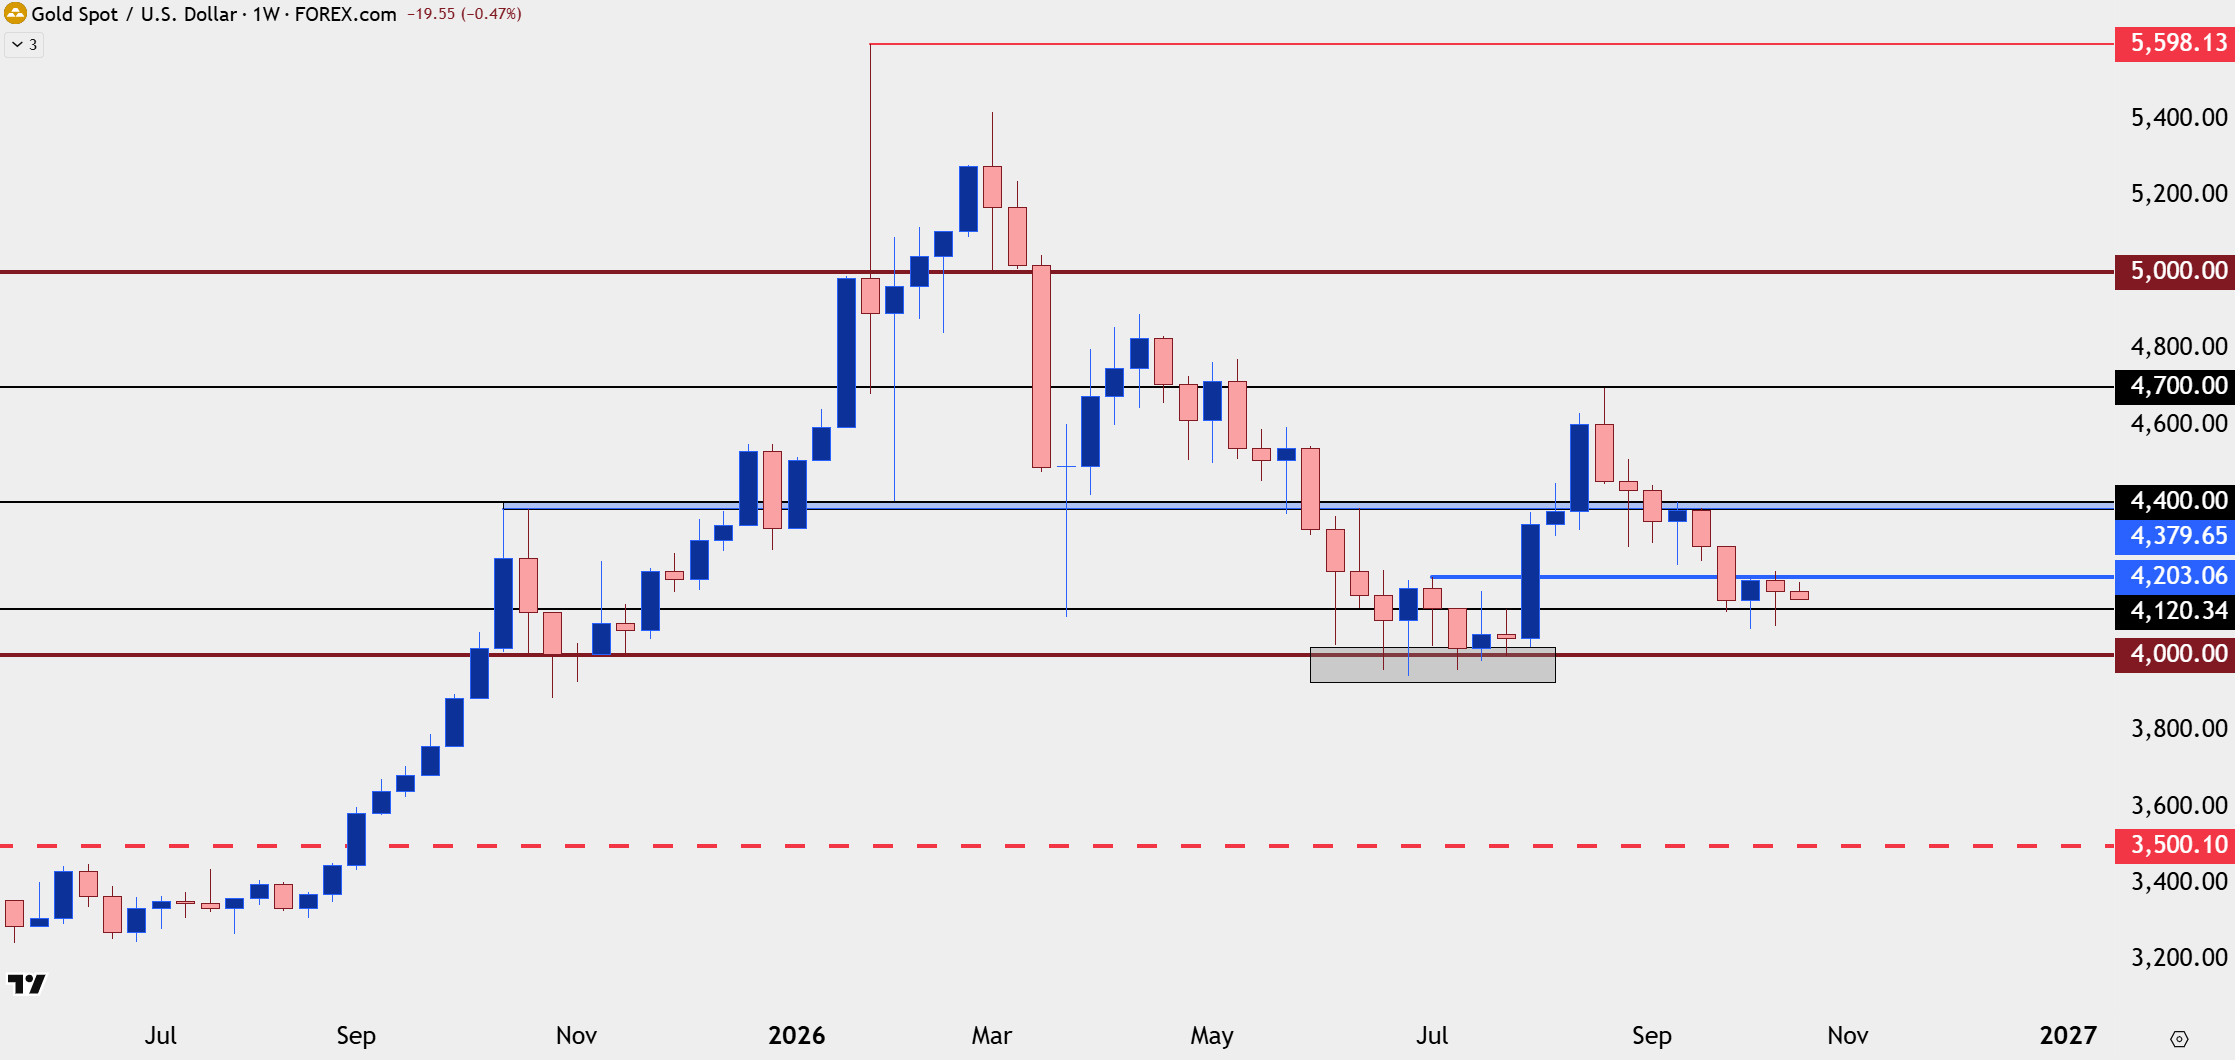
Chart prepared by James Stanley; data derived from Tradingview
Gold Daily
The above chart has the appearance of smoothness, given the build of support at $4k and the rally that followed, and then, more recently, the support at $4100. The daily chart is more chaotic, however, and there’s even a degree of resemblance between that June/July period and what’s taken place more recently.
This is, in essence, a range, although there’s not as much consistency as one might want when trading a range. There have been multiple resistance hits at $4200 and the upper wicks on those candles show short-term bears using rallies to pare positions. But, like we saw back in June and July, there’s also underside wicks after tests of lows, similar to what showed up last week and in that instance, we saw a higher-low print as bears were unable to take out the prior week low.
Gold Daily Chart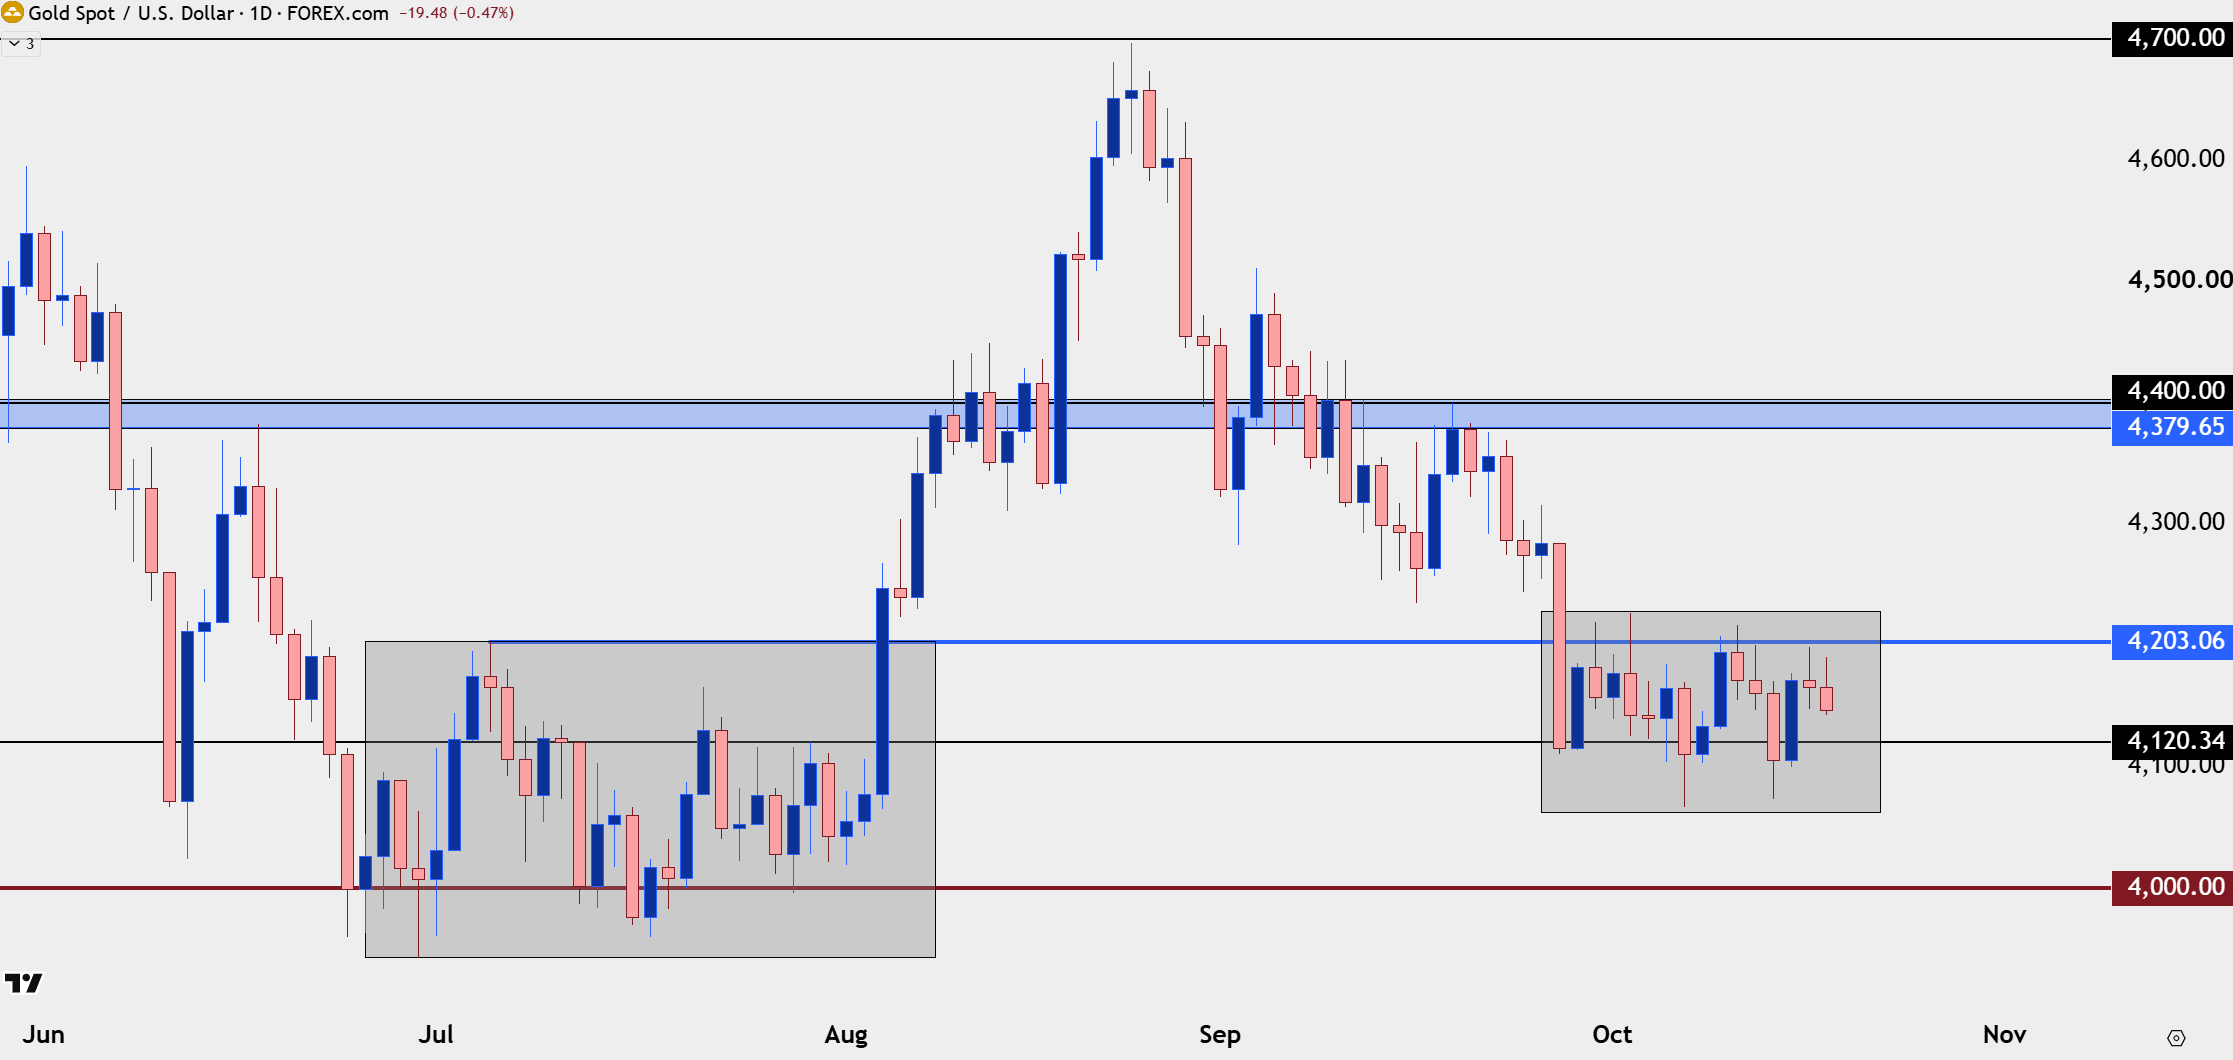
Chart prepared by James Stanley; data derived from Tradingview
Gold: Threading the Needle
At this point traders would probably want to have a defined approach before looking to make a directional push on Gold, in either direction. For longer-term approaches, the prospect of a hold at short-term range support in the direction of the longer-term trend remains attractive. But, for those with more short-term vantage points, there might be an open door to work with the short-side within that range; and perhaps even a breach of support to allow for another $4k re-test.
On the below four-hour chart, I’ve allocated the range as it’s played out over the past few weeks, and shows of support above $4074 are of particular interest, with $4109-$4120 also presenting some attraction.
For resistance, the $4200 level has been trafficked so heavily that we’ve even seen some resistance build below that, around $4190, and that helps to demarcate resistance.
Gold Four-Hour Chart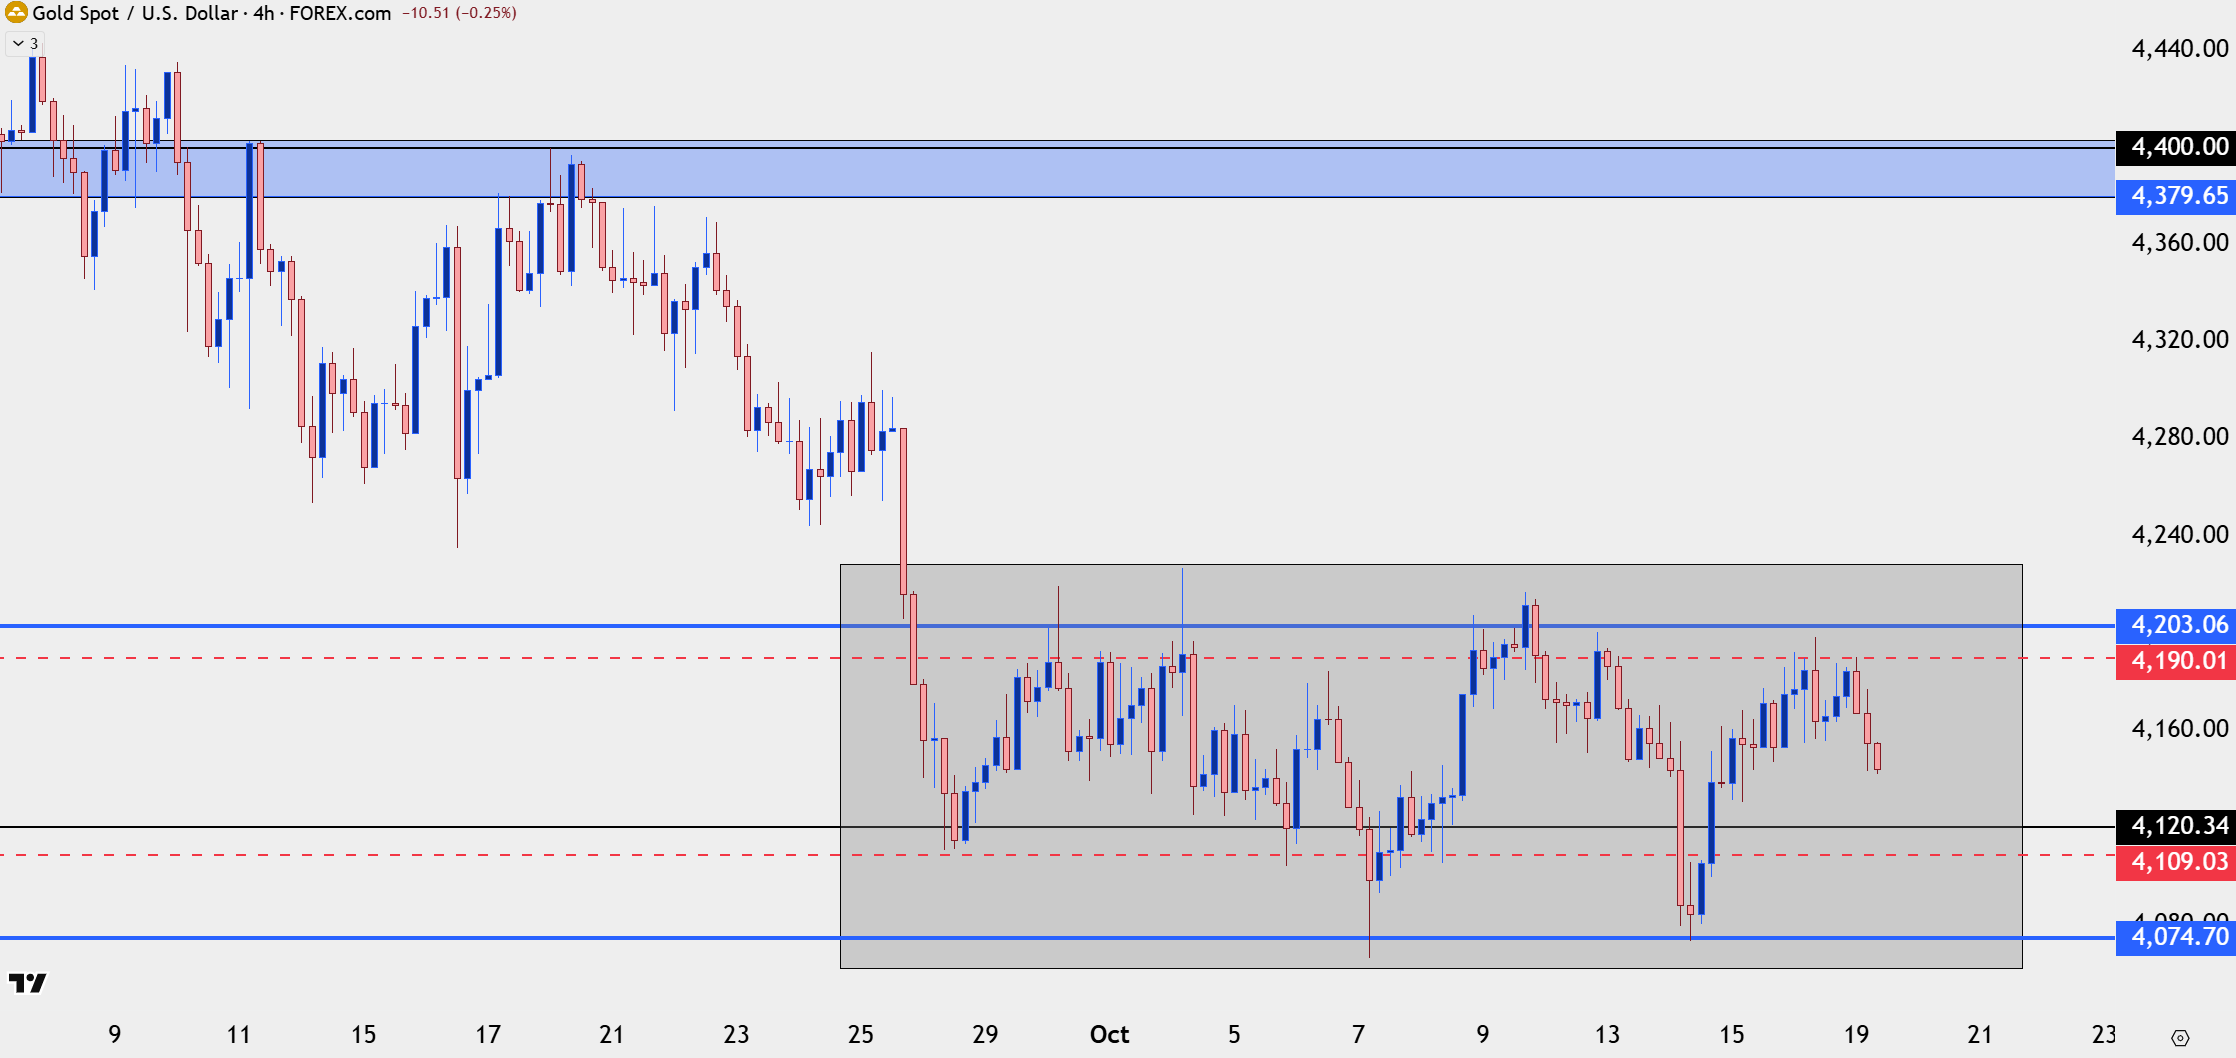
Chart prepared by James Stanley; data derived from Tradingview
--- written by James Stanley, Senior Market Analyst, Global Macro
Related tags:
Latest market news




Open an account in minutes
Experience award-winning platforms with fast and secure execution, and enjoy tight spreads from 0.5 pts on FX and 0.3 pts on indices.
Economic calendar
Web Trader platform
Our sophisticated web-based platform is packed with features.
Related articles
Gold Sell-Off Stalls but Can Bulls Force a Turn?
Gold has dropped by as much as 13% from the August highs, and almost 30% from the January highs. More recently, however, bulls have been putting up a fight at the $4100 level that and that’s the item of importance for this week.

Gold forecast: Metal unable to shake off macro concerns
The near-term risks remain tilted to the downside for our gold forecast. That said, continued central bank buying, haven demand and inflation hedging all mean that the longer-term outlook is still quite compelling.


Gold and Silver Sit on Support With a Steep Drawdown Below
The gold and silver outlook stays bullish while U.S. Treasury yields and the U.S. dollar index pull back, keeping the July rebound intact.

This report is intended for general circulation only. It should not be construed as a recommendation, or an offer (or solicitation of an offer) to buy or sell any financial products. The information provided does not take into account your specific investment objectives, financial situation or particular needs. Before you act on any recommendation that may be contained in this report, independent advice ought to be sought from a financial adviser regarding the suitability of the investment product, taking into account your specific investment objectives, financial situation or particular needs.
StoneX Financial Pte. Ltd., may distribute reports produced by its respective foreign entities or affiliates within the StoneX group of companies or third parties pursuant to an arrangement under Regulation 32C of the Financial Advisers Regulations. Where the report is distributed to a person in Singapore who is not an accredited investor, expert investor or an institutional investor (as defined in the Securities Futures Act), StoneX Financial Pte. Ltd. accepts legal responsibility to such persons for the contents of the report only to the extent required by law. Singapore recipients should contact StoneX Financial Pte. Ltd. at 6826 9988 for matters arising from, or in connection with the report.
In the case of all other recipients of this report, to the extent permitted by applicable laws and regulations neither StoneX Financial Pte. Ltd. nor its associated companies will be responsible or liable for any loss or damage incurred arising out of, or in connection with, any use of the information contained in this report and all such liability is hereby expressly disclaimed. No representation or warranty is made, express or implied, that the content of this report is complete or accurate.
StoneX Financial Pte. Ltd. is not under any obligation to update this report.
Trading CFDs carries a high level of risk that may not be suitable for some investors. Consider your investment objectives, level of experience, financial resources, risk appetite and other relevant circumstances carefully. The possibility exists that you could lose some or all of your investments, including your initial deposits. If in doubt, please seek independent expert advice. Visit www.forex.com/en-sg/terms-and-policies for the complete Risk Disclosure Statement.