



Gold, Silver Price Forecast: Fed Decision, Long-Term & Short-Term Outlook
Gold, Silver Price Forecast: Gold and silver remain above major long-term support ahead of the Fed decision. Explore key technical levels, the DXY outlook, and bullish and bearish scenarios.
Share this:

Gold and silver continue to consolidate above major historical support zones as markets await the Federal Reserve's policy decision. While gold is holding above a decade-long trendline dating back to 2016, silver is facing a multi-decade support zone originating from the 1980 highs.
These rare long-term technical setups raise an important question for investors: Is this a buying opportunity, or is it better to wait for greater clarity before re-entering the market?
Fed Expectations Take Center Stage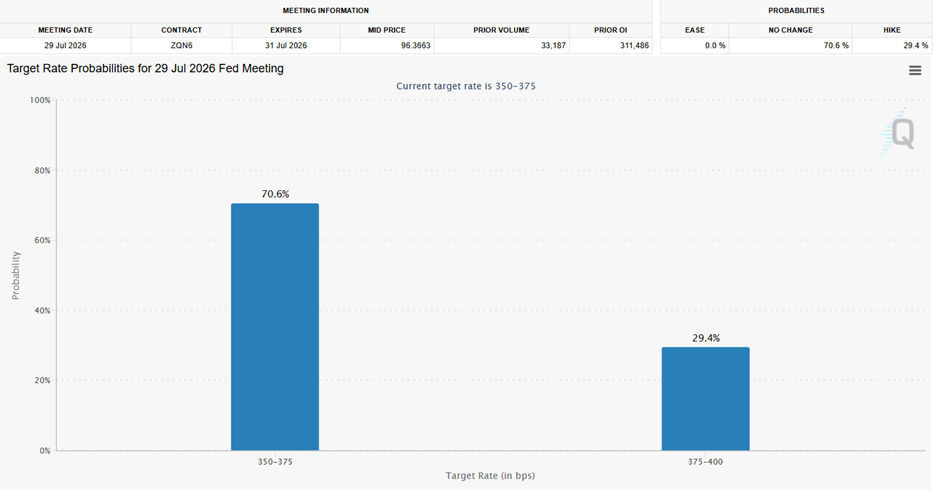
Source: CME
That question becomes even more relevant as markets prepare for today's Federal Reserve decision.
Current market expectations imply:
- Around a 70% probability that the Fed leaves interest rates unchanged.
- Nearly a 30% probability of a 25-basis-point rate hike.
- Expectations that policymakers will maintain a hawkish tone, supported by persistent Middle East tensions and renewed inflation risks.
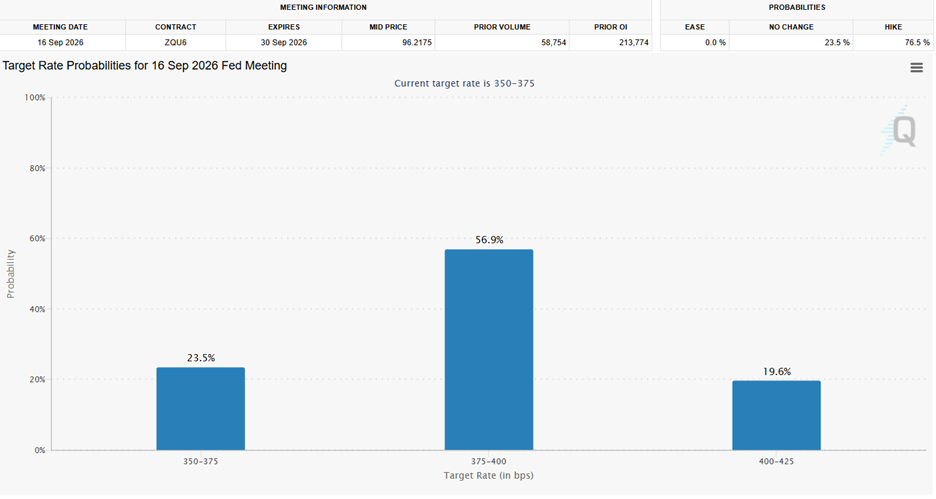
September Expectations Turn More Hawkish
Source: CME
Looking ahead to September, expectations become considerably more hawkish:
- More than a 56% probability of a 25-basis-point rate hike.
- Around a 19% probability of a 50-basis-point hike.
- Around a 23% probability of rates remaining unchanged.
These expectations continue to support the US Dollar Index above the 101 level, strengthening the US dollar while weighing on major currency pairs, including USD/JPY, which continues to trade near levels last seen in the 1980s.
At the same time, gold and silver remain trapped near critical technical confluence zones as investors assess whether Treasury yields will continue rising or whether the Federal Reserve could deliver a less hawkish message.
I discussed these scenarios in greater detail during my latest bi-weekly webinar.
Regardless of whether the next catalyst comes from geopolitical developments, a stronger US dollar, or a shift in Fed guidance, the key technical levels outlined below provide a framework for assessing both the short-term and long-term outlook.
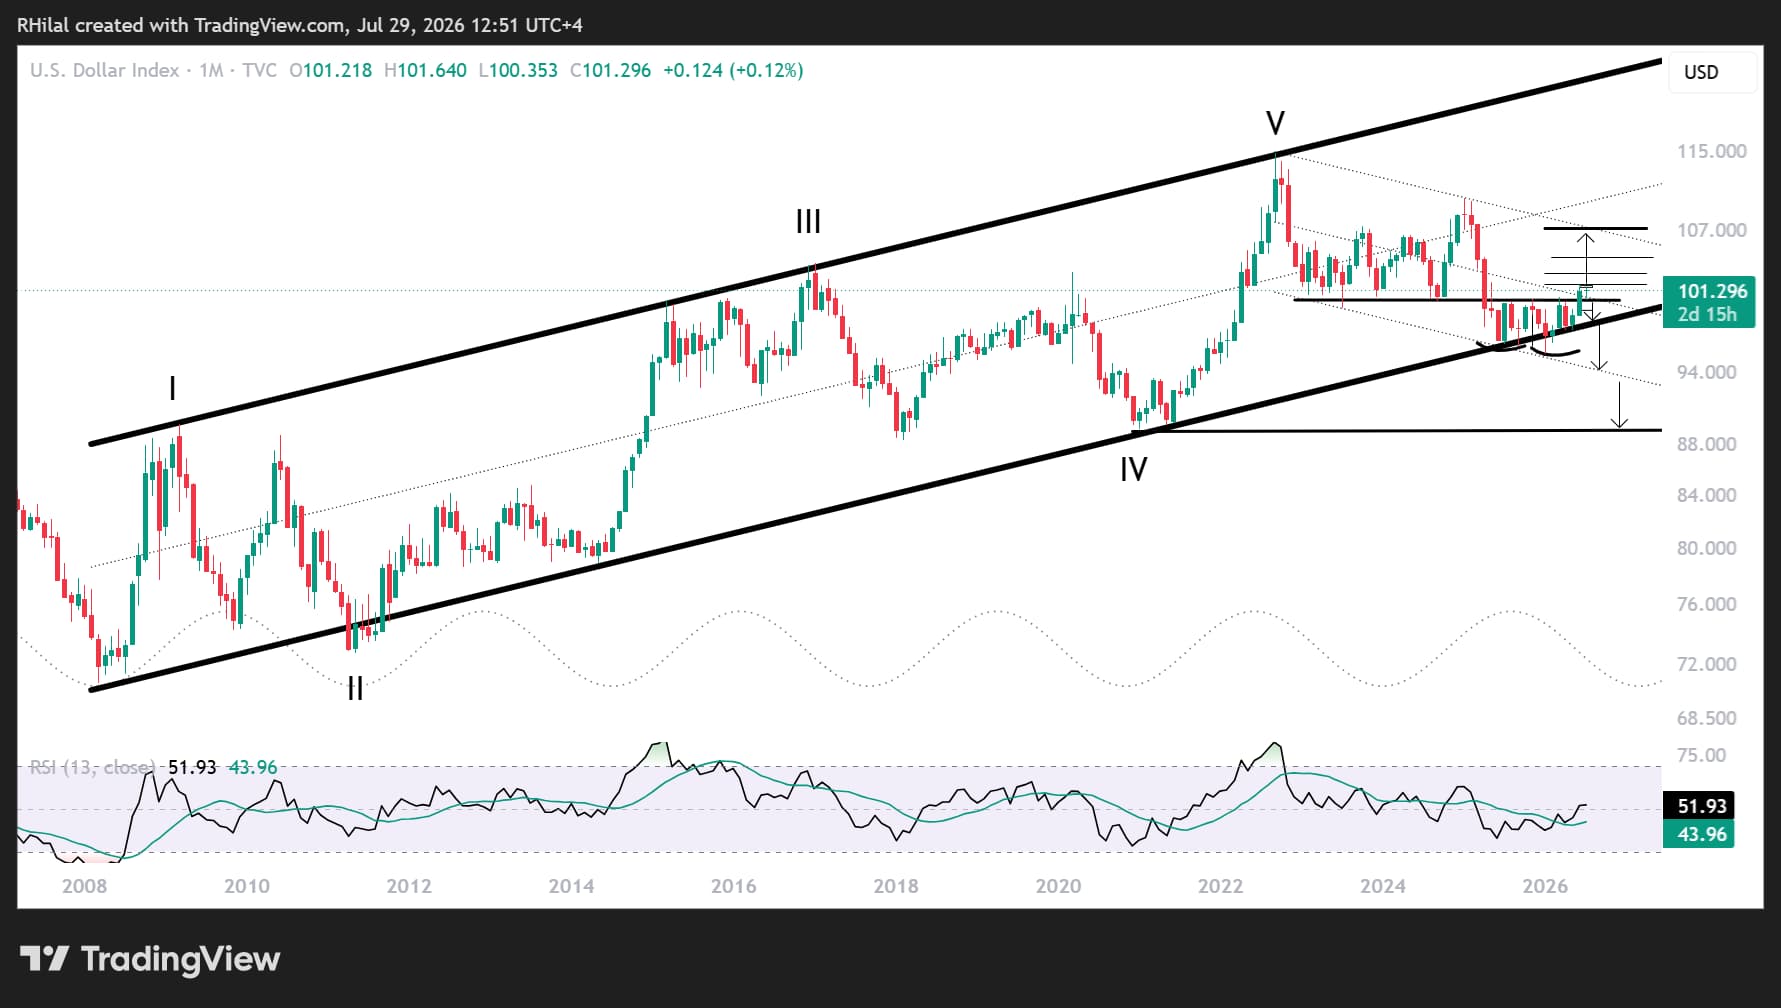
DXY Price Outlook: Monthly Time Frame – Log Scale
Source: Trading view
The monthly chart highlights that the US Dollar Index continues to hold within a major bullish confluence zone, supported by:
- The neckline of a potential double-bottom pattern.
- The midpoint of a descending parallel channel extending from 2022.
- A multi-year support and resistance zone that has repeatedly defined price action since 2023.
- Monthly RSI holding comfortably above the neutral 50 level
A monthly close above 102.00 would strengthen the bullish outlook, exposing resistance at 102.80, 104.50, and ultimately 107.00, which coincides with the upper boundary of the descending channel in place since 2022.
Such a move would likely coincide with renewed geopolitical tensions, stronger inflation pressures, or a more hawkish Federal Reserve. It would also increase downside pressure across major currencies and precious metals, potentially pushing both toward fresh 2026 lows before a longer-term recovery develops.
On the downside, a break below the uptrend support zone between 100.30 and 99.30 would weaken the year’s bullish structure, improving the outlook for currencies and precious metals.
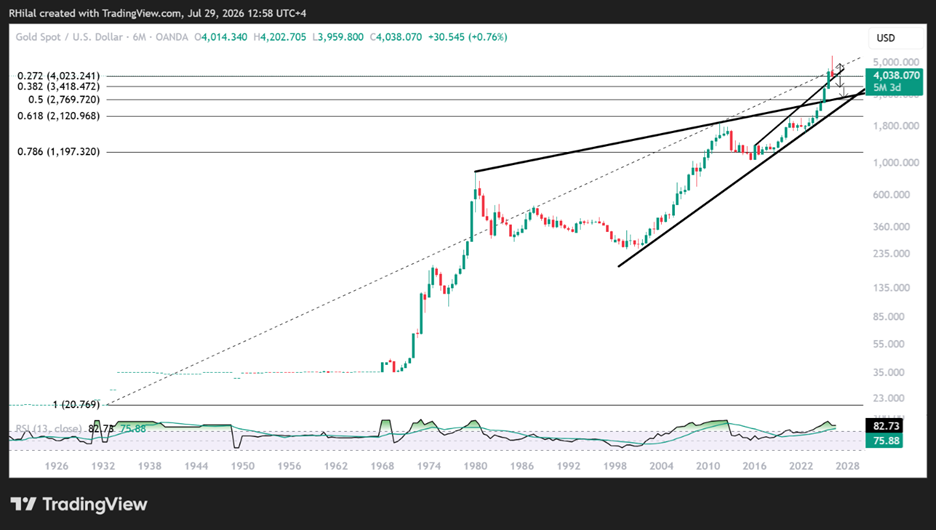
Gold Price Outlook: 6 -Month Time Frame – Log Scale
Source: Trading view
From a six-month perspective, gold is testing one of the most significant technical confluence zones in decades.
- Price continues to hold near the 27.2% Fibonacci retracement of the secular advance from 1920 to 2026. A sustained break below 3,930 would expose the 38.2% retracement between 3,500 and 3,460, an area that acted as major resistance throughout much of 2025.
- Gold is also holding above the long-term trendline connecting the major highs recorded between 2016 and 2025. What previously acted as resistance has now become one of the market's most important long-term support levels.
Whether gold rebounds from this area or extends its correction will largely depend on:
- Crude oil price direction
- Developments surrounding the US-Iran conflict and the Strait of Hormuz
- The Federal Reserve's policy outlook

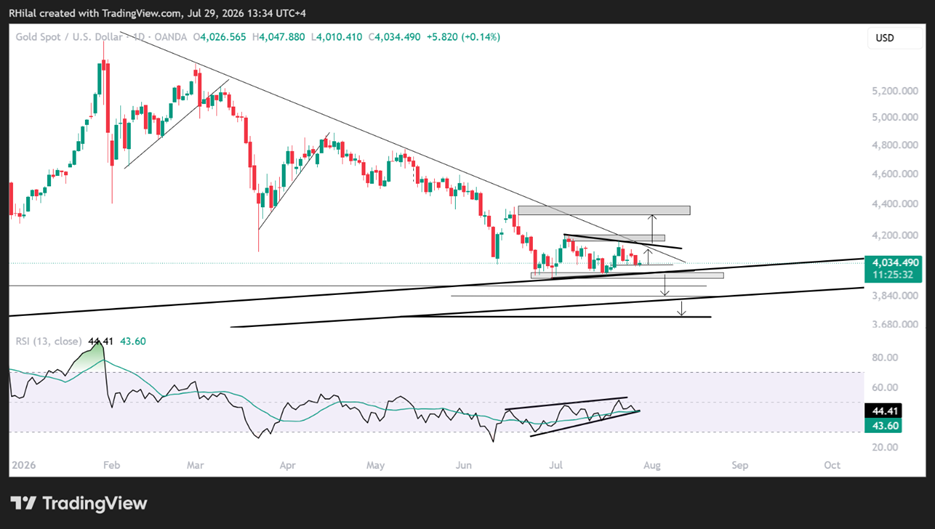
Gold Price Outlook: Daily Time Frame – Log Scale
Source: Trading view
Despite the strength of this higher-time-frame support zone, gold remains trapped inside a contracting consolidation between 3,930 and 4,200.
The broader short-term outlook therefore remains neutral, with key levels inside the consolidation at:
- 4,140 on the upside.
- 3,960–3,930 on the downside.
Meanwhile, the daily RSI continues to form a bullish divergence, suggesting downside momentum is gradually fading. However, confirmation requires a breakout above both the descending trendline connecting the lower highs since March 2026 and resistance between 4,140 and 4,200.
Gold Bullish Scenario
A sustained recovery above 4,140 and 4,200 would shift the short-term outlook back in favor of buyers. That would expose the next resistance levels at: 4,340 - 4,400
- A breakout above 4,400 would strengthen the case for a broader recovery across precious metals while increasing confidence that the longer-term uptrend has resumed.
Gold Bearish Scenario
On the downside, a break below the 3,960–3,930 support zone would reactivate the bearish scenario.
The next downside objectives are:
- 3,880–3,840, corresponding to the October 2025 lows.
- 3,700
- 3,500 - 3,460, respected 5 month resistance zone in 2025
These longer-term support zones could provide another significant reversal opportunity.
As long as the US Dollar Index and crude oil remain firm, downside risks across currencies and precious metals are likely to remain elevated.
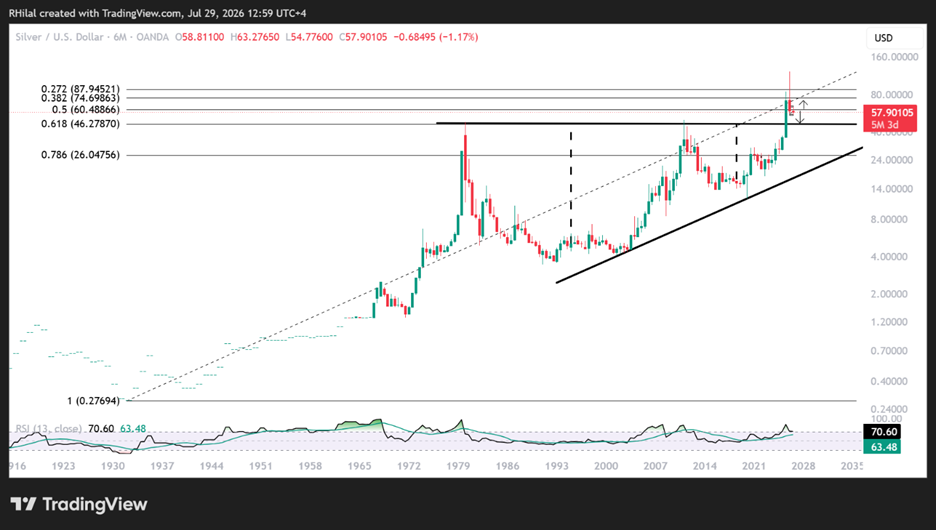
Silver Price Outlook: 3-Month Time Frame – Log Scale
Source: Trading view
The six-month chart highlights several important long-term technical developments.
- A shooting star reversal candle.
- A breakdown below the 50% Fibonacci retracement of the secular advance from 1930 to 2026.
- Price approaching the multi-decade trendline connecting the highs recorded between 1980 and 2024, which may now transition from long-term resistance into major support.
This area also aligns with the 61.8% Fibonacci retracement of the entire advance between $46 and $50.
The shorter-term outlook is further clarified on the daily chart below.
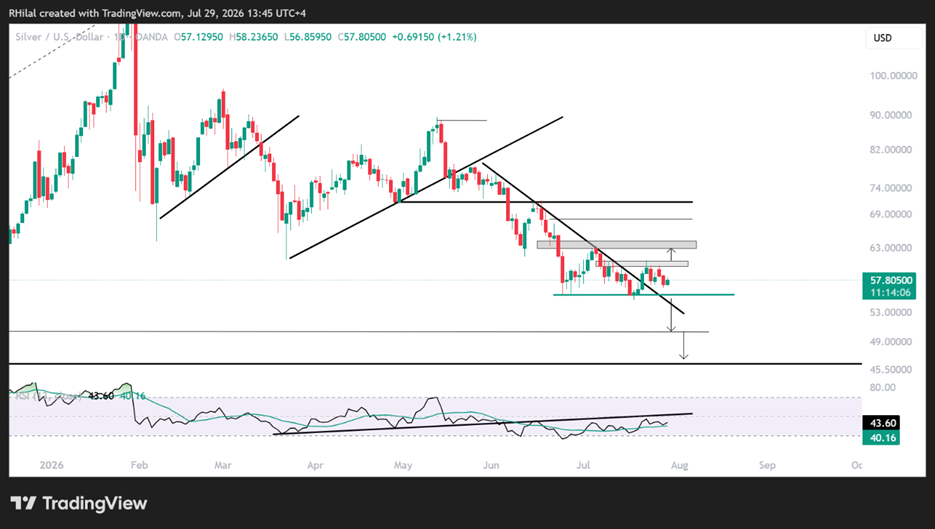
Silver Price Outlook: Daily Time Frame – Log Scale
Source: Trading view
From a daily perspective, silver is attempting to stabilize above the descending trendline connecting the lower highs formed since May 2026.
At the same time, momentum indicators remain below the neckline of the previous head-and-shoulders pattern, keeping the short-term bearish bias intact despite bullish divergence.
- A break below $55.50 would expose the longer-term support zone between $50 and $46.
- Conversely, a breakout above $61 exposes $63.80 - $68 - $72.
Long term outlook: a confirmed breakout above 72 would significantly strengthen confidence that a broader bullish reversal is underway, reopening the path toward triple-digit silver prices over the longer term.
Key Takeaway
The US Dollar Index (DXY) will remain one of the primary benchmarks for both the foreign exchange and precious metals markets as geopolitical risks and Federal Reserve expectations continue to evolve.
- The 101.80–102.00 resistance zone remains the key to watch for upside risks
- The 100.30 - 99.30 support zone remains key to watch for downside risks
Written by Razan Hilal, CMT
Follow on X: @Rh_waves
Latest market news




Open an account in minutes
Experience award-winning platforms with fast and secure execution, and enjoy tight spreads from 0.5 pts on FX and 0.3 pts on indices.
Economic calendar
Web Trader platform
Our sophisticated web-based platform is packed with features.
Related articles
US CPI Preview: Follow the Fed and Look Past the Hot Headline
A 0.6% m/m reading in headline CPI, while scary at first glance, is already expected and presumably discounted into the current market prices. Instead, the “core” reading will be more impactful for the Fed and markets - see what it means for the US dollar!

Japanese Yen Short-term Outlook: USD/JPY Breakout Risk Builds Below 200-Day Average 10 13 2026
USD/JPY is trading in a narrow range beneath major resistance ahead of CPI, with the next breakout likely to set the near-term directional tone.


British Pound Technical Outlook: GBP/USD Bulls Fight to Stabilize at Critical Support 10 13 2026
GBP/USD is compressing into a tight near-term range just above key support, with a breakout likely to provide the next directional cue.
This report is intended for general circulation only. It should not be construed as a recommendation, or an offer (or solicitation of an offer) to buy or sell any financial products. The information provided does not take into account your specific investment objectives, financial situation or particular needs. Before you act on any recommendation that may be contained in this report, independent advice ought to be sought from a financial adviser regarding the suitability of the investment product, taking into account your specific investment objectives, financial situation or particular needs.
StoneX Financial Pte. Ltd., may distribute reports produced by its respective foreign entities or affiliates within the StoneX group of companies or third parties pursuant to an arrangement under Regulation 32C of the Financial Advisers Regulations. Where the report is distributed to a person in Singapore who is not an accredited investor, expert investor or an institutional investor (as defined in the Securities Futures Act), StoneX Financial Pte. Ltd. accepts legal responsibility to such persons for the contents of the report only to the extent required by law. Singapore recipients should contact StoneX Financial Pte. Ltd. at 6826 9988 for matters arising from, or in connection with the report.
In the case of all other recipients of this report, to the extent permitted by applicable laws and regulations neither StoneX Financial Pte. Ltd. nor its associated companies will be responsible or liable for any loss or damage incurred arising out of, or in connection with, any use of the information contained in this report and all such liability is hereby expressly disclaimed. No representation or warranty is made, express or implied, that the content of this report is complete or accurate.
StoneX Financial Pte. Ltd. is not under any obligation to update this report.
Trading CFDs carries a high level of risk that may not be suitable for some investors. Consider your investment objectives, level of experience, financial resources, risk appetite and other relevant circumstances carefully. The possibility exists that you could lose some or all of your investments, including your initial deposits. If in doubt, please seek independent expert advice. Visit www.forex.com/en-sg/terms-and-policies for the complete Risk Disclosure Statement.