



Japanese Yen Price Action Setups into ISM and ADP: USD/JPY, EUR/JPY, CHF/JPY
USD/JPY steadies ahead of ISM and ADP, while EUR/JPY and CHF/JPY hold firm in bullish trends. Key setups for yen traders into a heavy US data window.
Share this:

Yen crosses enter a pivotal 48-hour window as ISM services, ADP payrolls and Australian GDP hit the wires. USD/JPY remains surprisingly resilient despite renewed Fed-cut bets, while EUR/JPY and CHF/JPY continue to trend higher on the daily charts. Below are the key technical levels, breakout signals and near-term risks to watch.
View related analysis:
View related analysis:
Yen Cross Technical Setups Ahead of ISM and ADP
USD/JPY Technical Analysis: US Dollar vs Japanese Yen
While speculation persists that the Bank of Japan may inch closer to a rate hike, it hasn’t been enough to spark a meaningful rebound in the yen. With a December Fed cut now back in play, USD/JPY should arguably be falling faster — yet price action remains relatively resilient. That keeps the latest pullback looking more corrective than structural, with a rebound towards 157 still a reasonable assumption within the broader bullish trend.


JPY Volatility Stays Muted Ahead of Heavy US Data
Implied volatility is unusually subdued given the upcoming ISM services, ADP payrolls and PCE inflation data. Any upside surprise here could catch US dollar bears off guard and support USD/JPY before its typical December softness — which tends to kick in during the second half of the month.

Chart analysis by Matt Simpson - data source: LSEG
Also note that the 1- and 3-month risk reversals remain aligned with the prevailing daily trend, signalling that options markets aren’t pricing a major bearish reversal yet. The 1-week tenor has slipped alongside spot, hinting at scope for further near-term downside, but nothing that challenges the broader structure.
Bulls Favoured Above 155 as Volume Confirms the Rebound
USD/JPY reached my 155 downside target with a strong lower wick, aligning with a heavily oversold RSI. Monday’s close back above the 20-day EMA and Tuesday’s small bullish candle show demand rebuilding above the spike low. Bias remains to buy dips while price holds above the 155 zone.
On the 1-hour chart, rising volume after the spike low supports the recovery. RSI (14) is confirming the move, and once Tokyo volatility clears, bulls can hunt dips within yesterday’s range targeting the high-volume nodes at 156.34, 156.70 and possibly the 157 handle. Further upside assumes incoming US data doesn’t tilt the narrative back toward Fed doves.
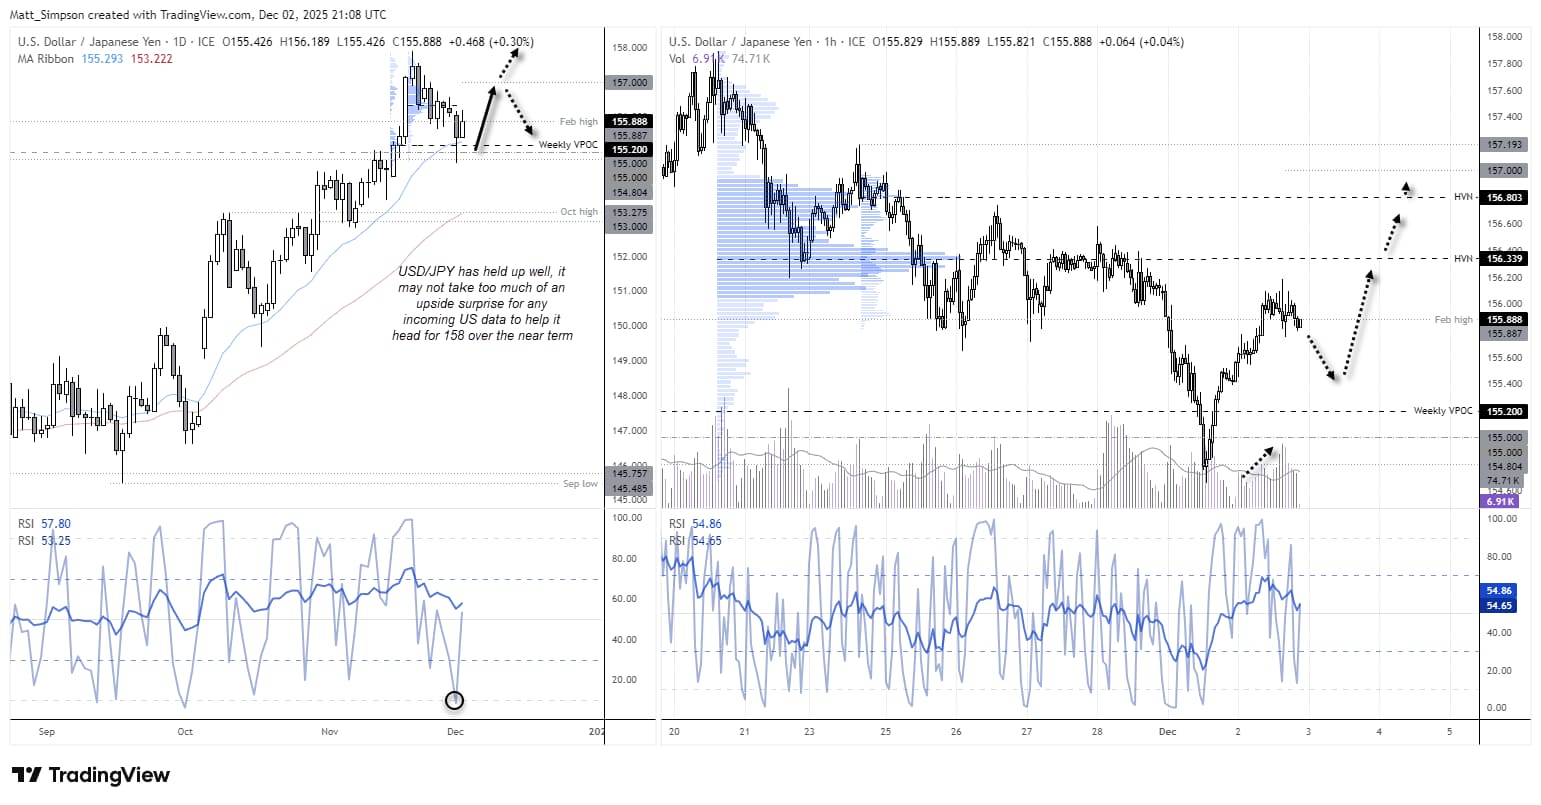
Chart analysis by Matt Simpson - data source: TradingView USD/JPY
EUR/JPY and CHF/JPY: Bullish Trends Intact Despite Minor Pullbacks
These charts are straightforward to interpret given the dominant bullish trends on the daily timeframe.
EUR/JPY: Triangle Patterns Hint at an Upside Break
EUR/JPY is carving out a potential symmetrical triangle near its highs and continues to hold above the 10-day EMA. The moving averages remain in a bullish sequence, and Wednesday’s bullish engulfing candle signals renewed demand. Bias favours an upside breakout and trend continuation. Even if we see a dip first, bulls can look for support around the 180 HVN or the monthly pivot.

 Chart analysis by Matt Simpson - data source: TradingView
CHF/JPY: Pullback Holds Above Supportive EMAs
CHF/JPY also retains a strong bullish trend, although the pullback from its record high has been slightly deeper than in EUR/JPY. Price is still holding above the 20-day EMA, and a supportive candle has formed, hinting that another test of the highs may be building. If price softens, bulls can watch for a swing low near the October high or the 192 handle. A clean break beneath 192 points to a deeper correction.


Key Economic Events for Traders (AEDT / GMT+11)
Australian GDP looks more likely than not to show some strength today, given elevated inflation, firm household spending and solid employment data. The real question is whether it fuels talk of a hike in H2 next year or revives bets on cuts.
ISM services PMI will be key for Fed watchers looking for clues on next year’s easing path. A 25bp December cut is already priced in, so the focus is entirely on 2026 expectations. Watch the prices paid and new orders components. Also note that S&P Global will release their own US PMI figure.
ADP payrolls has undershot expectations recently, and another negative print could quickly undermine my near-term bullish bias for USD/JPY.
Wednesday, December 3, 2025
09:00 AUD AIG Construction Index; AIG Manufacturing Index; Manufacturing & Services PMI; RBA Gov Bullock Speaks; Judo Bank Services PMI (AUD/USD, AUD/JPY, ASX 200)
11:00 NZD ANZ Commodity Price Index (NZD/USD, AUD/NZD, NZD/JPY)
11:30 AUD GDP; GDP Capital Expenditure; GDP Chain Price Index; GDP Final Consumption (AUD/USD, AUD/JPY, ASX 200)
11:30 JPY Manufacturing & Services PMI; au Jibun Bank Services PMI (USD/JPY, EUR/JPY, Nikkei 225)
12:45 CNY Caixin Services PMI (USD/CNY, AUD/CNH, CN50)
18:30 CHF CPI (USD/CHF, EUR/CHF)
19:30 EUR ECB President Lagarde Speaks (EUR/USD, DAX, EUR/GBP)
19:55 EUR HCOB Germany Composite PMI; Germany Services PMI (EUR/USD, DAX)
20:00 EUR HCOB Eurozone Composite PMI; Eurozone Services PMI (EUR/USD, EUR/GBP, Euro Stoxx 50)
20:30 GBP S&P Global Composite PMI; Services PMI (GBP/USD, EUR/GBP, FTSE 100)
21:00 EUR PPI (EUR/USD, DAX)
21:30 EUR ECB's Lane Speaks (EUR/USD, EUR/GBP)
23:00 USD MBA Mortgage Rate; MBA Mortgage Applications; Purchase Index; Mortgage Market Index; Refinance Index
(S&P 500, Nasdaq 100, USD/JPY)
Thursday, December 4, 2025
00:15 USD ADP Nonfarm Employment Change (S&P 500, Nasdaq 100, USD/JPY)
00:15 CAD Reserve Assets Total (USD/CAD, CAD/JPY, TSX)
00:30 USD Export Price Index; Import Price Index (DXY, USD/JPY, Gold)
00:30 CAD Labor Productivity (USD/CAD, CAD/JPY)
00:30 EUR ECB President Lagarde Speaks (EUR/USD, EUR/GBP, DAX)
01:15 USD Capacity Utilization; Industrial Production; Manufacturing Production (USD/JPY, Dow Jones, Gold)
01:30 CAD Services PMI (USD/CAD, CAD/JPY)
01:45 USD S&P Global Composite PMI; S&P Global Services PMI (S&P 500, Nasdaq 100, USD/JPY)
02:00 USD Construction Spending; ISM Non-Manufacturing Activity; ISM Employment; ISM New Orders; ISM PMI; ISM Prices; Total Vehicle Sales
(S&P 500, Nasdaq 100, USD/JPY)
02:30 USD Crude Oil Inventories; Refinery Runs; Crude Oil Imports; Cushing Inventories; Distillates; Gasoline Production; Heating Oil Stockpiles; Refinery Utilisation; Gasoline Inventories
(WTI, Brent, USD/CAD)
View the full economic calendar
View the full economic calendar
-- Written by Matt Simpson
Follow Matt on Twitter @cLeverEdge
How to trade with City Index
You can trade with City Index by following these four easy steps:
- Open an account, or log in if you’re already a customer
• Open an account in the UK
• Open an account in Australia
• Open an account in Singapore
- Search for the market you want to trade in our award-winning platform
- Choose your position and size, and your stop and limit levels
- Place the trade
Latest market news



Open an account in minutes
Experience award-winning platforms with fast and secure execution, and enjoy tight spreads from 0.5 pts on FX and 0.3 pts on indices.
Economic calendar
Web Trader platform
Our sophisticated web-based platform is packed with features.
Related articles
Gold forecast: XAU/USD stabilised after recent falls – for now
Gold has started the first week of the new month trying to recover some ground after another bruising week. Oil prices have taken a sharp drop and that has allowed risk assets to bounce back, which has clearly helped the precious metal too. However, with sentiment remaining bearish towards the metals, and with $4000 level having been taken out last week, the path of least resistance is to the downside for gold.


GBP/USD outlook: Currency Pair of the Week | November 2, 2026
The GBP/USD heads into a crowded week of event risk, with the midterm elections, a Bank of England rate decision and Friday's non-farm payrolls report all capable of moving markets sharply. The greenback remains fundamentally well supported by a hawkish Federal Reserve, but much of that is already priced in, while the renewed sell-off in technology stocks has exposed its vulnerability.

Forex, Gold and Oil Outlook: FX Crosses May Have the Edge
Major forex pairs lack conviction, but FX crosses may offer better opportunities. Matt Simpson examines forex, gold and crude oil markets.
This report is intended for general circulation only. It should not be construed as a recommendation, or an offer (or solicitation of an offer) to buy or sell any financial products. The information provided does not take into account your specific investment objectives, financial situation or particular needs. Before you act on any recommendation that may be contained in this report, independent advice ought to be sought from a financial adviser regarding the suitability of the investment product, taking into account your specific investment objectives, financial situation or particular needs.
StoneX Financial Pte. Ltd., may distribute reports produced by its respective foreign entities or affiliates within the StoneX group of companies or third parties pursuant to an arrangement under Regulation 32C of the Financial Advisers Regulations. Where the report is distributed to a person in Singapore who is not an accredited investor, expert investor or an institutional investor (as defined in the Securities Futures Act), StoneX Financial Pte. Ltd. accepts legal responsibility to such persons for the contents of the report only to the extent required by law. Singapore recipients should contact StoneX Financial Pte. Ltd. at 6826 9988 for matters arising from, or in connection with the report.
In the case of all other recipients of this report, to the extent permitted by applicable laws and regulations neither StoneX Financial Pte. Ltd. nor its associated companies will be responsible or liable for any loss or damage incurred arising out of, or in connection with, any use of the information contained in this report and all such liability is hereby expressly disclaimed. No representation or warranty is made, express or implied, that the content of this report is complete or accurate.
StoneX Financial Pte. Ltd. is not under any obligation to update this report.
Trading CFDs carries a high level of risk that may not be suitable for some investors. Consider your investment objectives, level of experience, financial resources, risk appetite and other relevant circumstances carefully. The possibility exists that you could lose some or all of your investments, including your initial deposits. If in doubt, please seek independent expert advice. Visit www.forex.com/en-sg/terms-and-policies for the complete Risk Disclosure Statement.