






Japanese Yen Technical Outlook: USD/JPY, EUR/JPY, GBP/JPY
Yen weakness has hung around and USD/JPY and GBP/JPY both retain bullish appeal. But for those looking for Yen-strength, perhaps in anticipation of next month’s policy review from the BoJ, EUR/JPY could hold greater attraction.
Share this:

Japanese Yen Talking Points:
- USD/JPY has continued to build structure within the Fibonacci retracement taken from the July-September sell-off, with both last week’s high and this week’s low printing at retracement levels. I looked at a Fibonacci level in last week’s Yen analysis article that has since held the highs from the breakout, and that remains a spot of interest moving forward.
- EUR/JPY has held up well despite the drubbing in the Euro elsewhere, but there’s been a build of lower-lows and lower-highs that makes the pair more attractive for Yen-strength scenarios.
- GBP/JPY was featured in yesterday’s webinar and the pair continues to show inflections from the gap drawn from the 2008 Financial Collapse, with 193.61 helping to set yesterday’s low and leading into a strong bounce.
The next big fundamental item for the Japanese Yen is expected in about a month with the bank’s policy review. This could have sway over whether the bank takes a more-hawkish turn into 2025 but, at this point, Yen-weakness has held fairly well in a variety of venues.
USD/JPY continues to track DXY themes well and given this morning’s rush of USD-strength, USD/JPY has similarly bounced from yesterday’s low. That low printed at the 61.8% Fibonacci retracement of the July-September sell-off and this comes a few trading days after the 76.4% retracement of that same move helped to set the high.
EUR/JPY, on the other hand, could have a more bearish appeal and that’s something that can align with Yen-strength scenarios, particularly if that policy review next month has a hawkish tilt. Below, I go over each of the three pairs in more depth.
USD/JPY
The US Dollar ran into some big resistance last week at the 107.00 handle and for the first two days of this week, that continued into a pullback. But bulls were back this morning and that’s pushed DXY back into that prior gap. Along the way, USD/JPY has mirrored that strength well, so I’m considering this a setup for Yen-weakness scenarios and that would likely need to be coupled with some expectation of the US Dollar pushing deeper into resistance and perhaps even breaking above the two-year range.
At this point, there’s reference from the Fibonacci retracement produced by the July-September sell-off. The 76.4% retracement of that mov held the highs last week and then the 61.8% retracement held the lows yesterday, plotted at 153.41.
USD/JPY Daily Price Chart
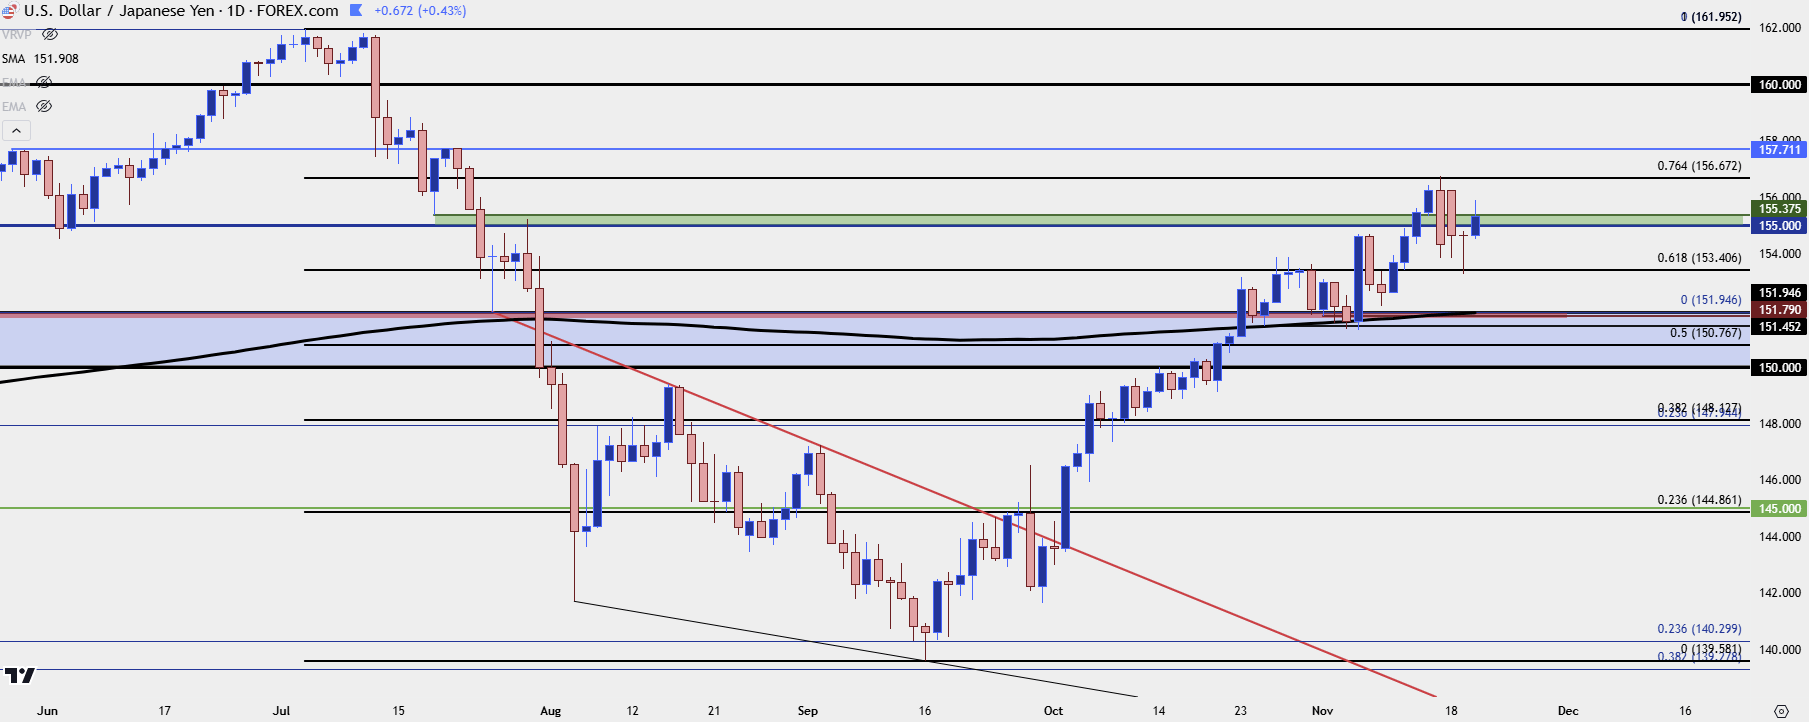 Chart prepared by James Stanley, USD/JPY on Tradingview
USD/JPY Shorter-Term
From the four-hour chart there’s been an element of defense around prior resistance and that aligns with the 155.00 psychological level. This would be the spot that ideally buyers would hold support at or above to keep the door open for topside continuation scenarios.
USD/JPY Four-Hour Chart
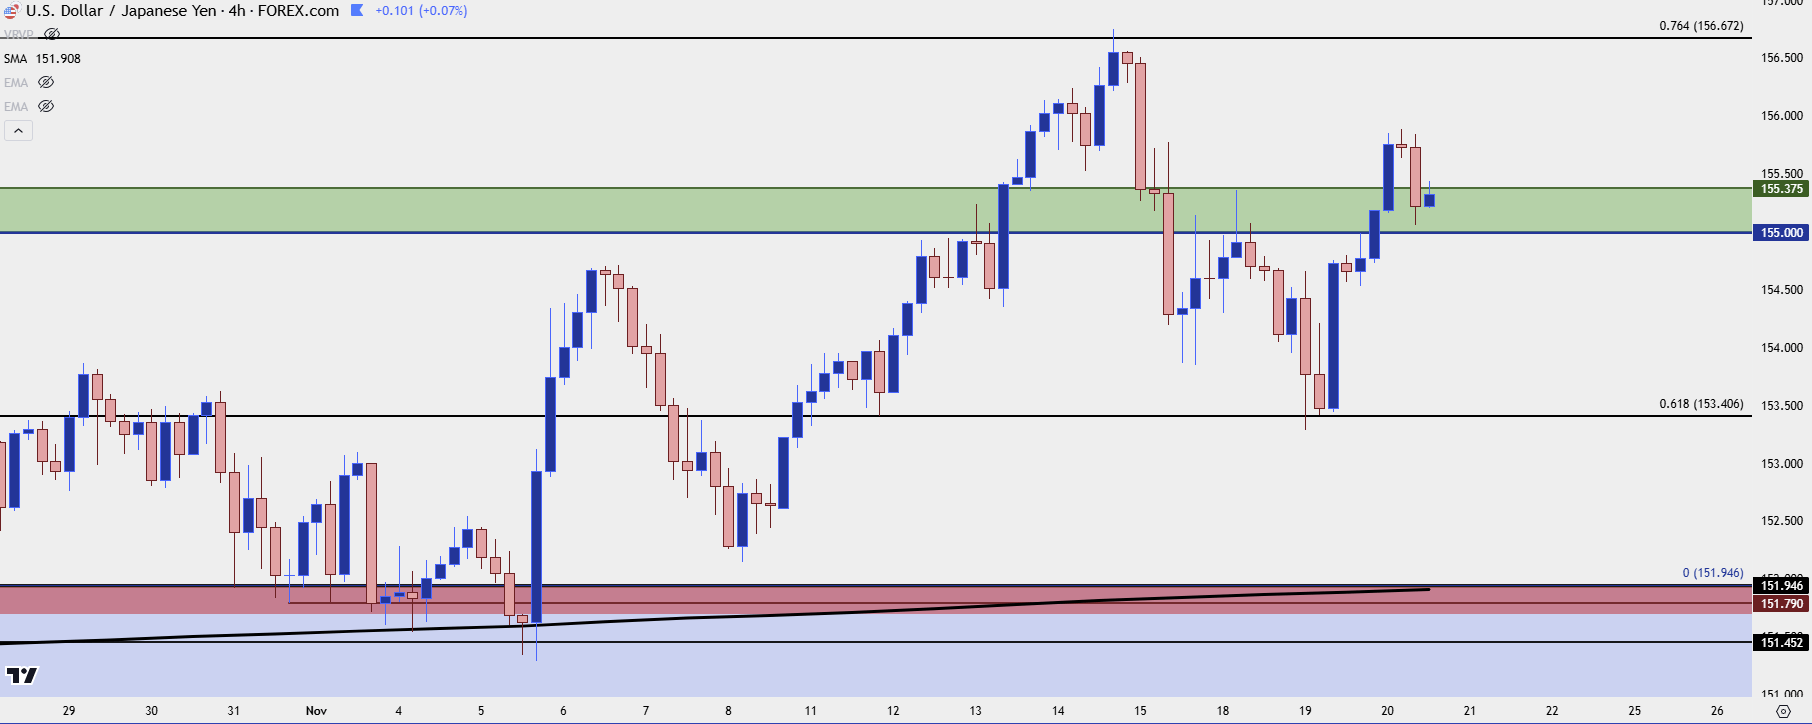 Chart prepared by James Stanley, USD/JPY on Tradingview
GBP/JPY
While there’s a couple of different fluid items on the above setup of USD/JPY, GBP/JPY presents a similar scenario of interest for Yen-weakness backdrops. The British Pound was hammered against the US Dollar in early-Q4 trade, but the move was a bit more controlled in GBP/JPY. It’s what’s happened over the past couple days that’s of greater interest, however.
The pair pulled back to test a level at 193.61 yesterday, which is the bottom of a gap from back in 2008. I looked at this in the webinar shortly after the support test and bulls continued to go to work after, driving a trough-to-peak move of more than 400 pips. The top of that gap at 198.08 has had some recent pull, as well, as this helped to set the weekly high over the past four weeks.
GBP/JPY Monthly Chart
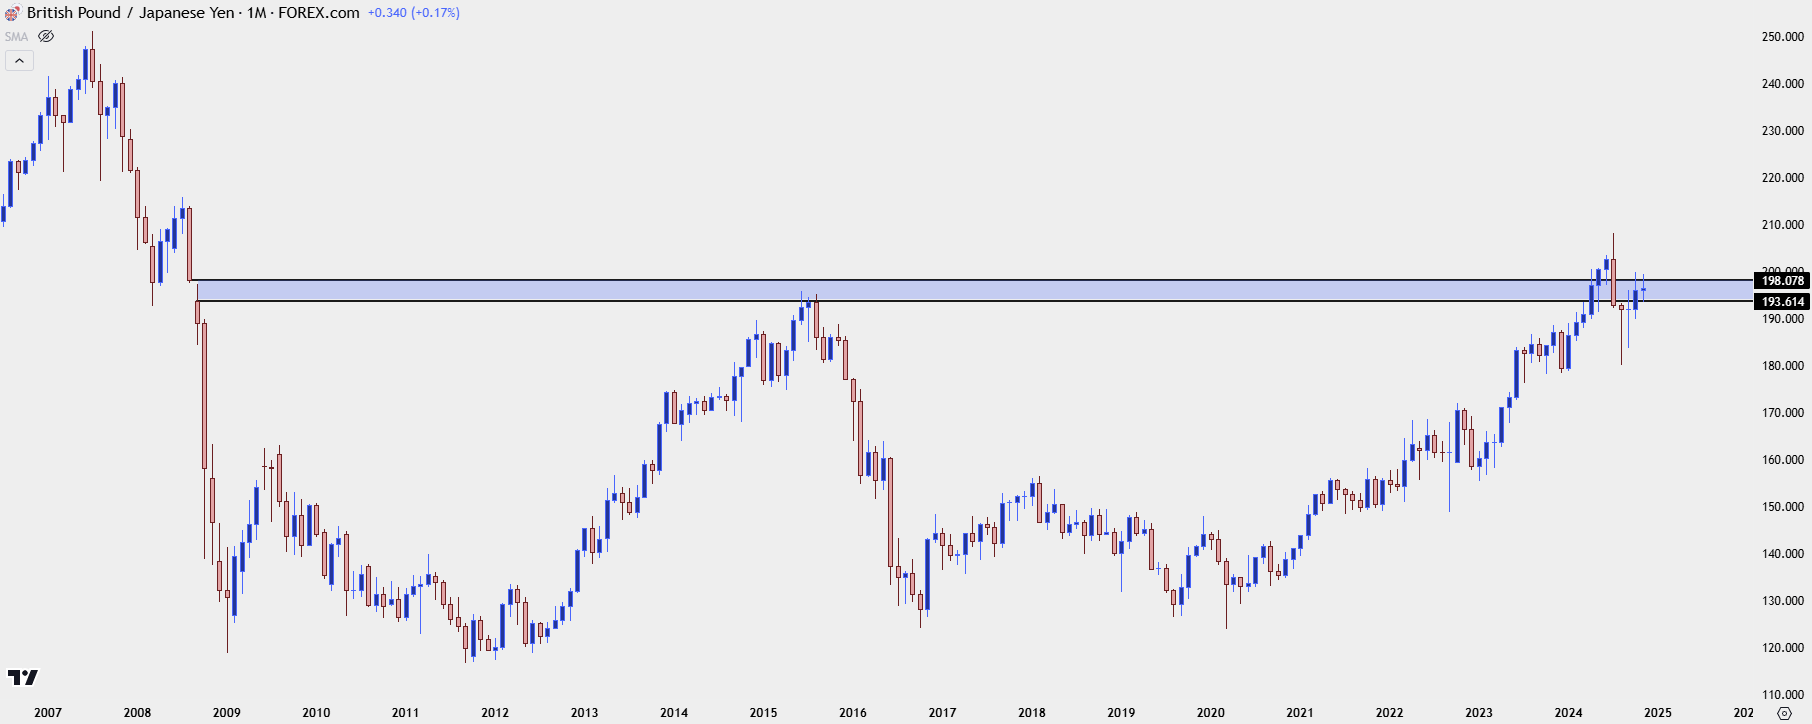 Chart prepared by James Stanley, GBP/JPY on Tradingview
From the weekly, taking a simple look at the matter with that prior gap, we can see where that 198.08 level was a stumbling block for bulls over a four-week period. But, the pullback from that has so far held support at 193.61 and there’s been a re-test of the 200-day moving average that’s also had some interesting scenarios of resistance-turned-support of late.
GBP/JPY Weekly Chart
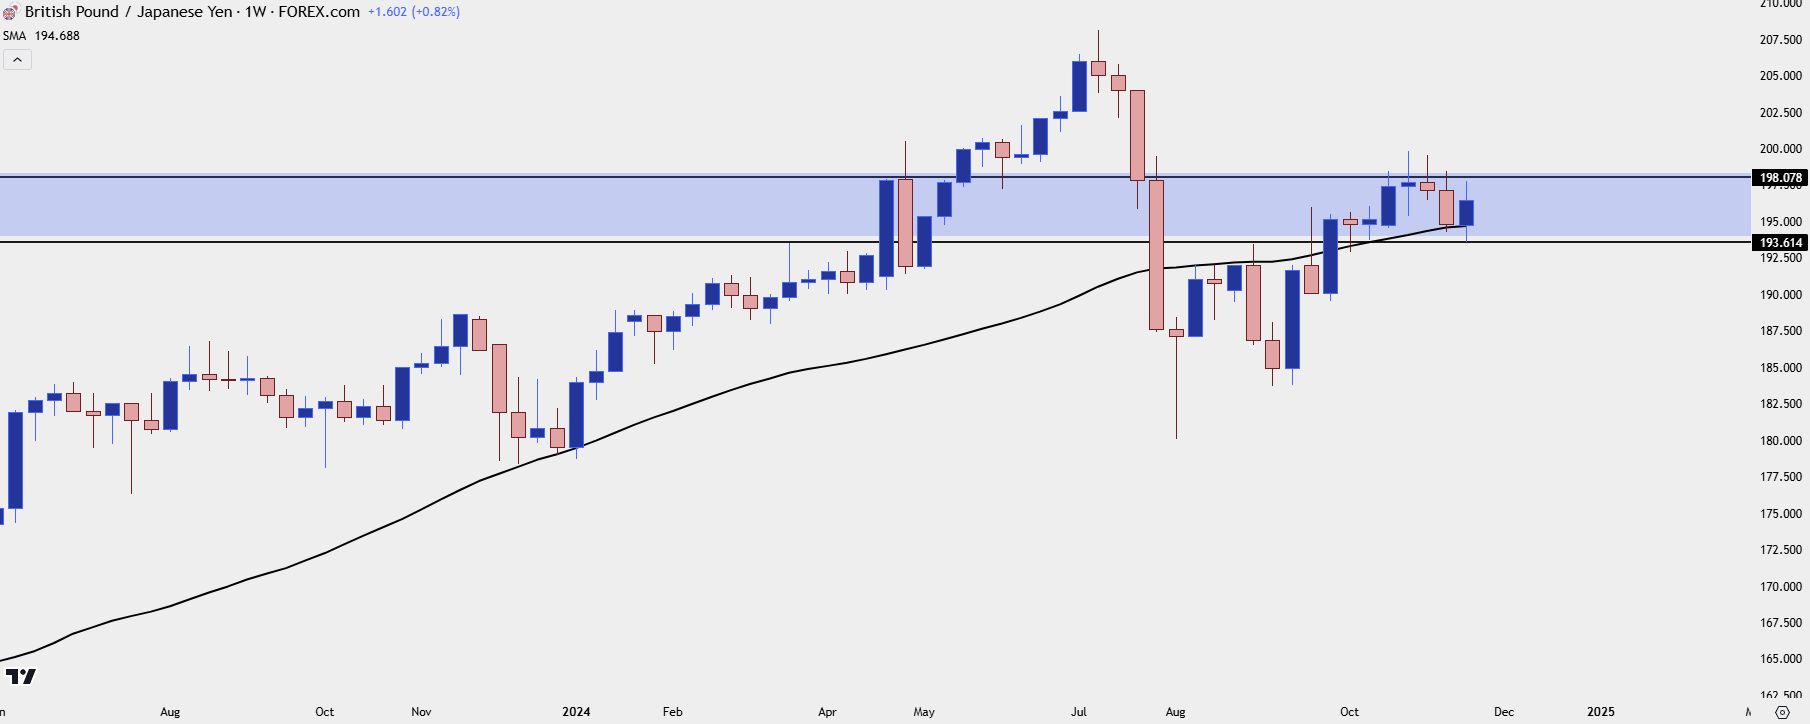 Chart prepared by James Stanley, GBP/JPY on Tradingview
GBP/JPY Near-Term
It’s the four-hour chart where this one gets more interesting, as the bounce from 193.61 has since pulled back, and so far, we have support holding at prior swing resistance of 196.15.
GBP/JPY Four-Hour Chart
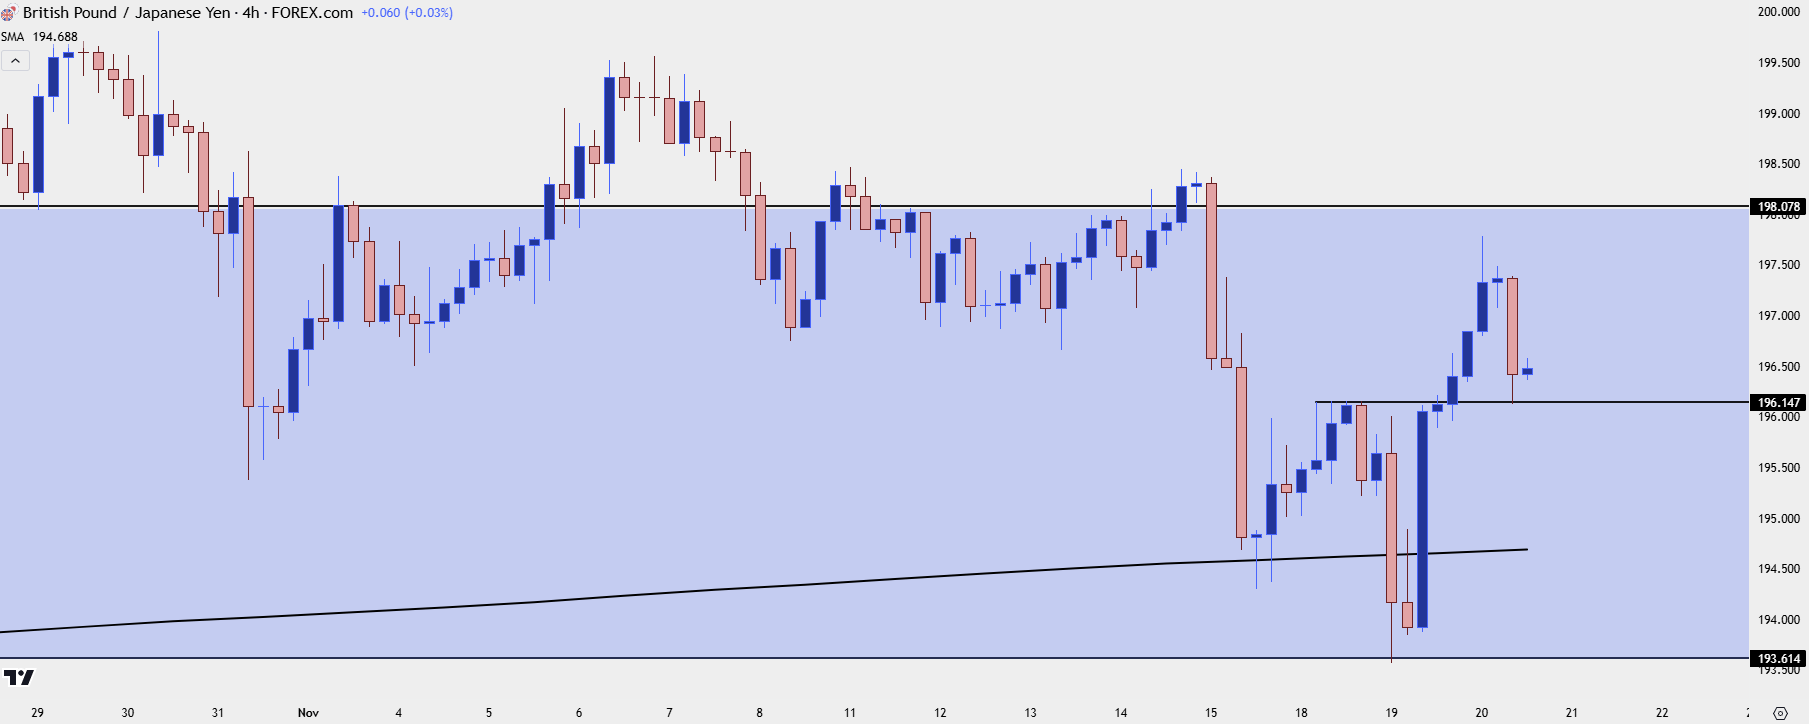 Chart prepared by James Stanley, GBP/JPY on Tradingview
EUR/JPY
While both USD/JPY and GBP/JPY above are trading above their 200-day moving averages with recent support tests or inflections, EUR/JPY tested its own 200-dma last week and that held as resistance. That was also confluent with the 165.00 level and then yesterday, when USD/JPY was testing support at 153.41 and GBP/JPY was testing 193.61, EUR/JPY set a fresh lower-low with a breach of the 161.93 prior support level.
While there’s been a bounce here, as well, the current daily bar is still red whereas both GBP/JPY and USD/JPY are showing green daily candle bodies, at this point.
For Yen-strength scenarios, EUR/JPY appears a bit more promising than either of the pairs looked at above. Also notice that confluent resistance at 165.00, as I’ll expand on that when I take a shorter-term look at the matter next.
EUR/JPY Daily Price Chart
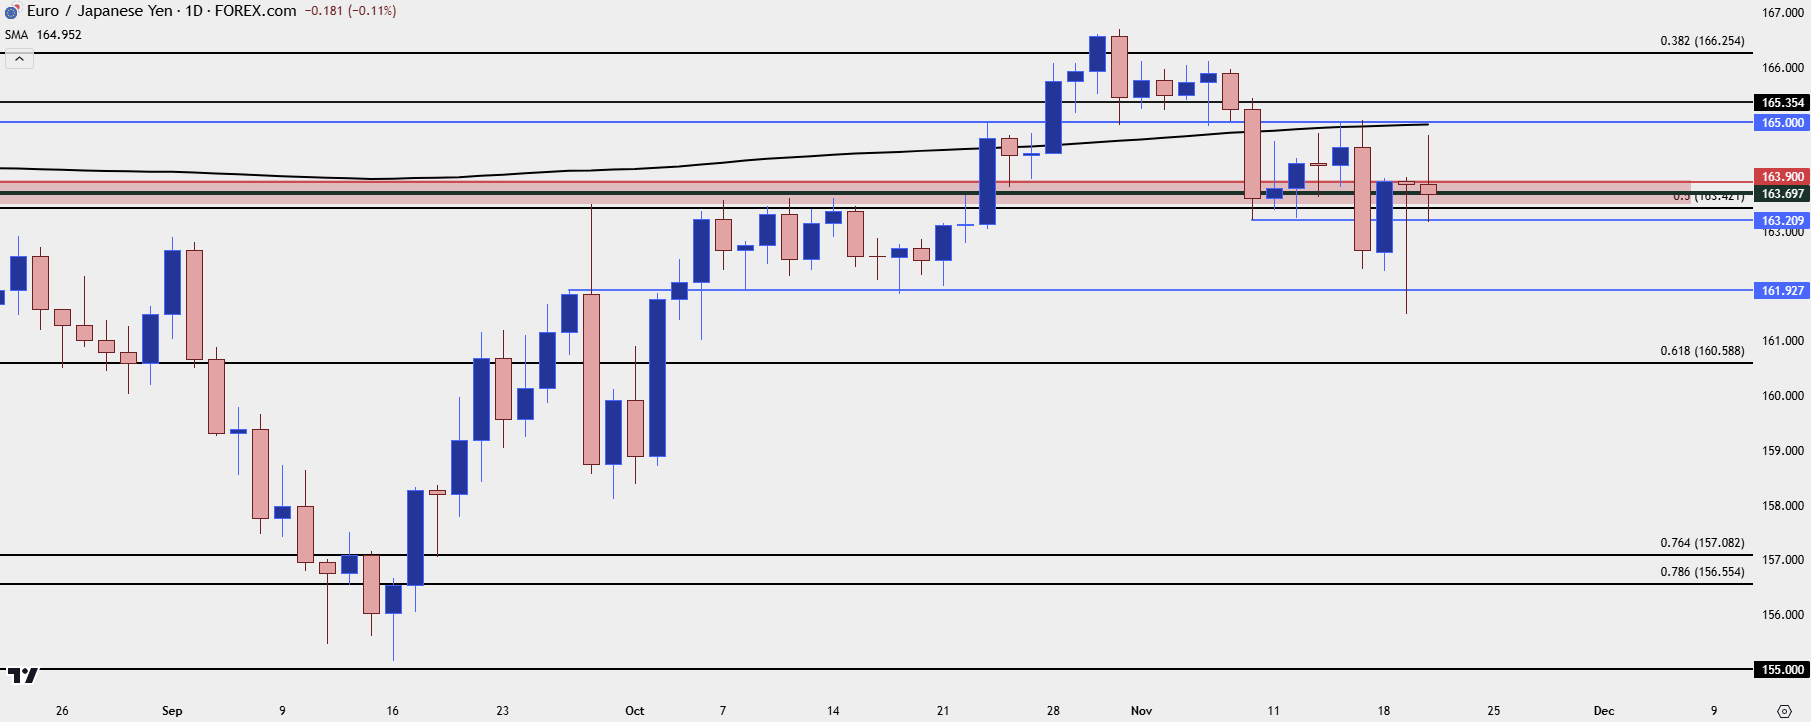 Chart prepared by James Stanley, EUR/JPY on Tradingview
EUR/JPY Shorter-Term
Another difference here is that while both USD/JPY and GBP/JPY above have pulled back to support at prior resistance, EUR/JPY has dug a bit deeper on a relative basis. The lower-high before yesterday’s sell-off was at 163.90 and this morning, price tested all the way down to 163.21. The bounce from that I testing a swing level at 163.70 but it’s the 163.90 level lurking above that would be an ideal spot for bears to hold to keep the door open for shorter-term bearish momentum.
But, on a broader basis, it was 165.00 where bulls failed last week and that’s the price that would need to remain respected to keep the door open to deeper bearish potential. This still plots very near the 200-day moving average so there’s still an element of confluent taking place.
EUR/JPY Four-Hour Price Chart
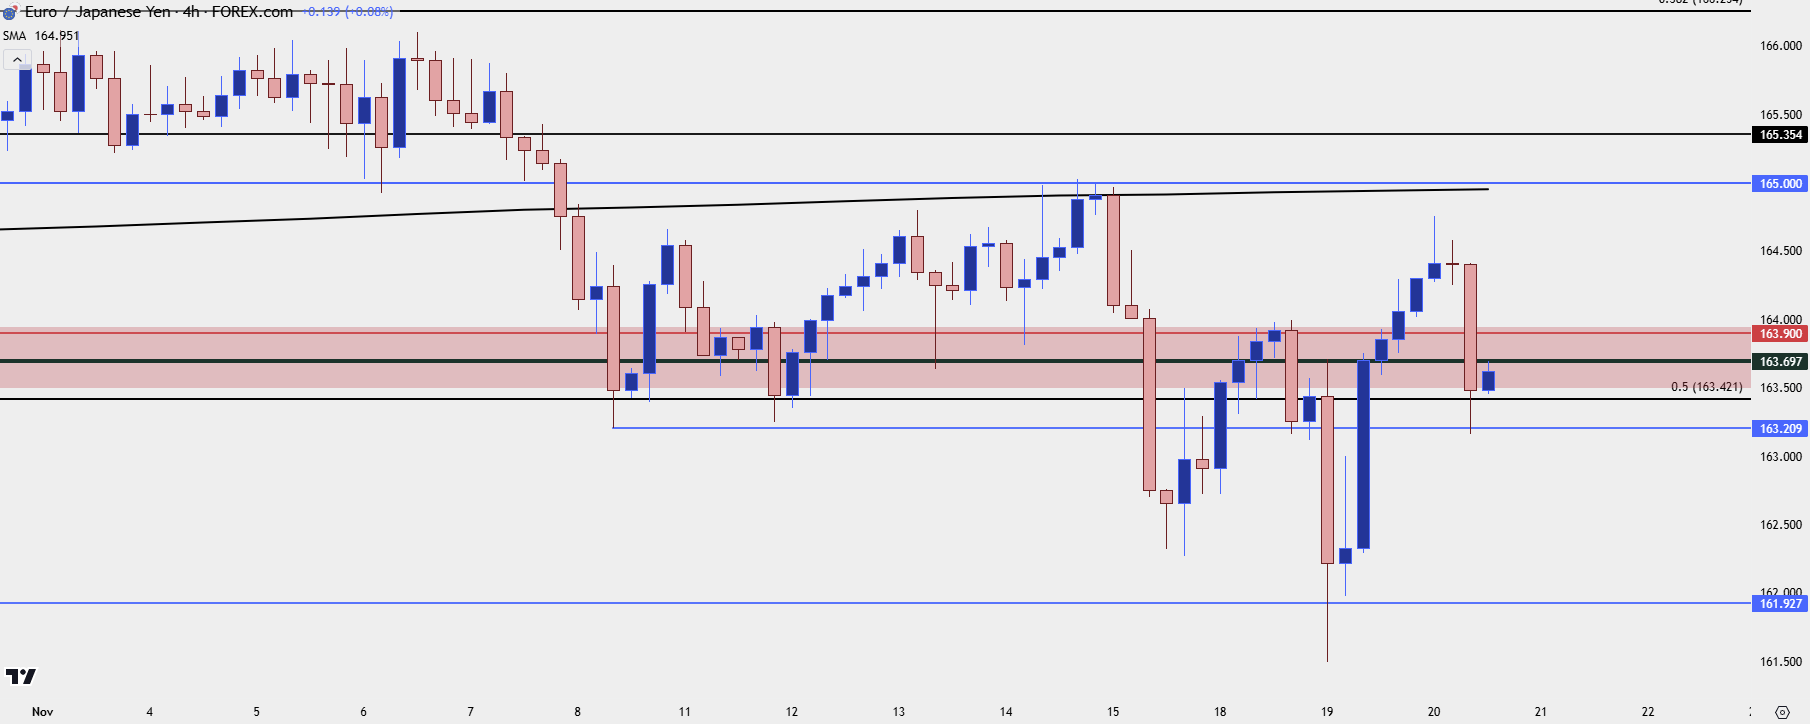 Chart prepared by James Stanley, EUR/JPY on Tradingview
--- written by James Stanley, Senior Strategist
Japanese Yen Talking Points:
- USD/JPY has continued to build structure within the Fibonacci retracement taken from the July-September sell-off, with both last week’s high and this week’s low printing at retracement levels. I looked at a Fibonacci level in last week’s Yen analysis article that has since held the highs from the breakout, and that remains a spot of interest moving forward.
- EUR/JPY has held up well despite the drubbing in the Euro elsewhere, but there’s been a build of lower-lows and lower-highs that makes the pair more attractive for Yen-strength scenarios.
- GBP/JPY was featured in yesterday’s webinar and the pair continues to show inflections from the gap drawn from the 2008 Financial Collapse, with 193.61 helping to set yesterday’s low and leading into a strong bounce.
The next big fundamental item for the Japanese Yen is expected in about a month with the bank’s policy review. This could have sway over whether the bank takes a more-hawkish turn into 2025 but, at this point, Yen-weakness has held fairly well in a variety of venues.
USD/JPY continues to track DXY themes well and given this morning’s rush of USD-strength, USD/JPY has similarly bounced from yesterday’s low. That low printed at the 61.8% Fibonacci retracement of the July-September sell-off and this comes a few trading days after the 76.4% retracement of that same move helped to set the high.
EUR/JPY, on the other hand, could have a more bearish appeal and that’s something that can align with Yen-strength scenarios, particularly if that policy review next month has a hawkish tilt. Below, I go over each of the three pairs in more depth.
USD/JPY
The US Dollar ran into some big resistance last week at the 107.00 handle and for the first two days of this week, that continued into a pullback. But bulls were back this morning and that’s pushed DXY back into that prior gap. Along the way, USD/JPY has mirrored that strength well, so I’m considering this a setup for Yen-weakness scenarios and that would likely need to be coupled with some expectation of the US Dollar pushing deeper into resistance and perhaps even breaking above the two-year range.
At this point, there’s reference from the Fibonacci retracement produced by the July-September sell-off. The 76.4% retracement of that mov held the highs last week and then the 61.8% retracement held the lows yesterday, plotted at 153.41.
USD/JPY Daily Price Chart
USD/JPY Shorter-Term
From the four-hour chart there’s been an element of defense around prior resistance and that aligns with the 155.00 psychological level. This would be the spot that ideally buyers would hold support at or above to keep the door open for topside continuation scenarios.
USD/JPY Four-Hour Chart
GBP/JPY
While there’s a couple of different fluid items on the above setup of USD/JPY, GBP/JPY presents a similar scenario of interest for Yen-weakness backdrops. The British Pound was hammered against the US Dollar in early-Q4 trade, but the move was a bit more controlled in GBP/JPY. It’s what’s happened over the past couple days that’s of greater interest, however.
The pair pulled back to test a level at 193.61 yesterday, which is the bottom of a gap from back in 2008. I looked at this in the webinar shortly after the support test and bulls continued to go to work after, driving a trough-to-peak move of more than 400 pips. The top of that gap at 198.08 has had some recent pull, as well, as this helped to set the weekly high over the past four weeks.
GBP/JPY Monthly Chart
From the weekly, taking a simple look at the matter with that prior gap, we can see where that 198.08 level was a stumbling block for bulls over a four-week period. But, the pullback from that has so far held support at 193.61 and there’s been a re-test of the 200-day moving average that’s also had some interesting scenarios of resistance-turned-support of late.
GBP/JPY Weekly Chart
GBP/JPY Near-Term
It’s the four-hour chart where this one gets more interesting, as the bounce from 193.61 has since pulled back, and so far, we have support holding at prior swing resistance of 196.15.
GBP/JPY Four-Hour Chart
EUR/JPY
While both USD/JPY and GBP/JPY above are trading above their 200-day moving averages with recent support tests or inflections, EUR/JPY tested its own 200-dma last week and that held as resistance. That was also confluent with the 165.00 level and then yesterday, when USD/JPY was testing support at 153.41 and GBP/JPY was testing 193.61, EUR/JPY set a fresh lower-low with a breach of the 161.93 prior support level.
While there’s been a bounce here, as well, the current daily bar is still red whereas both GBP/JPY and USD/JPY are showing green daily candle bodies, at this point.
For Yen-strength scenarios, EUR/JPY appears a bit more promising than either of the pairs looked at above. Also notice that confluent resistance at 165.00, as I’ll expand on that when I take a shorter-term look at the matter next.
EUR/JPY Daily Price Chart
EUR/JPY Shorter-Term
Another difference here is that while both USD/JPY and GBP/JPY above have pulled back to support at prior resistance, EUR/JPY has dug a bit deeper on a relative basis. The lower-high before yesterday’s sell-off was at 163.90 and this morning, price tested all the way down to 163.21. The bounce from that I testing a swing level at 163.70 but it’s the 163.90 level lurking above that would be an ideal spot for bears to hold to keep the door open for shorter-term bearish momentum.
But, on a broader basis, it was 165.00 where bulls failed last week and that’s the price that would need to remain respected to keep the door open to deeper bearish potential. This still plots very near the 200-day moving average so there’s still an element of confluent taking place.
EUR/JPY Four-Hour Price Chart
--- written by James Stanley, Senior Strategist
Related tags:
Latest market news




Open an account in minutes
Experience award-winning platforms with fast and secure execution, and enjoy tight spreads from 0.5 pts on FX and 0.3 pts on indices.
Economic calendar
Web Trader platform
Our sophisticated web-based platform is packed with features.
Related articles
Silver's bullish breakout case builds as bond yields retreat
The Democratic blue wave has sent crude and Treasury yields sharply lower, improving the outlook for precious metals. With gold already breaking higher, could silver be next?
Gold Reclaims $4,000, Bulls Eye Reversal with Seasonality Tailwind
Gold futures rebound above $4,000 as falling US yields, improving sentiment and bullish seasonality raise hopes of a significant reversal.

Swiss Franc Short-term Outlook: USD/CHF Selloff Nears Critical Support Ahead of NFP 11 4 2026
USD/CHF bears are closing in on critical trend support, with the next reaction likely to determine whether the October decline has further to run.

This report is intended for general circulation only. It should not be construed as a recommendation, or an offer (or solicitation of an offer) to buy or sell any financial products. The information provided does not take into account your specific investment objectives, financial situation or particular needs. Before you act on any recommendation that may be contained in this report, independent advice ought to be sought from a financial adviser regarding the suitability of the investment product, taking into account your specific investment objectives, financial situation or particular needs.
StoneX Financial Pte. Ltd., may distribute reports produced by its respective foreign entities or affiliates within the StoneX group of companies or third parties pursuant to an arrangement under Regulation 32C of the Financial Advisers Regulations. Where the report is distributed to a person in Singapore who is not an accredited investor, expert investor or an institutional investor (as defined in the Securities Futures Act), StoneX Financial Pte. Ltd. accepts legal responsibility to such persons for the contents of the report only to the extent required by law. Singapore recipients should contact StoneX Financial Pte. Ltd. at 6826 9988 for matters arising from, or in connection with the report.
In the case of all other recipients of this report, to the extent permitted by applicable laws and regulations neither StoneX Financial Pte. Ltd. nor its associated companies will be responsible or liable for any loss or damage incurred arising out of, or in connection with, any use of the information contained in this report and all such liability is hereby expressly disclaimed. No representation or warranty is made, express or implied, that the content of this report is complete or accurate.
StoneX Financial Pte. Ltd. is not under any obligation to update this report.
Trading CFDs carries a high level of risk that may not be suitable for some investors. Consider your investment objectives, level of experience, financial resources, risk appetite and other relevant circumstances carefully. The possibility exists that you could lose some or all of your investments, including your initial deposits. If in doubt, please seek independent expert advice. Visit www.forex.com/en-sg/terms-and-policies for the complete Risk Disclosure Statement.