



Last Week in Markets — Risk-On Rebound on Trade Hopes; Earnings in Focus
Global equities rallied last week as optimism over a US–China trade framework and upbeat tech earnings lifted sentiment. The S&P 500 and Nasdaq hit record highs, while the Nikkei saw its best monthly gain since 1990. The DAX rebounded from 24,000, testing resistance near 24,125 in a cautiously bullish setup. Powell’s dovish tone and softer inflation supported risk assets, while gold and Treasuries eased as havens unwound. This week’s focus: ISM data, RBA and BoE decisions, and another packed earnings calendar.
Share this:

Last Week in Markets — Wrap & Week Ahead
Date: Monday, 3 Nov 2025
Weekly Wrap (global)
- Equities: Risk-on returned as a tentative US–China trade framework lifted sentiment. S&P 500/Nasdaq printed fresh highs early in the week; Asia/Europe rallied before some month-end trimming. Nikkei +16% in Oct, best since 1990.
- Leadership: Tech outperformed (strong AMZN/AAPL prints; AI/semis bid). “Mag 7” remained the focal cohort.
- Rates & FX: Haven unwind pushed 10y USTs toward 4%; USD edged lower on softer inflation + dovish Powell hints.
- Havens: Gold –2–3%, Treasuries softer on rotation into equities.
- UK: FTSE 100 snapped a 9-day streak (–0.2%); GBP/gilts broadly steady.
DAX Technical Analysis 4 hour
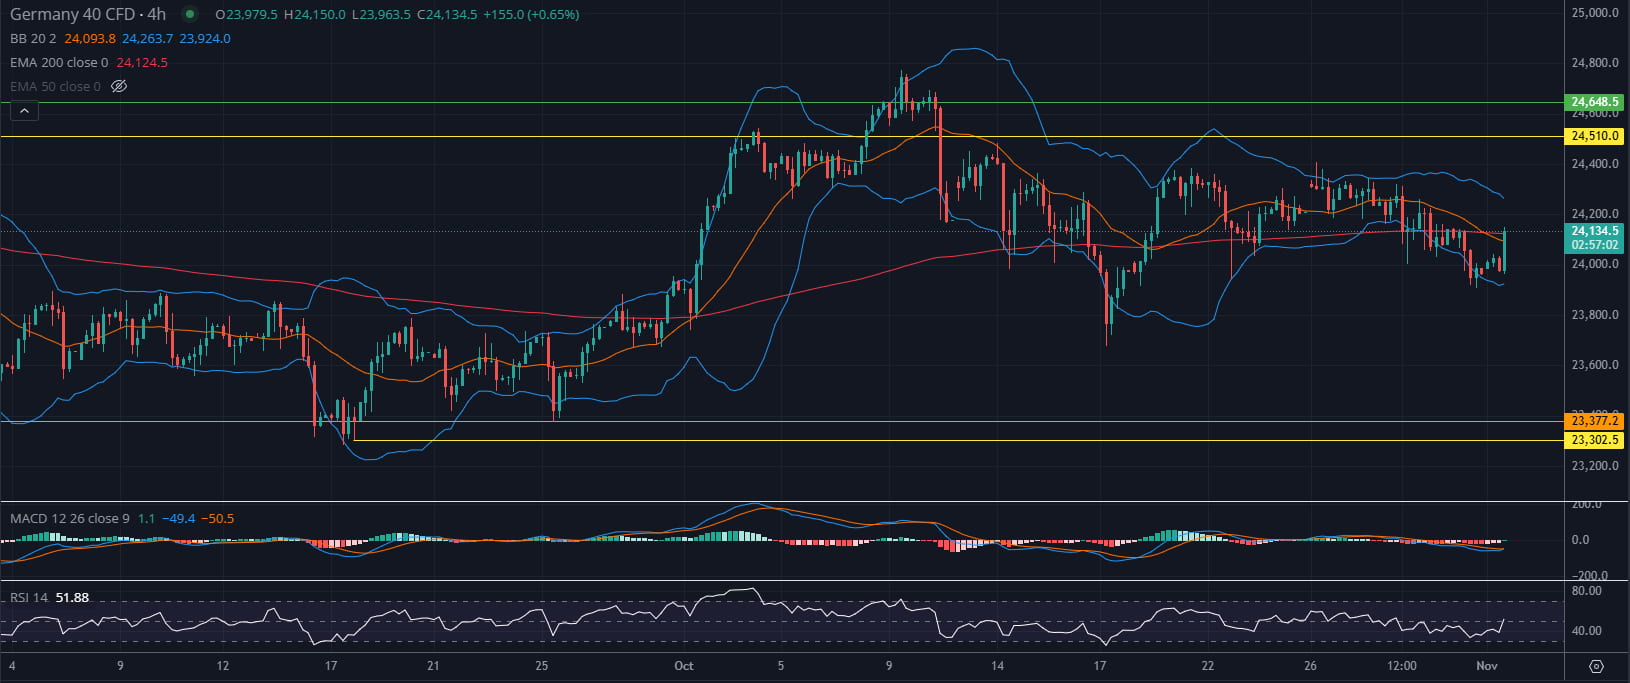
The Germany 40 CFD (4H) has bounced from the 24,000 area, regaining short-term traction after a period of consolidation. Price is now testing resistance near the 50 EMA (24,125), with the 200 EMA just above at 24,263, creating a compression zone. The RSI (52) has turned slightly higher, showing mild bullish momentum, while the MACD is flattening and hinting at a potential bullish crossover.
Immediate resistance stands at 24,350–24,510, followed by 24,648 (all-time high). Support remains firm at 24,000, then 23,800–23,650. A breakout above the moving average cluster would confirm short-term strength toward 24,500, while rejection here could keep the index range-bound. Overall tone: cautiously bullish rebound within a consolidating trend.
Macro Themes (highlights)
- China PMI (manufacturing): slipped 0.8 pts to 49.0 (6-month low). Orders and exports stayed contractionary; production dipped below 50. De-escalation in US–China trade could help orders. Despite PMI weakness, CSI 300 (EUR) up ~20% since April; consensus EPS +~10% next 12m. Chinese tech stocks remain structurally interesting (AI exposure, lower trade dependency).
- US energy use (structural): After ~20 years of flat/down usage, AI/data-centre load + onshoring likely to lift US energy demand again. Tailwinds for gas, selective oil/refining, and grid/clean-tech capex; long-run emissions path depends on mix.
- Earnings season (US): >50% of S&P mkt cap reported: ~80% beat sales, >80% beat EPS; avg EPS beat ~8% (Comm. Services ~16% standout). Tech guiding higher on cloud/AI capex (near-term margin drag, positive demand signal). Cyclicals-consumption more mixed. Base case finish: Sales +7.5%, EPS +12.5% y/y. Sector dispersion matters.
What to Watch This Week
Central Banks & Data
- Mon 3 Nov (US): ISM Manufacturing (Oct) cons 49.4 (from 49.1) — signals milder contraction; ISM Services (Wed) eyed to re-enter expansion.
- Tue (AU): RBA expected hold at 3.60%; prior hot CPI pares easing hopes; watch Gov. Bullock tone (hawkish risk → AUD support).
- Thu (UK): BoE decision hold at 4.00% base case (market ~70%); 30% odds of –25 bps. Inflation 3.8% y/y still sticky; focus on vote split and guidance ahead of Autumn Budget.
Earnings — Heavy slate
- Europe (Stoxx 600, 99 co’s): Ryanair, BP, Ferrari, Siemens Healthineers, Vonovia, Novo Nordisk, BMW, Ørsted, Vestas, Deutsche Post, AstraZeneca, Commerzbank, Rheinmetall, Daimler Truck.
- US (S&P 500, 136 co’s): Berkshire, Pfizer, Marriott, AMD, McDonald’s, Qualcomm, Moderna, Ralph Lauren, Airbnb, et al.
- Asia: Nintendo, Toyota, SoftBank, Honda and peers; HKEX, Galaxy Ent.; India: Airtel, SBI, Sun Pharma, Hindalco, Trent etc.
Near-term diary (times are local where relevant)
Mon, Nov 3
- PLTR post (exp move $17.85; EPS 0.12) · ON pre (±$5.75; 0.59) · HIMS post (±$5.67; 0.09)
Tue, Nov 4
- AMD post (±$19.85; 0.97) · SHOP pre (±$16.74; 0.24) · UBER pre (±$6.06; 0.67)
- ANET, AMGN, SMCI, PINS, RIVN, KGC post; BP, PFE pre
Wed, Nov 5
- NVO, MCD pre · QCOM, ARM, APP, FTNT, SNAP, LYFT, IONQ, JOBY, APP post · Unity pre
Thu, Nov 6
- WBD, DDOG pre · ABNB, AFRM, DKNG, MP, GSAT, TTD post · MRNA pre
Positioning Thoughts (tactical)
- Equities: Momentum remains tech-led; lean barbell (mega-cap AI + quality defensives). Watch for profit-taking into central-bank risk.
- Rates/FX: If ISM/Services rebound, UST 10y could re-test 4%+; USD path tied to data; GBP sensitive to BoE split and guidance.
- Commodities: Oil headline-driven (sanctions/supply); medium-term IEA surplus ’26 tempers inflation impulse. Gold likely range-trade while real yields firm.
- China/Asia: Macro mixed (PMI soft) but policy détente + AI supply chain remain supports; prefer China tech/platforms over heavy cyclicals.
Latest market news




Open an account in minutes
Experience award-winning platforms with fast and secure execution, and enjoy tight spreads from 0.5 pts on FX and 0.3 pts on indices.
Economic calendar
Web Trader platform
Our sophisticated web-based platform is packed with features.
Related articles
Silver's bullish breakout case builds as bond yields retreat
The Democratic blue wave has sent crude and Treasury yields sharply lower, improving the outlook for precious metals. With gold already breaking higher, could silver be next?
Swiss Franc Short-term Outlook: USD/CHF Selloff Nears Critical Support Ahead of NFP 11 4 2026
USD/CHF bears are closing in on critical trend support, with the next reaction likely to determine whether the October decline has further to run.

US Midterm Fallout: What Does the “Blue Tsunami” Mean for the S&P 500?
Democrats made sweeping gains in the US midterm elections, winning control of both the House and Senate - what does it mean for the S&P 500 and the AI trade?

This report is intended for general circulation only. It should not be construed as a recommendation, or an offer (or solicitation of an offer) to buy or sell any financial products. The information provided does not take into account your specific investment objectives, financial situation or particular needs. Before you act on any recommendation that may be contained in this report, independent advice ought to be sought from a financial adviser regarding the suitability of the investment product, taking into account your specific investment objectives, financial situation or particular needs.
StoneX Financial Pte. Ltd., may distribute reports produced by its respective foreign entities or affiliates within the StoneX group of companies or third parties pursuant to an arrangement under Regulation 32C of the Financial Advisers Regulations. Where the report is distributed to a person in Singapore who is not an accredited investor, expert investor or an institutional investor (as defined in the Securities Futures Act), StoneX Financial Pte. Ltd. accepts legal responsibility to such persons for the contents of the report only to the extent required by law. Singapore recipients should contact StoneX Financial Pte. Ltd. at 6826 9988 for matters arising from, or in connection with the report.
In the case of all other recipients of this report, to the extent permitted by applicable laws and regulations neither StoneX Financial Pte. Ltd. nor its associated companies will be responsible or liable for any loss or damage incurred arising out of, or in connection with, any use of the information contained in this report and all such liability is hereby expressly disclaimed. No representation or warranty is made, express or implied, that the content of this report is complete or accurate.
StoneX Financial Pte. Ltd. is not under any obligation to update this report.
Trading CFDs carries a high level of risk that may not be suitable for some investors. Consider your investment objectives, level of experience, financial resources, risk appetite and other relevant circumstances carefully. The possibility exists that you could lose some or all of your investments, including your initial deposits. If in doubt, please seek independent expert advice. Visit www.forex.com/en-sg/terms-and-policies for the complete Risk Disclosure Statement.