



Nasdaq 100 Analysis: Will new all-time highs continue to appear?
The week starts on a positive note for the Nasdaq 100, as the first session shows a gain of more than 1.5%, with price moving closer to the never-before-seen psychological area of 30,000 points. This move continues to reinforce the idea that the buying bias remains relevant in the short term.
Share this:

The week starts on a positive note for the Nasdaq 100, as the first session shows a gain of more than 1.5%, with price moving closer to the never-before-seen psychological area of 30,000 points. This move continues to reinforce the idea that the buying bias remains relevant in the short term.
Buying pressure has been supported mainly by optimism around the situation in the Middle East, which has boosted demand for risk assets. If this confidence environment holds, the dynamic could continue to support important buying pressure in Nasdaq over the coming trading sessions.


Middle East situation calms markets
The weekend was relevant for risk sentiment across global markets, after comments from President Trump suggested that a potential agreement with Iran was progressing in an orderly and constructive way. The market has reacted positively to the possibility of an agreement that could reduce geopolitical risk and eventually lead to the reopening of the Strait of Hormuz, which would lower the risk premium that has been present in recent weeks.
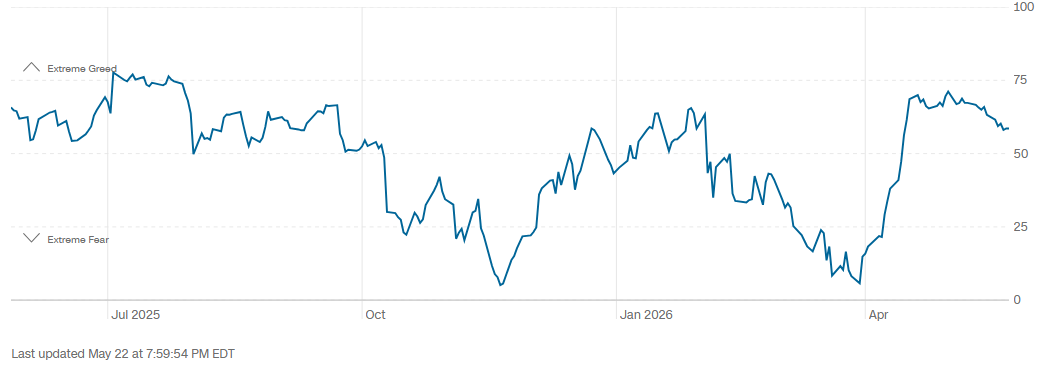
This situation has revived market optimism. This can be seen in the Fear and Greed Index, which has stopped declining near the 59-point area and remains stable within “greed” territory. Although this does not reflect an extraordinary recovery, it does show some stability in market confidence, which could once again support appetite for risk assets such as Nasdaq.
Source: CNN
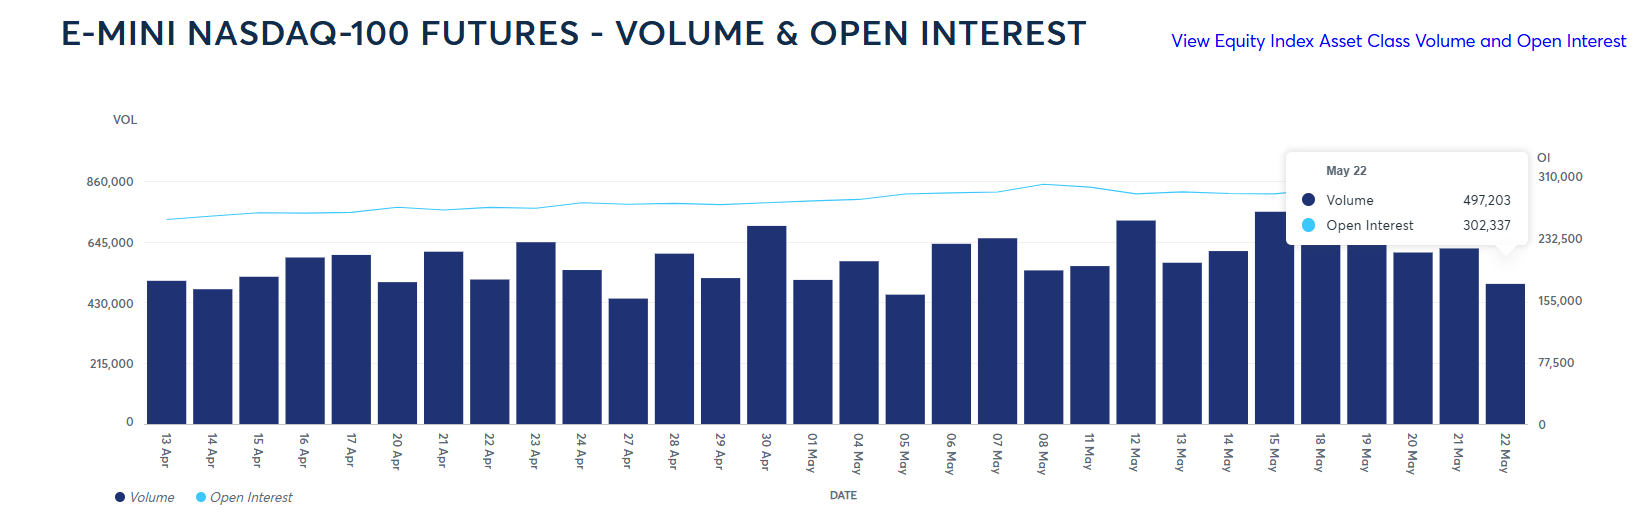
It is also important to note that demand in Nasdaq futures had already been showing stability in previous sessions. Trading volume as of the May 22 close remained near 500,000 contracts, while Open Interest, which measures the total number of open long and short positions, stood at monthly highs above 300,000 contracts.
The fact that this indicator continues to rise alongside the Nasdaq price suggests that long positions have continued to enter the market consistently in recent sessions. This already pointed to stable demand before the renewed optimism around the Middle East, meaning this environment could further reinforce the buying pressure seen toward the end of last week.
Source: CMEGROUP
With this in mind, in addition to the improvement in short-term confidence driven by optimism around the Middle East, Nasdaq had already been showing important advances in demand dynamics. For this reason, this renewed confidence could strengthen the demand already seen in previous sessions and help maintain relevant buying pressure in the short term.
How is the long-term dynamic holding up?
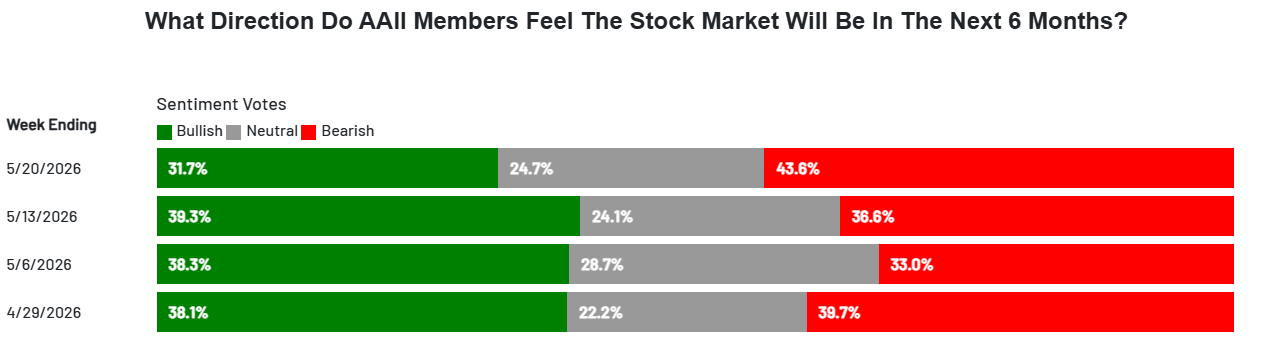
Beyond the current short-term confidence environment, the real challenge for the equity market remains long-term perception. According to the latest data from the AAII Investor Sentiment Survey, as of May 20, 2026, the six-month outlook for the stock market stands at 31.7% bullish, 24.7% neutral, and 43.6% bearish.
These figures show a meaningful decline in confidence compared with the week ending May 13 and suggest that, for now, the market still does not show an optimal confidence environment for equity indices such as Nasdaq over the coming months.
Source: AAII
This factor is key because, if long-term sentiment remains in bearish territory, it could be difficult to sustain consistent demand in the equity market. In this scenario, indices such as the Nasdaq 100 could face greater long-term doubts, which may also warn of potential phases of indecision over the coming weeks.
Technical outlook for the Nasdaq 100
Source: StoneX, Tradingview
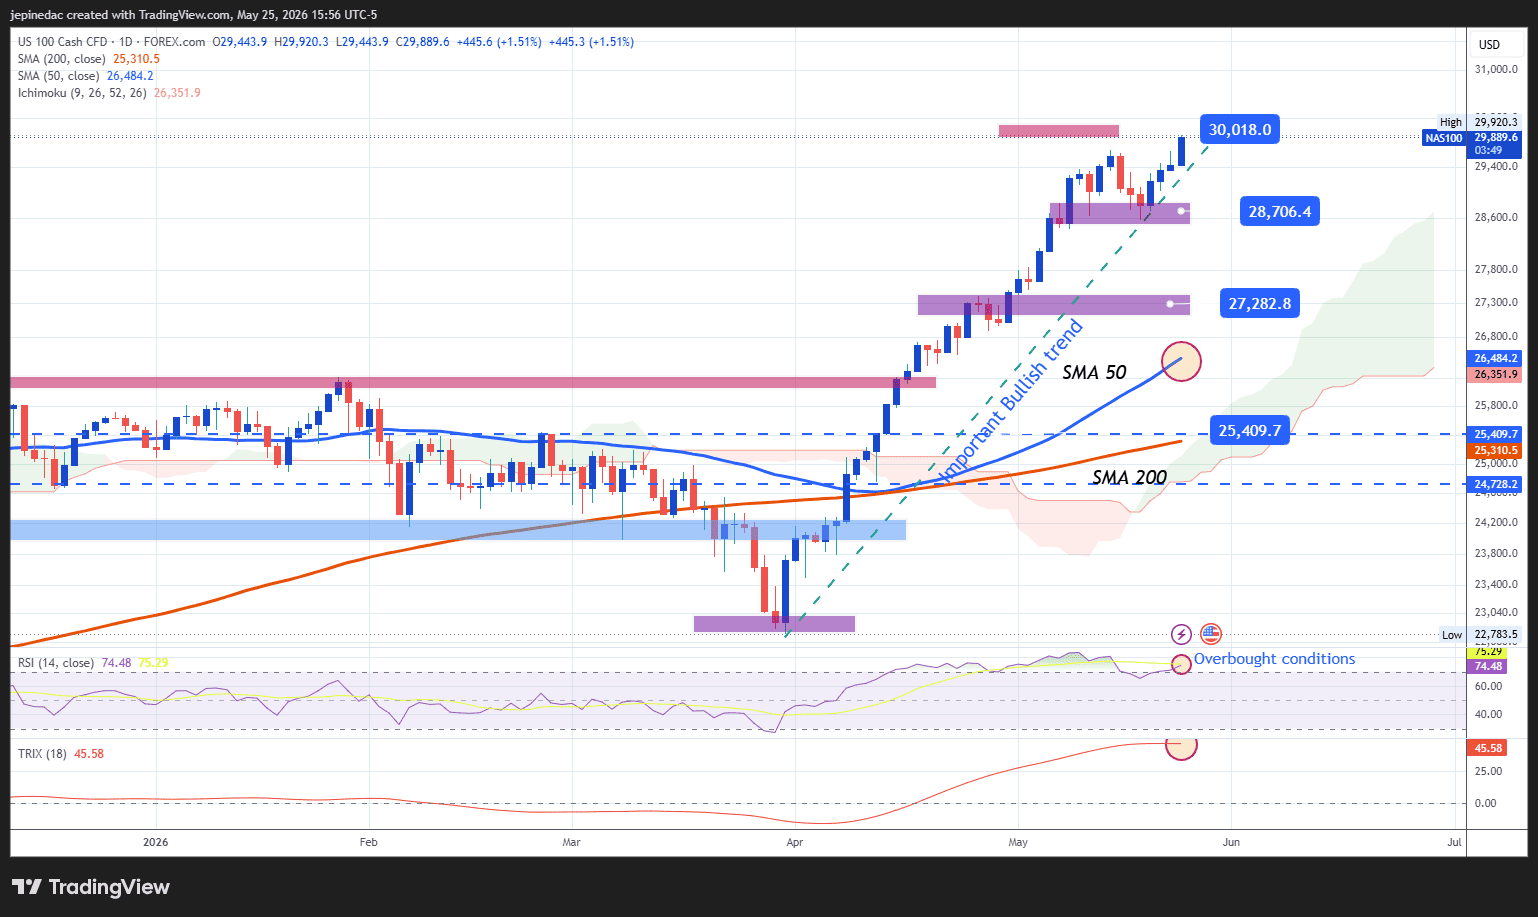
- Aggressive trendline remains intact: Recent Nasdaq price action has managed to maintain an aggressive bullish trendline that has been in place since the final days of March. As long as no relevant selling moves appear, this structure remains the most important technical factor to watch and could continue to dominate the index’s movements over the coming sessions. However, the speed at which price continues to reach new all-time highs may also leave room for potential bearish corrections in the short term.
- TRIX: The TRIX indicator continues to hold near relevant highs and, for now, shows no major declines. This indicates that the average strength of long-term exponential moving averages continues to reflect a relevant buying bias, which could remain part of Nasdaq price action as long as the TRIX line does not show significant weakness.
- RSI: The RSI continues to show that bullish momentum dominates the chart, but it also remains near the overbought zone around 70. This suggests an imbalance caused by excess short-term buying strength, which may warn of room for possible selling corrections over the coming sessions.
Key levels:
- 30,000 points – Relevant resistance: A key psychological level given the lack of historical references. A sustained breakout above this area could reinforce the bullish bias and allow the current trend to remain the dominant pattern on the chart in the coming sessions.
- 28,700 points – Near-term barrier: A recent retracement level that acts as the immediate support to watch. This area could serve as a tentative barrier if selling corrections begin to appear in the Nasdaq over the coming sessions.
- 27,280 points – Key support: A nearby low zone that stands as a relevant neutrality level. Price movements toward this area would not only put the current aggressive bullish trendline into question but could also open the door to a more consistent phase of indecision in the coming sessions.
Written by Julian Pineda, CFA, CMT – Market Analyst
Follow him on: @julianpineda25
Latest market news




Open an account in minutes
Experience award-winning platforms with fast and secure execution, and enjoy tight spreads from 0.5 pts on FX and 0.3 pts on indices.
Economic calendar
Web Trader platform
Our sophisticated web-based platform is packed with features.
Related articles

Stocks on Watch After CPI-Fueled Breakdown: SPX, Nasdaq, NVDA
Coming into the week there was an early case of divergence as AI and tech had started to show lag behind the S&P. That shift is growing more noticeable following a higher-than-expected CPI print.


Nasdaq 100 Forecast: NDX falls after hotter inflation data
U.S. stocks are falling after hotter-than-expected U.S. inflation data, which has lifted Fed rate hike expectations.


Dow Jones outlook: CPI, oil and yields put the rally to the test
US index futures rebounded in the first half of Wednesday’s session, along with European indices ahead of the release of US CPI. Some slightly dovish remarks from the Fed’s Williams seem to have helped sentiment a little, but whether those comments will be backed by data remains to be seen. While slightly hotter than expected inflation data shouldn’t be enough for markets to price in an October Fed hike with more than a coin flip probability, it can nonetheless reinforce expectations of further tightening later in the year.

This report is intended for general circulation only. It should not be construed as a recommendation, or an offer (or solicitation of an offer) to buy or sell any financial products. The information provided does not take into account your specific investment objectives, financial situation or particular needs. Before you act on any recommendation that may be contained in this report, independent advice ought to be sought from a financial adviser regarding the suitability of the investment product, taking into account your specific investment objectives, financial situation or particular needs.
StoneX Financial Pte. Ltd., may distribute reports produced by its respective foreign entities or affiliates within the StoneX group of companies or third parties pursuant to an arrangement under Regulation 32C of the Financial Advisers Regulations. Where the report is distributed to a person in Singapore who is not an accredited investor, expert investor or an institutional investor (as defined in the Securities Futures Act), StoneX Financial Pte. Ltd. accepts legal responsibility to such persons for the contents of the report only to the extent required by law. Singapore recipients should contact StoneX Financial Pte. Ltd. at 6826 9988 for matters arising from, or in connection with the report.
In the case of all other recipients of this report, to the extent permitted by applicable laws and regulations neither StoneX Financial Pte. Ltd. nor its associated companies will be responsible or liable for any loss or damage incurred arising out of, or in connection with, any use of the information contained in this report and all such liability is hereby expressly disclaimed. No representation or warranty is made, express or implied, that the content of this report is complete or accurate.
StoneX Financial Pte. Ltd. is not under any obligation to update this report.
Trading CFDs carries a high level of risk that may not be suitable for some investors. Consider your investment objectives, level of experience, financial resources, risk appetite and other relevant circumstances carefully. The possibility exists that you could lose some or all of your investments, including your initial deposits. If in doubt, please seek independent expert advice. Visit www.forex.com/en-sg/terms-and-policies for the complete Risk Disclosure Statement.