



Nasdaq 100 warning signs mount after brutal October
The Nasdaq 100 has printed a bearish monthly key reversal after a brutal October, with weak market breadth and heavy losses among AI beneficiaries raising the risk of further downside.
Share this:

- Nasdaq 100 prints bearish monthly key reversal after sizeable rally
- Weak breadth exposes narrow AI-driven rally
- AI beneficiaries suffer declines exceeding 30%
- Historical patterns put 200DMA in focus
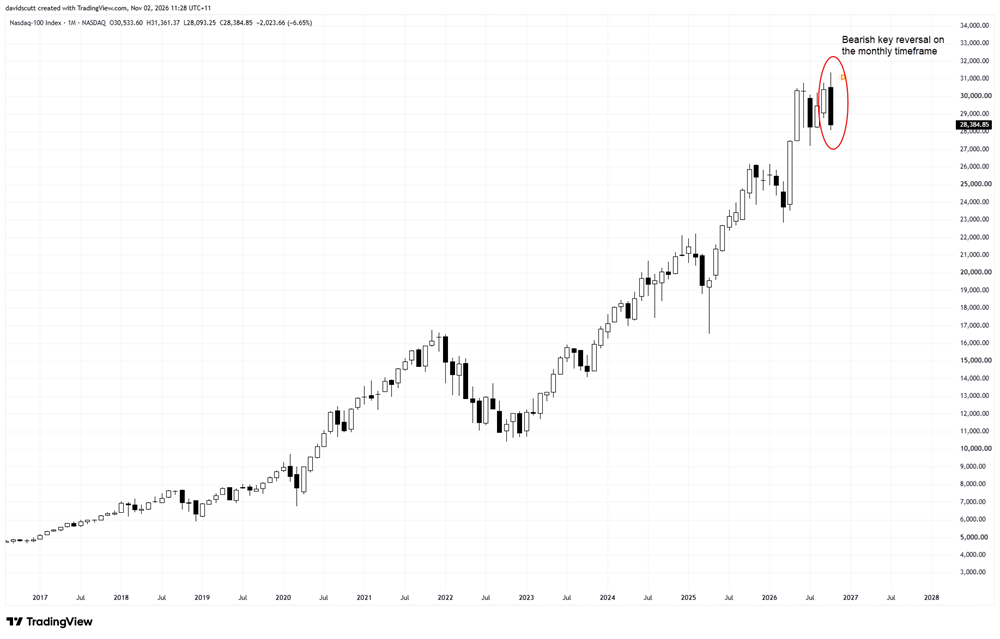
Friday's sell-off in the Nasdaq 100 index was brutal, rounding off what was a substantial decline in October. The high-flying index shed 6.7% for the month, ultimately delivering a bearish key reversal candle, as seen on the monthly chart below.
The reversal comes amid amplified concerns about the speed and cost of the AI capex rollout, the growing reliance on debt and equity financing, and whether the returns will ultimately justify the investment, raising questions about its long-term sustainability.
Source: TradingView
Warning signs were already there
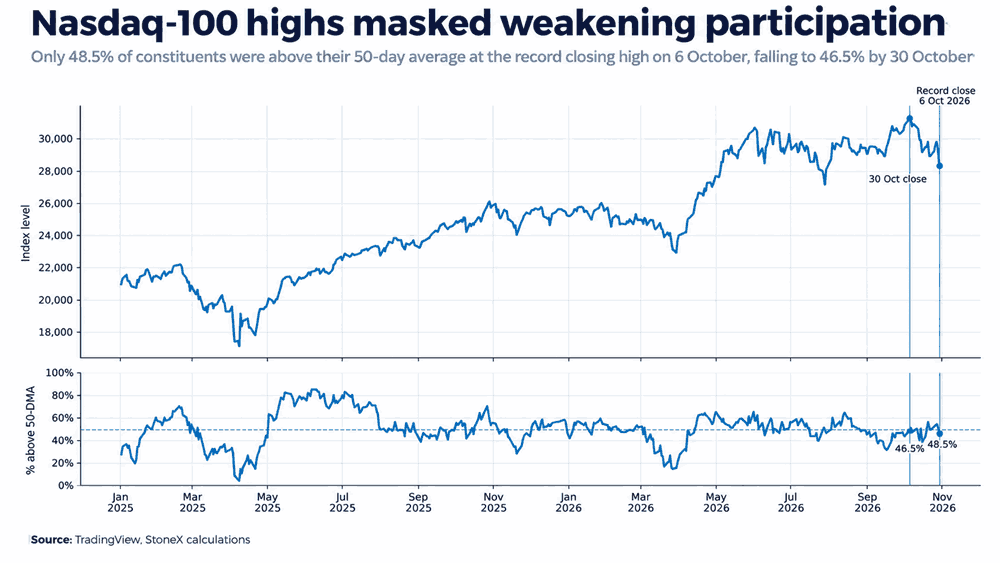
While the Nasdaq 100 hit fresh record highs in early October, there were signs beneath the surface that the rally was running out of steam. On 6 October, when it hit its current record high, just less than half its constituents were trading above their 50-day moving averages, meaning a slim majority of the index was already in a short-term downtrend.
Source: TradingView
From a historical standpoint, that's unusual. Looking back through available data to late 2006, there have been just 12 instances out of 375 record highs where fewer than half of the index's constituents were trading above their 50-day moving average.
Interestingly, all of those have occurred in recent years: 2024, 2025 and 2026, coinciding with the AI capex boom that's led to significant revenue and earnings growth among some of the index's largest constituents.
While previous instances of such narrow participation weren't followed by sustained selling, the extraordinary concentration of gains among AI beneficiaries makes it difficult to draw firm conclusions from historical precedent.
AI beneficiaries under the pump
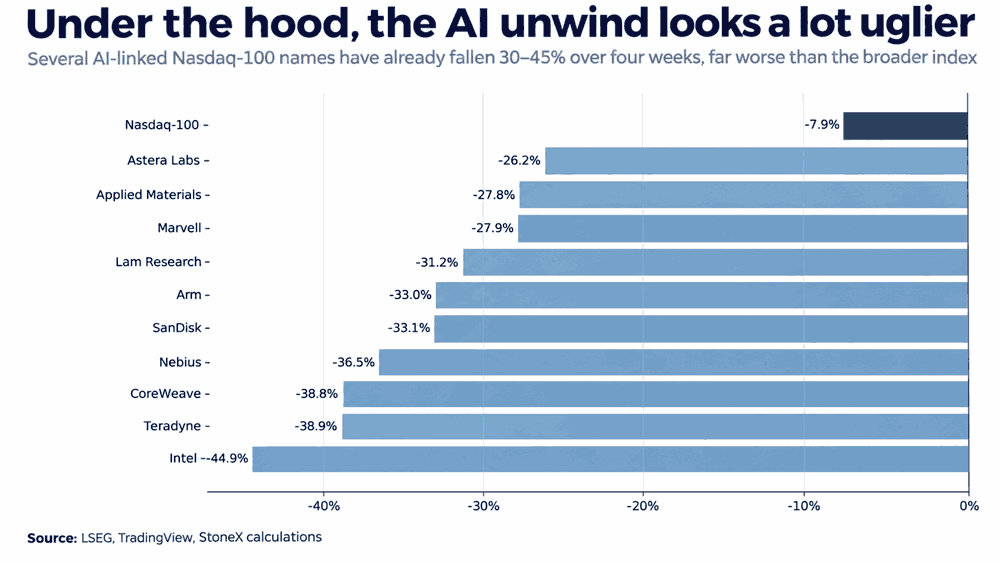
While the broader index had a tough month, selling among some of the biggest beneficiaries of the AI trade was significantly larger. LSEG data shows Intel slumped nearly 45%, with most of that occurring late last week following its earnings update. Teradyne and CoreWeave also fell around 39%, while Nebius, Arm, SanDisk and Lam Research suffered declines of more than 30%.
Source: LSEG
While positioning and the speed of the run-up in these names likely explain a significant proportion of the selling, the scale of the declines also points to growing unease about the outlook for companies supplying the picks and shovels of the AI boom, along with those relying heavily on debt and equity issuance to fund rapid expansion.
The concern isn't necessarily that AI investment is about to collapse, but that even a modest slowdown in spending or a reassessment of expected returns could have significant consequences for valuations that have already priced in years of extraordinary growth.
Evaluating the bearish reversal signal
While October's bearish monthly key reversal is an obvious warning sign, it's worth remembering that the Nasdaq 100 also printed a three-candle evening star pattern earlier this year that failed to deliver sustained downside. As such, without follow-through confirmation, the signal in isolation offers only limited information.
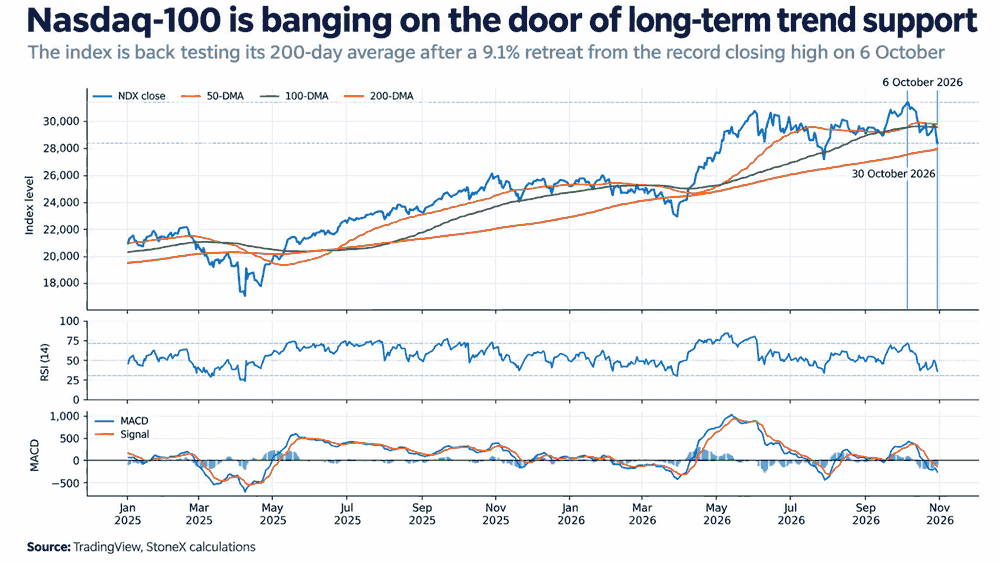
When evaluating how much weight to put on the reversal, it helps to examine historical patterns using other well-known technical indicators, including the 200-day moving average.
Source: TradingView
Looking back through daily data since 1990, there have been 15 previous occasions when the Nasdaq 100 had fallen at least 8% from a recent record high and was trading within 2% above its 200DMA. In 11 of those instances, the index subsequently closed below the average within 60 trading sessions, suggesting there's a reasonable risk of a break beneath this key longer-term level.
Crucially, only three of those 11 episodes saw the index fall another 10% or more over the same period. So while a break below the 200DMA would hardly be unusual, history suggests it doesn't necessarily signal a more substantial change in the index's longer-term trajectory.
Nasdaq 100 technical analysis
While October delivered a bearish reversal on the monthly timeframe, November is yet to see any follow-through selling. Indeed, it feels like a case of death, taxes and US stock futures bouncing in thin Sunday evening trade after a brutal end to the previous week.
Source: TradingView
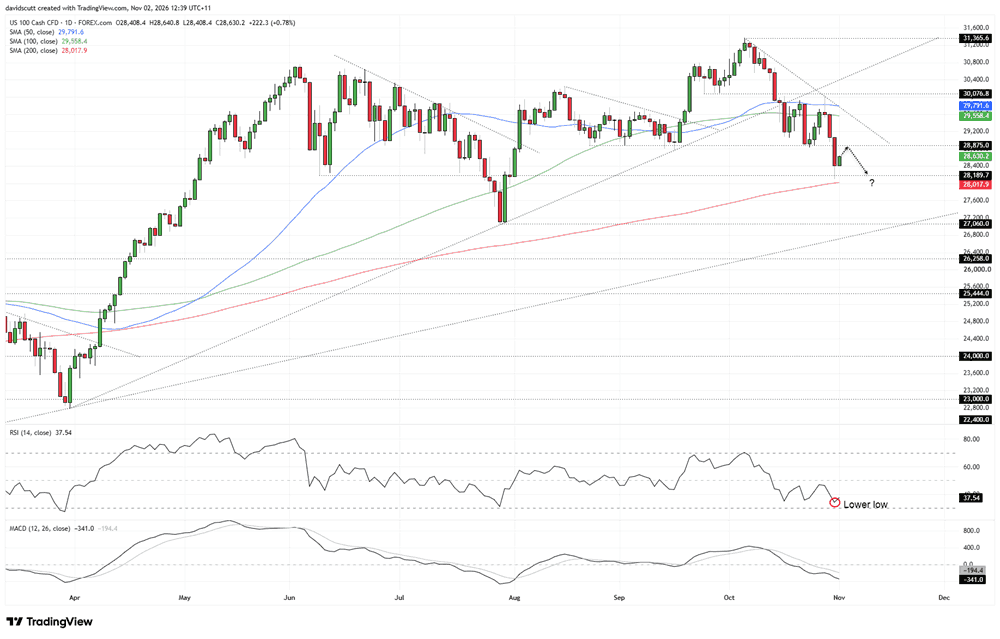
Friday's rout saw our Nasdaq 100 contract slice through 28,875, a level that had thwarted multiple downside breaks dating back to mid-August, before attracting bids just beneath 28,189.7. That level marked the low set in early June before flipping to resistance for a period. It's also located just above the 200-day simple moving average, which continues to hold a gentle upward slope. The area between 28,189.7 and the 200DMA is now the immediate focal point on the downside, with 28,875 the first hurdle overhead.
Looking at the price action leading into Friday's breakdown, the index is now in a minor downtrend having already fallen beneath its 50 and 100-day moving averages, shown in blue and green respectively. The oscillators also point to building downside momentum, with RSI (14) setting a fresh lower low without reaching oversold territory. MACD reinforces the signal message, having staged a bearish crossover before slipping into negative territory.
As things stand, the setup favours shorts over longs, although given how quickly sentiment can change and the persistence of dip-buying, bears should be selective with entries rather than simply picking a random point on the chart.
A break below the 200DMA that sticks would put 27,060 into focus, the low set in late July. Just beneath that level sits the uptrend running from the Liberation Day lows in April 2025, adding to the technical significance of the area.
Conversely, should the price reclaim 28,875, attention would turn to minor downtrend resistance around 29,700, an area that also coincides with the 50 and 100-day moving averages.


Open an account in minutes
Experience award-winning platforms with fast and secure execution, and enjoy tight spreads from 0.5 pts on FX and 0.3 pts on indices.
Economic calendar
Web Trader platform
Our sophisticated web-based platform is packed with features.
Related articles
Have Markets Found a Turning Point Ahead of the Elections?
Fed rate-hike bets topping 70% have pressured markets, including precious metals and U.S. indices, toward key support levels. Could these levels signal a turning point ahead of the U.S. midterm elections?

Forex, Gold and Oil Outlook: FX Crosses May Have the Edge
Major forex pairs lack conviction, but FX crosses may offer better opportunities. Matt Simpson examines forex, gold and crude oil markets.


Nasdaq 100 warning signs mount after brutal October
The Nasdaq 100 has printed a bearish monthly key reversal after a brutal October, with weak market breadth and heavy losses among AI beneficiaries raising the risk of further downside.
This report is intended for general circulation only. It should not be construed as a recommendation, or an offer (or solicitation of an offer) to buy or sell any financial products. The information provided does not take into account your specific investment objectives, financial situation or particular needs. Before you act on any recommendation that may be contained in this report, independent advice ought to be sought from a financial adviser regarding the suitability of the investment product, taking into account your specific investment objectives, financial situation or particular needs.
StoneX Financial Pte. Ltd., may distribute reports produced by its respective foreign entities or affiliates within the StoneX group of companies or third parties pursuant to an arrangement under Regulation 32C of the Financial Advisers Regulations. Where the report is distributed to a person in Singapore who is not an accredited investor, expert investor or an institutional investor (as defined in the Securities Futures Act), StoneX Financial Pte. Ltd. accepts legal responsibility to such persons for the contents of the report only to the extent required by law. Singapore recipients should contact StoneX Financial Pte. Ltd. at 6826 9988 for matters arising from, or in connection with the report.
In the case of all other recipients of this report, to the extent permitted by applicable laws and regulations neither StoneX Financial Pte. Ltd. nor its associated companies will be responsible or liable for any loss or damage incurred arising out of, or in connection with, any use of the information contained in this report and all such liability is hereby expressly disclaimed. No representation or warranty is made, express or implied, that the content of this report is complete or accurate.
StoneX Financial Pte. Ltd. is not under any obligation to update this report.
Trading CFDs carries a high level of risk that may not be suitable for some investors. Consider your investment objectives, level of experience, financial resources, risk appetite and other relevant circumstances carefully. The possibility exists that you could lose some or all of your investments, including your initial deposits. If in doubt, please seek independent expert advice. Visit www.forex.com/en-sg/terms-and-policies for the complete Risk Disclosure Statement.