




Nasdaq, Russell 2000: Rates-Driven Rally or Bull Trap in Disguise?
Was last week’s Nasdaq and Russell 2000 rally driven by politics or something deeper in the rates market? Unpack the signals behind the big US stock market surge.
Share this:

- Nasdaq 100, Russell 2000 rally amid sharp Treasury yield declines
- Strong correlations with bond futures signal rates-driven moves, not political
- Key technical breakouts suggest upside risks remain in focus.
- Worst case scenario on tariffs may be avoided, bolstering risk appetite
Summary
This analysis explores how falling US Treasury yields, not political developments, may have driven last week’s US stock market rally. It highlights key technical levels and correlations in 10-year Treasury note, Nasdaq 100, and Russell 2000 futures, offering insights into near-term risks and trading setups.
Big rates reversal powers stock gains
It should come as no surprise that US stocks had their strongest performance since the Presidential election last week. But was it really to do with Donald Trump’s looming return to the Oval Office? That was priced in long ago, you’d think. Instead, it coincided with a sizeable decline in US interest rates across the curve, aided by a muted inflation report, dovish remarks from key Fed officials, along with another polished performance from incoming Treasury Secretary Scott Bessent on Capitol Hill.
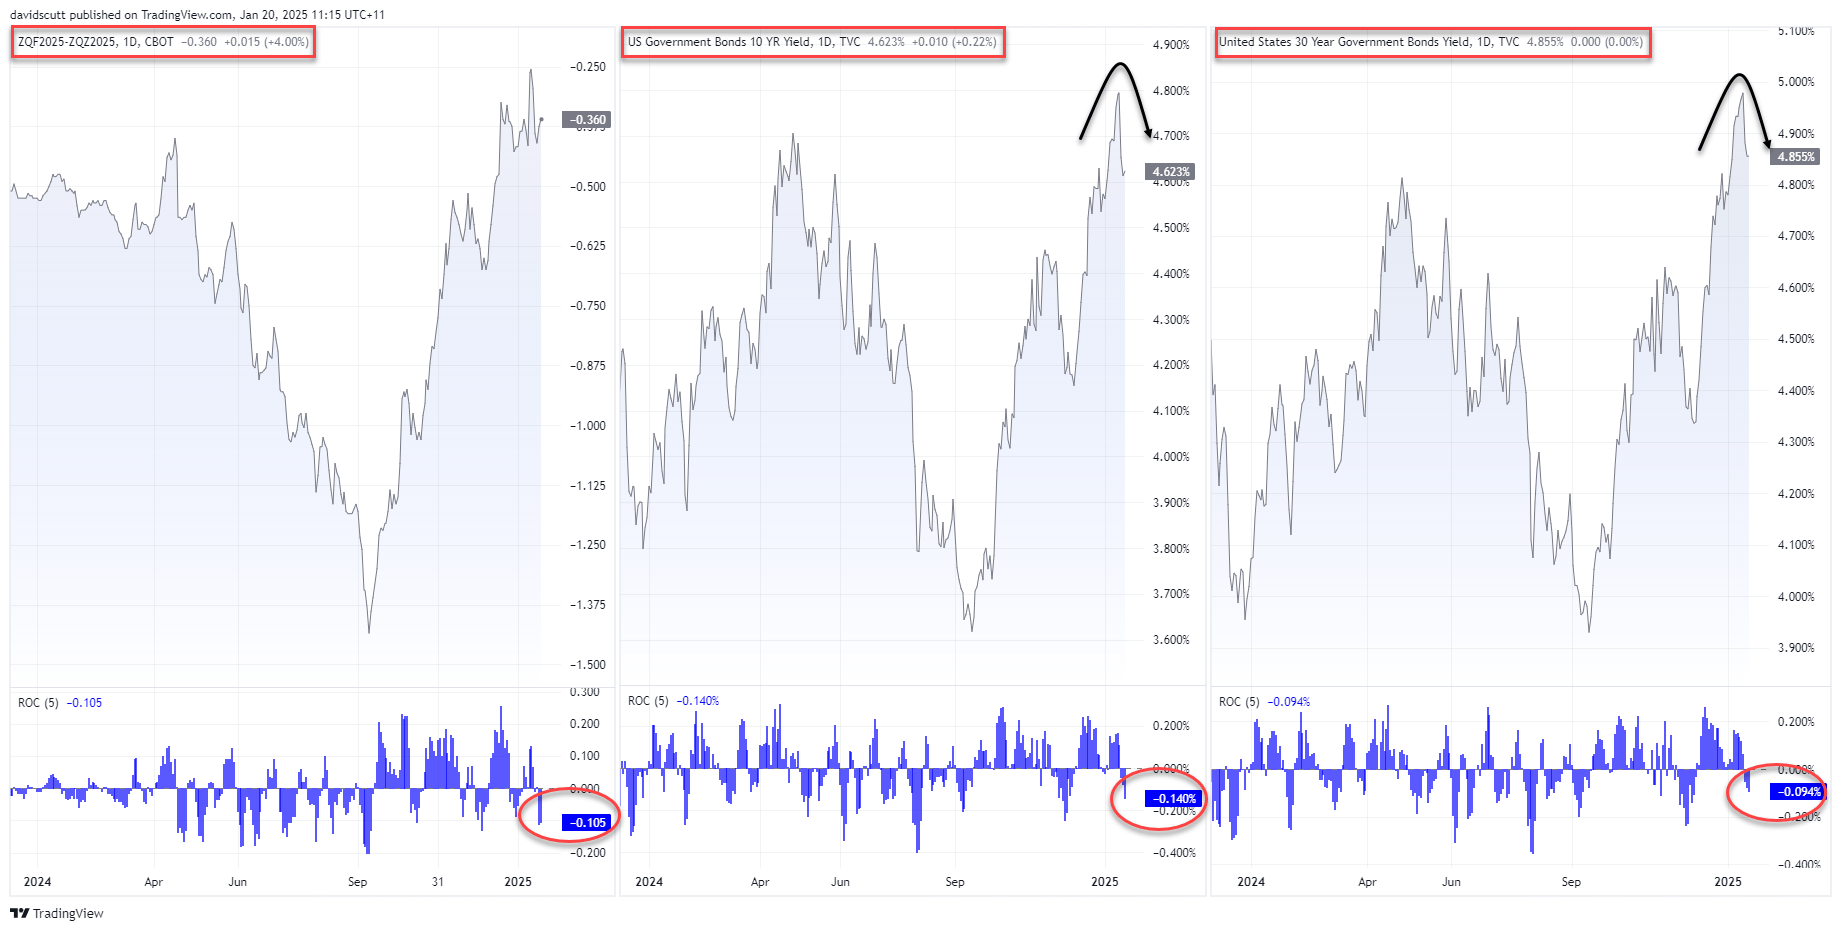
The chart below tells the story. From left to right, it shows 2025 Fed rate cut expectations (based on futures), US 10-year yields, and 30-year yields. The bottom pane highlights the weekly change in basis points, showing the largest declines in months across the board.Source: TradingView
Given US stocks also logged their biggest weekly gains in months, the connection to rates markets is clear. While Trump’s inauguration will create plenty of noise, traders shouldn’t overlook the influence of the rates universe this week.
Bullish breakout in rates world stalls
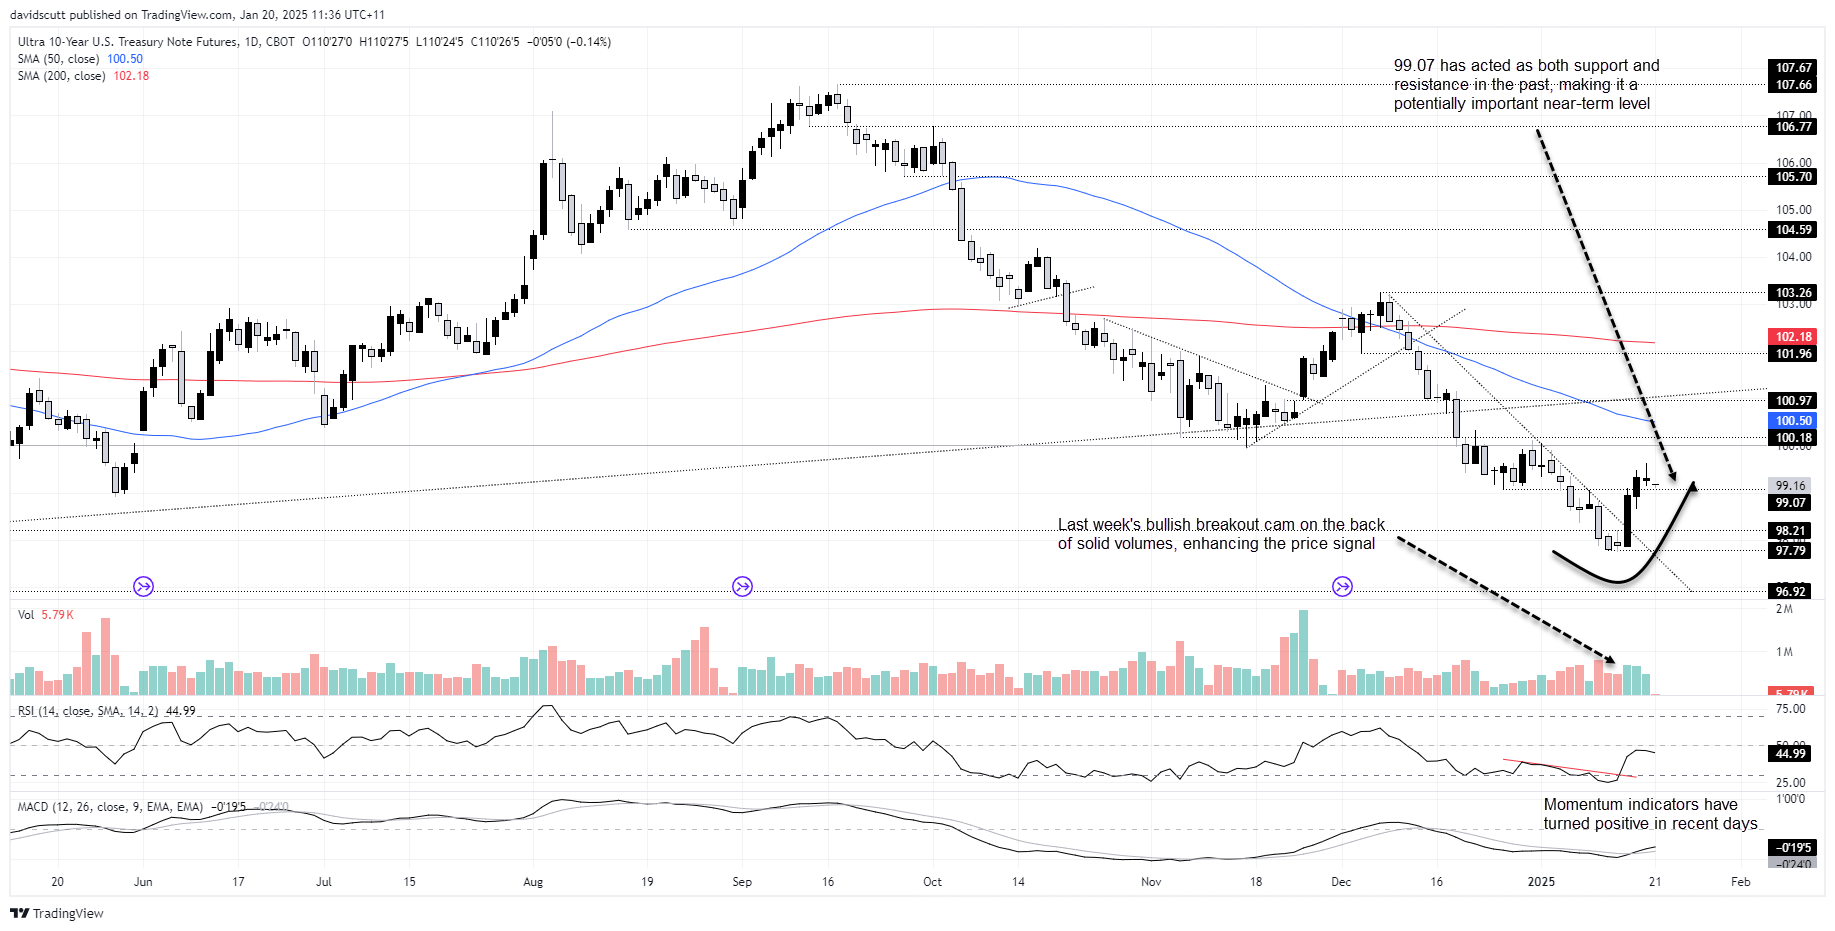
As noted in Saturday’s update, the worst-case scenario on tariffs appears unlikely, which could boost risk appetite and weigh on US Treasury yields as traders recalibrate their inflation outlook. Still, it’s prudent to have a filter to validate this view. For that, US 10-year Treasury Note futures are worth watching, providing directional clues on yields through a deep and liquid market.
Source: TradingView
Last week’s bullish breakout through downtrend resistance was impressive, driven by strong volumes and a noticeable shift in momentum. Since bond prices move inversely to yields, this technical breakout likely contributed to the scale of the yield decline seen.
However, Friday’s candle formed a shooting star, adding significance to Monday’s holiday-impacted trade given the topping signal it provides. A reversal below 99.07 would complete an evening star pattern, amplifying the bearish signal. That level has acted as both support and resistance recently, making it potentially important for assessing stock index setups this week.
Nasdaq wedge break bodes well for bulls
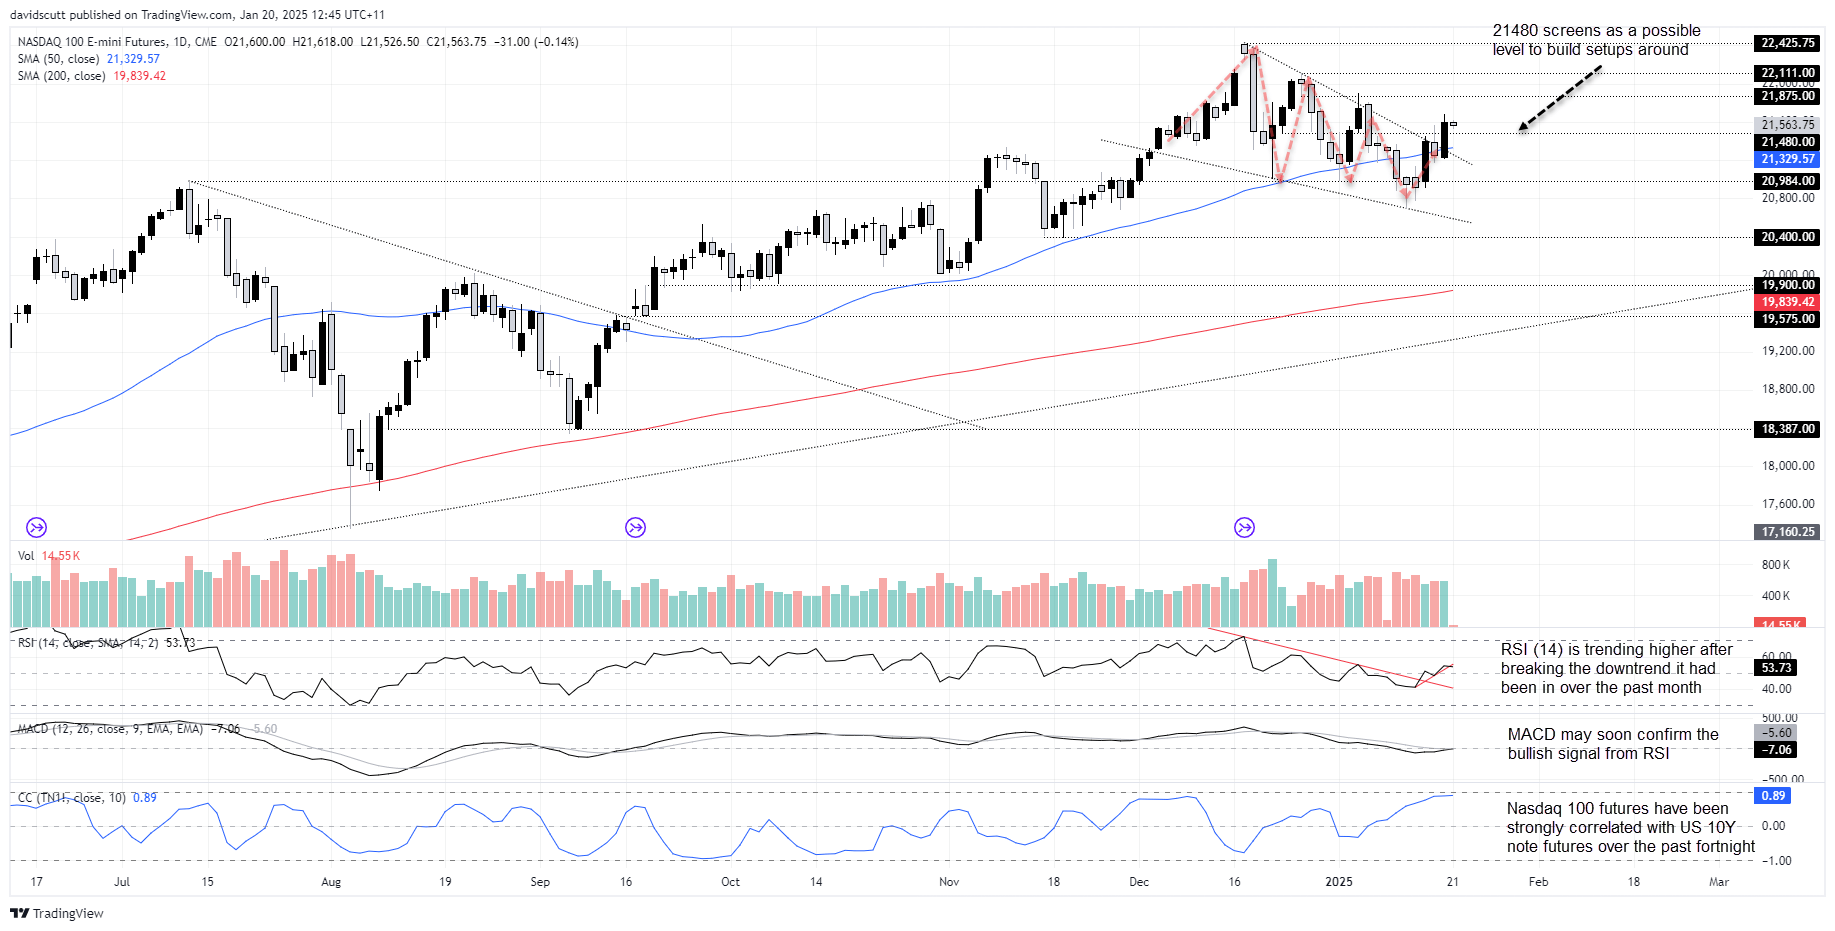
Further reinforcing the rates-equity link, Nasdaq 100 futures have shown a strong positive correlation with US 10-year Treasury Note futures over the past fortnight, sitting at 0.89. Simply put, where bond futures have gone, Nasdaq futures have often followed this year.
Source: TradingView
On Friday, Nasdaq 100 futures broke out of a falling wedge pattern formed over the past month, pushing above 21,480. This level has seen significant price action since late 2024, making it a logical reference for trade setups. The wedge breakout suggests directional risks are skewed to the upside, supported by momentum indicators like RSI (14) and MACD. RSI has broken its downtrend from mid-December, and MACD looks poised to confirm a bullish signal soon.
Traders considering long setups might look to buy above 21,480 with a protective stop below. Upside targets include 21,875 and 22,111, with a move beyond these levels putting the December record high in focus. Conversely, a reversal below the 50-day moving average would invalidate the bullish bias.
Russell 2000 remains a rates-driven play
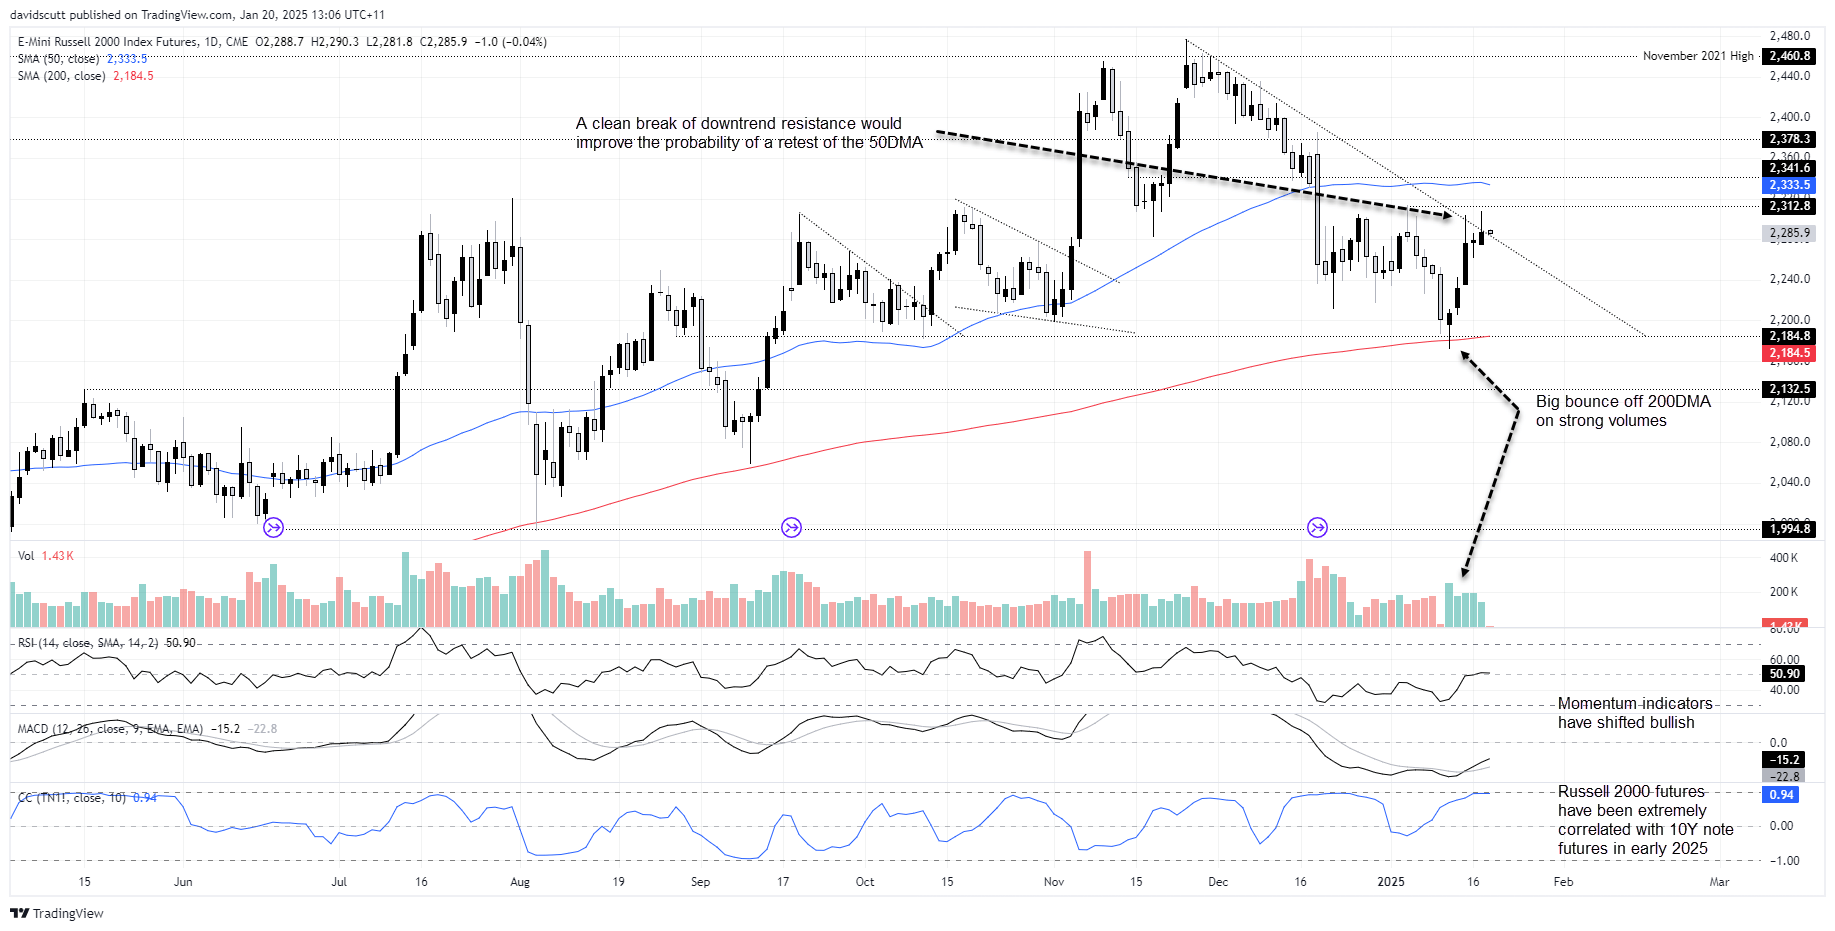
In the small-cap space, Russell 2000 futures have exhibited an even stronger correlation with US benchmark notes, registering a score of 0.94 over the past 10 trading sessions. That's nearly in lockstep.
The daily chart highlights last week’s impressive price action, with futures rebounding sharply off the 200-day moving average on strong volumes. The morning star pattern completed Tuesday proved reliable, see the price push higher to retest downtrend resistance established on November 25.
Source: TradingView
That said, the recent price action has been less convincing, with sellers entrenched above 2,300 as evidenced by the sizeable topside wicks seen in recent days. While momentum remains bullish, a decisive break above the downtrend may be required to ignite excitement for another leg higher. A break would open the door to 2,312.8 and the 50-day moving average.
If price holds above the downtrend, traders considering longs could buy with a tight stop below. The 50-day moving average, respected often in recent times, could serve as an initial target. A break beyond this level would open the door for a retest of the November record highs. However, failure to hold above the downtrend would invalidate the bullish bias, so watch the near-term price action carefully.
-- Written by David Scutt
Follow David on Twitter @scutty
How to trade with City Index
You can trade with City Index by following these four easy steps:
- Open an account, or log in if you’re already a customer
• Open an account in the UK
• Open an account in Australia
• Open an account in Singapore
- Search for the market you want to trade in our award-winning platform
- Choose your position and size, and your stop and limit levels
- Place the trade
Related tags:
Latest market news




Open an account in minutes
Experience award-winning platforms with fast and secure execution, and enjoy tight spreads from 0.5 pts on FX and 0.3 pts on indices.
Economic calendar
Web Trader platform
Our sophisticated web-based platform is packed with features.
Related articles

Nasdaq 100 Forecast: NDX rebounds as oil prices fall and ahead of Apple earnings
U.S. stock indices are moving higher on Monday as tech and AI-related stocks steady following a shocking October. The mood remains cautious following the AI wobble, with more tech earnings due this week, U.S. midterm elections and a full U.S. economic data calendar.

Gold forecast: XAU/USD stabilised after recent falls – for now
Gold has started the first week of the new month trying to recover some ground after another bruising week. Oil prices have taken a sharp drop and that has allowed risk assets to bounce back, which has clearly helped the precious metal too. However, with sentiment remaining bearish towards the metals, and with $4000 level having been taken out last week, the path of least resistance is to the downside for gold.


GBP/USD outlook: Currency Pair of the Week | November 2, 2026
The GBP/USD heads into a crowded week of event risk, with the midterm elections, a Bank of England rate decision and Friday's non-farm payrolls report all capable of moving markets sharply. The greenback remains fundamentally well supported by a hawkish Federal Reserve, but much of that is already priced in, while the renewed sell-off in technology stocks has exposed its vulnerability.
This report is intended for general circulation only. It should not be construed as a recommendation, or an offer (or solicitation of an offer) to buy or sell any financial products. The information provided does not take into account your specific investment objectives, financial situation or particular needs. Before you act on any recommendation that may be contained in this report, independent advice ought to be sought from a financial adviser regarding the suitability of the investment product, taking into account your specific investment objectives, financial situation or particular needs.
StoneX Financial Pte. Ltd., may distribute reports produced by its respective foreign entities or affiliates within the StoneX group of companies or third parties pursuant to an arrangement under Regulation 32C of the Financial Advisers Regulations. Where the report is distributed to a person in Singapore who is not an accredited investor, expert investor or an institutional investor (as defined in the Securities Futures Act), StoneX Financial Pte. Ltd. accepts legal responsibility to such persons for the contents of the report only to the extent required by law. Singapore recipients should contact StoneX Financial Pte. Ltd. at 6826 9988 for matters arising from, or in connection with the report.
In the case of all other recipients of this report, to the extent permitted by applicable laws and regulations neither StoneX Financial Pte. Ltd. nor its associated companies will be responsible or liable for any loss or damage incurred arising out of, or in connection with, any use of the information contained in this report and all such liability is hereby expressly disclaimed. No representation or warranty is made, express or implied, that the content of this report is complete or accurate.
StoneX Financial Pte. Ltd. is not under any obligation to update this report.
Trading CFDs carries a high level of risk that may not be suitable for some investors. Consider your investment objectives, level of experience, financial resources, risk appetite and other relevant circumstances carefully. The possibility exists that you could lose some or all of your investments, including your initial deposits. If in doubt, please seek independent expert advice. Visit www.forex.com/en-sg/terms-and-policies for the complete Risk Disclosure Statement.