


New Zealand dollar outlook: NZD/USD eyes bounce as rate cut bets near exhaustion
The RBNZ’s aggressive rate cut and dovish tone continue to weigh on NZD/USD, but with easing expectations already stretched, large scale downside may be hard won from here.
Share this:

- RBNZ cut rates by 50bp, with more easing flagged
- NZ-US 2yr yield spread hits most negative since 2019
- 37bp of further cuts priced by April, limiting downside scope
- NZD/USD testing July downtrend support, RSI near oversold
NZD/USD Outlook Summary
The Reserve Bank of New Zealand’s (RBNZ) decision to deliver a supersized 50 basis point rate cut at its October monetary policy meeting—and its willingness to deliver more should the need arise—continues to influence the NZD/USD. That’s resulted in an unusually long stretch where the New Zealand interest rate outlook is acting as the primary driver of its movements.
However, with one-and-a-half cuts already baked into the price out to the middle of next year, it may be difficult to justify an even larger increase in dovish bets after 300 basis points of easing already delivered. Throw in NZD/USD testing a key downside support it’s bounced off on several occasions recently, and the case for further large-scale downside in the near term comes across as a tad optimistic.
Dovish RBNZ Weighs on Kiwi
Continued dovishness from the RBNZ remains a key influence on NZD/USD days after its October monetary policy meeting, dragging the pair lower as two-year yield differentials between New Zealand and the United States—which largely reflect the future path of central bank policy rates—turned the most negative since 2019 on Thursday.

Source: TradingView
As seen visually in the chart above, as spreads have turned in favour of the United States, NZD/USD has wilted, hitting lows not seen since the immediate aftermath of Donald Trump’s Liberation Day reciprocal tariff level announcement in early April. Correlation analysis backs this assessment up, with the rolling coefficient score between NZD/USD and two-year spreads on an hourly timeframe sitting at 0.78 over the past week. It’s not moving in lockstep by any stretch, but it’s not insignificant either.
RBNZ Rate Cut Bets Nearing Exhaustion?
However, with an additional 37 basis points of easing already priced into the Kiwi overnight swaps curve by April next year, essentially signalling traders see the risk of the RBNZ cash rate hitting 2% by Q2 next year as akin to a coin toss, it may be difficult to justify any further easing beyond the 300 basis points already seen unless something particularly nasty happens to the global economy or markets.
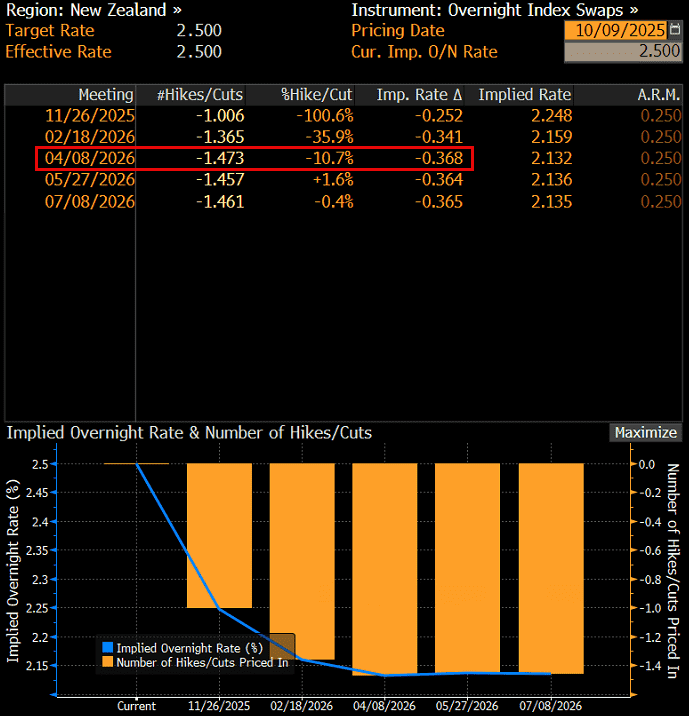
Source: Bloomberg


USD Breakout Defies Economic Risks
While that remains a risk, especially with stocks around the world ripping higher on the promise of AI riches and further rate cuts yet to be delivered, it will be difficult to gauge economic risks from the United States in the near term with almost no new data coming through due to the increasingly lengthy government shutdown.
That’s left other market drivers, such as technical analysis, to steer currency market direction. Contrary to the obvious risk posed by temporarily furloughed government workers spilling over into weaker economic activity, rather than undermine the U.S. dollar, the exact opposite has been seen with the DXY breaking to multi-month highs this week.
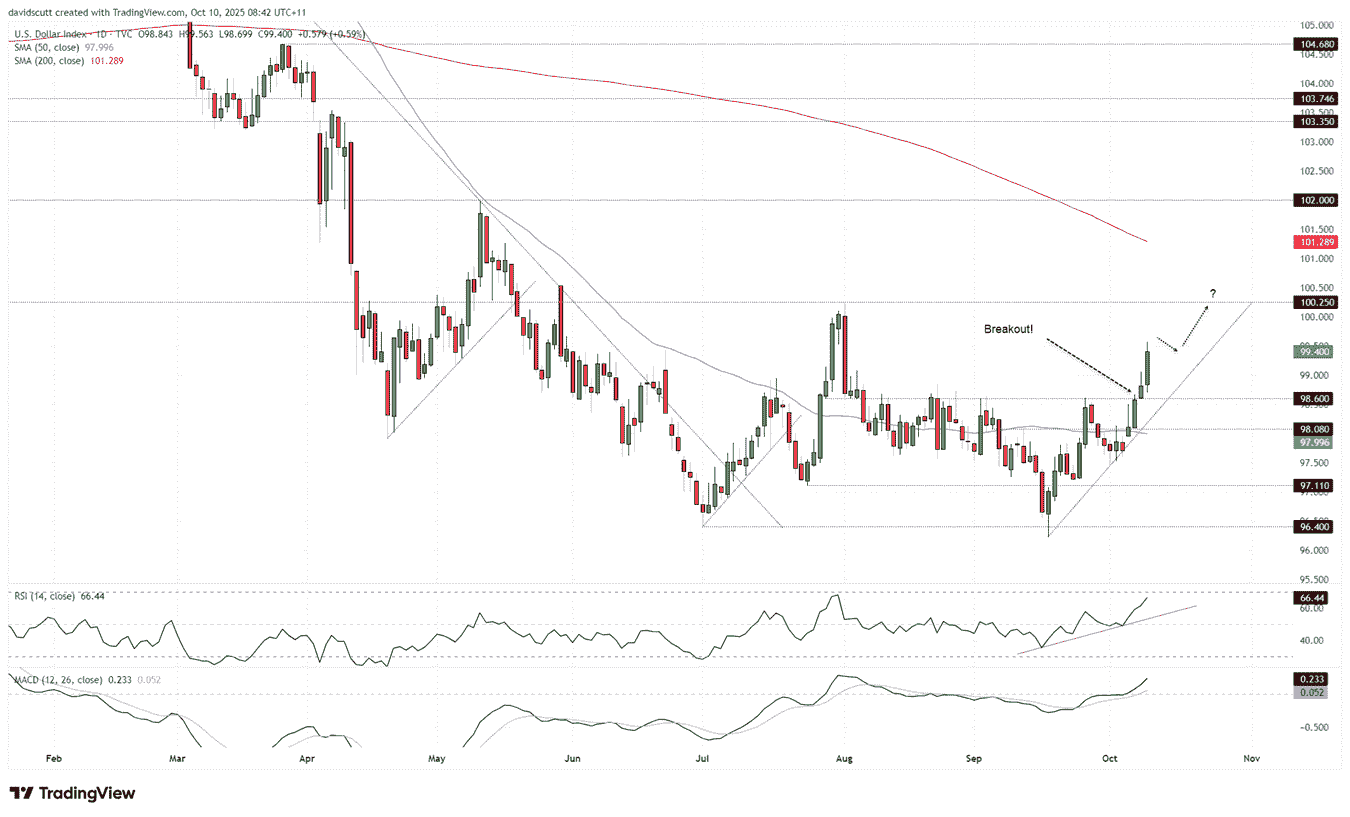
Source: TradingView
While it’s not a readily traded market instrument, sitting in an established uptrend and having cleared a strong resistance zone starting at 98.60, there’s room to run higher towards another prominent resistance level at 100.25 in the period ahead. Bullish momentum continues to build, hinting at the potential for further weakness in EUR and JPY against the USD given they’re by far the largest weightings in the DXY index.
NZD/USD Technical Analysis

Source: TradingView
To be sure, that suggests the Kiwi may also struggle against the big dollar. But where it gets interesting for NZD/USD is its location on the charts, currently testing the lower support of the downtrend established in early July. The pair has tested and bounced off or near the level on numerous occasions over recent weeks, and while the moves have hardly been convincing, it suggests there are still bulls willing to defend the level—even after the RBNZ’s dovish performance earlier this week.
While RSI (14) and MACD continue to provide obvious bearish signals that favour selling rallies over buying dips, both are nearing levels that suggest the pair is approaching oversold territory. They’re not there yet, but they are close. Combined with the already dovish New Zealand rate outlook, which may struggle to grow any further in the near term, it suggests there’s still grounds to buy dips around downtrend support—as long as risk management remains the key factor when assessing potential setups.
Longs could be established above the trendline with a tight stop beneath for protection. It would be preferable to see an initial test and failure before entering positions. As for targets, 0.5800 screens as an obvious candidate given it’s acted as both support and resistance on multiple occasions over the past two months. Depending on the price action at the level should it get there, traders could then assess whether to cut, hold, or reverse, with the 200-day moving average the next logical topside candidate for longs.
On the downside, a break and close beneath downtrend support would open the door for potential short setups, with very little technical support evident until 0.5640. However, while selling rallies remains the preferred longer-term strategy right now, as discussed above, entry around these levels means you’re essentially betting on something fairly nasty happening to the global economy.
Latest market news




Open an account in minutes
Experience award-winning platforms with fast and secure execution, and enjoy tight spreads from 0.5 pts on FX and 0.3 pts on indices.
Economic calendar
Web Trader platform
Our sophisticated web-based platform is packed with features.
Related articles
Silver's bullish breakout case builds as bond yields retreat
The Democratic blue wave has sent crude and Treasury yields sharply lower, improving the outlook for precious metals. With gold already breaking higher, could silver be next?
Gold Reclaims $4,000, Bulls Eye Reversal with Seasonality Tailwind
Gold futures rebound above $4,000 as falling US yields, improving sentiment and bullish seasonality raise hopes of a significant reversal.

GBP/USD, GBP/AUD: Sterling Rally Faces a BoE Reality Check
Sterling faces a reality check as the BoE prepares to hike rates. GBP/USD and GBP/AUD approach resistance, leaving bulls vulnerable to dovish guidance.
This report is intended for general circulation only. It should not be construed as a recommendation, or an offer (or solicitation of an offer) to buy or sell any financial products. The information provided does not take into account your specific investment objectives, financial situation or particular needs. Before you act on any recommendation that may be contained in this report, independent advice ought to be sought from a financial adviser regarding the suitability of the investment product, taking into account your specific investment objectives, financial situation or particular needs.
StoneX Financial Pte. Ltd., may distribute reports produced by its respective foreign entities or affiliates within the StoneX group of companies or third parties pursuant to an arrangement under Regulation 32C of the Financial Advisers Regulations. Where the report is distributed to a person in Singapore who is not an accredited investor, expert investor or an institutional investor (as defined in the Securities Futures Act), StoneX Financial Pte. Ltd. accepts legal responsibility to such persons for the contents of the report only to the extent required by law. Singapore recipients should contact StoneX Financial Pte. Ltd. at 6826 9988 for matters arising from, or in connection with the report.
In the case of all other recipients of this report, to the extent permitted by applicable laws and regulations neither StoneX Financial Pte. Ltd. nor its associated companies will be responsible or liable for any loss or damage incurred arising out of, or in connection with, any use of the information contained in this report and all such liability is hereby expressly disclaimed. No representation or warranty is made, express or implied, that the content of this report is complete or accurate.
StoneX Financial Pte. Ltd. is not under any obligation to update this report.
Trading CFDs carries a high level of risk that may not be suitable for some investors. Consider your investment objectives, level of experience, financial resources, risk appetite and other relevant circumstances carefully. The possibility exists that you could lose some or all of your investments, including your initial deposits. If in doubt, please seek independent expert advice. Visit www.forex.com/en-sg/terms-and-policies for the complete Risk Disclosure Statement.