


S&P 500 Another Thursday Bounce After CPI-Fueled Sell-Off
Carnage may be overstating it a bit given that fresh ATHs were printed just a week ago but if you were reading the headlines, it would certainly seem to be more than just a -2.28% pullback from the high.
Share this:

S&P 500 Talking Points:
- All the talk of an AI bubble has the world on edge and yesterday’s sell-off saw many proclaiming that the bubble had burst. In reality, we’re still in the early innings of whatever this will become.
- Of late, there’s been a tendency for late-week bounces to develop and so far this week we’re seeing another, with a significant swing low on Thursday morning.
Late-week rallies have been a thing for US equities over the past month and this morning is sticking with that script, as an initial sell-off on the back of the PPI report found support at a huge spot – and that’s been followed by a sizable rally.
This Thursday bounce echoes what’s happened for the past six Thursdays, highlighted on the below chart with vertical lines.
S&P 500 Futures Four-Hour Chart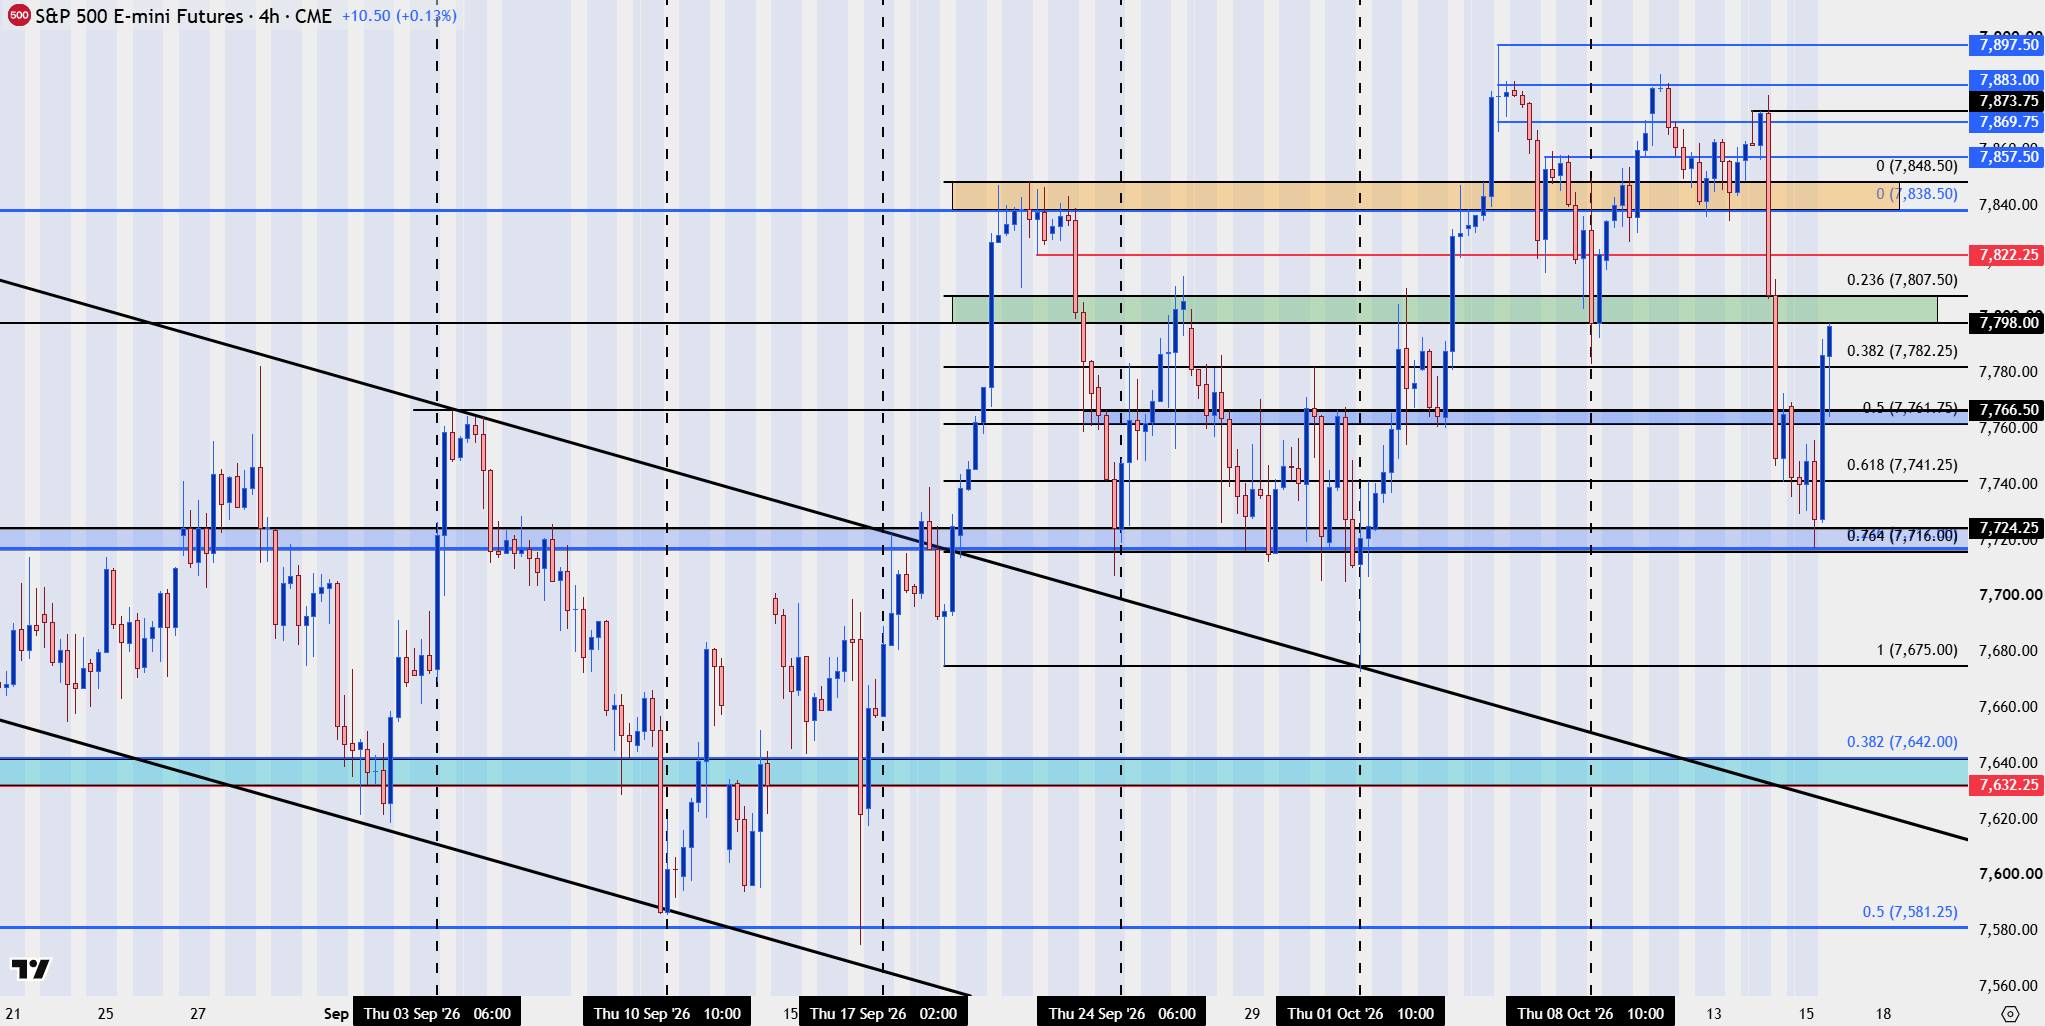
Chart prepared by James Stanley; data derived from Tradingview
The Friday Set Up in Stocks
While a few items of worry had started to show, with a larger sell-off in the Nasdaq and NVDIA leading the way lower, there’s been a pattern of late-week rallies of late likely due to the fear of holding short positions into the weekend. With President Trump pumping markets via comments as we are now just a few weeks away from mid-term elections, it can be a difficult time to be caught short, and I think that’s played a role.
Perhaps the larger question is what happens in the scenario where Republicans lose the House, which seems likely at this point. As President Trump has warned already, Democrats winning either house of Congress brought an economic threat to the country.
At this point, however, bulls are still in the ballgame and the weekly chart of the S&P 500 shows that well, as price has, so far, held at a big spot of prior resistance. The patterning is a rising wedge, which could point to bearish reversal potential, but as looked at earlier in the week, the more vulnerable area appears to be the high-flying tech stocks that led the way from the 2022 lows.
S&P 500 Futures Weekly Chart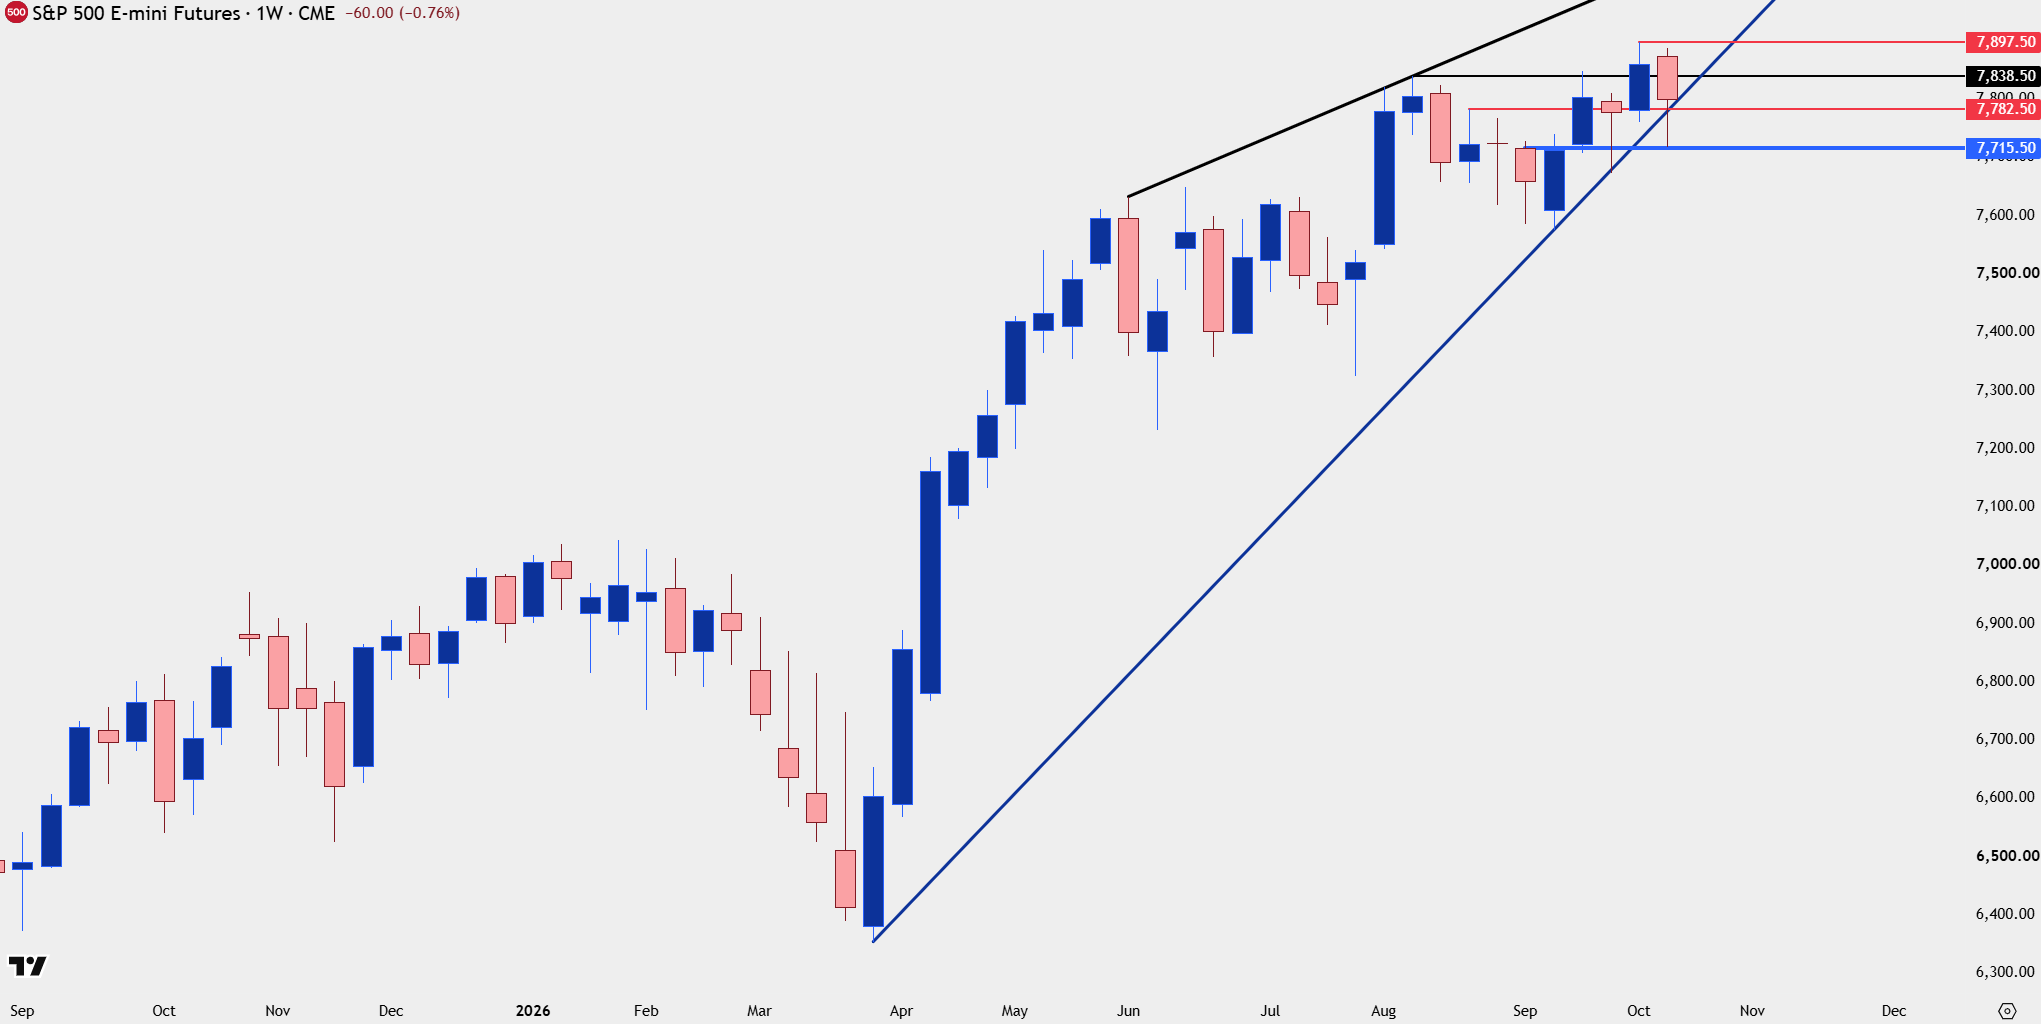
Chart prepared by James Stanley; data derived from Tradingview
--- written by James Stanley, Senior Market Analyst, Global Macro
Related tags:
Latest market news




Open an account in minutes
Experience award-winning platforms with fast and secure execution, and enjoy tight spreads from 0.5 pts on FX and 0.3 pts on indices.
Economic calendar
Web Trader platform
Our sophisticated web-based platform is packed with features.
Related articles
USD Exhaustion into Bearish Engulf: EUR/USD, GBP/USD, USD/JPY
It was a big week for the Dollar with stronger inflation pushing rate hike themes, with price action diverging as price printed a bearish engulf on the weekly DXY chart.
S&P 500 Forecast: SPX set for a weekly decline led lower by tech as AI worries linger
U.S. stocks have opened mixed as investors continue to worry about the financing behind the AI trade while also looking ahead to more earnings next week.


S&P 500 Another Thursday Bounce After CPI-Fueled Sell-Off
Carnage may be overstating it a bit given that fresh ATHs were printed just a week ago but if you were reading the headlines, it would certainly seem to be more than just a -2.28% pullback from the high.
This report is intended for general circulation only. It should not be construed as a recommendation, or an offer (or solicitation of an offer) to buy or sell any financial products. The information provided does not take into account your specific investment objectives, financial situation or particular needs. Before you act on any recommendation that may be contained in this report, independent advice ought to be sought from a financial adviser regarding the suitability of the investment product, taking into account your specific investment objectives, financial situation or particular needs.
StoneX Financial Pte. Ltd., may distribute reports produced by its respective foreign entities or affiliates within the StoneX group of companies or third parties pursuant to an arrangement under Regulation 32C of the Financial Advisers Regulations. Where the report is distributed to a person in Singapore who is not an accredited investor, expert investor or an institutional investor (as defined in the Securities Futures Act), StoneX Financial Pte. Ltd. accepts legal responsibility to such persons for the contents of the report only to the extent required by law. Singapore recipients should contact StoneX Financial Pte. Ltd. at 6826 9988 for matters arising from, or in connection with the report.
In the case of all other recipients of this report, to the extent permitted by applicable laws and regulations neither StoneX Financial Pte. Ltd. nor its associated companies will be responsible or liable for any loss or damage incurred arising out of, or in connection with, any use of the information contained in this report and all such liability is hereby expressly disclaimed. No representation or warranty is made, express or implied, that the content of this report is complete or accurate.
StoneX Financial Pte. Ltd. is not under any obligation to update this report.
Trading CFDs carries a high level of risk that may not be suitable for some investors. Consider your investment objectives, level of experience, financial resources, risk appetite and other relevant circumstances carefully. The possibility exists that you could lose some or all of your investments, including your initial deposits. If in doubt, please seek independent expert advice. Visit www.forex.com/en-sg/terms-and-policies for the complete Risk Disclosure Statement.