



S&P 500 outlook: Oil and bond yields rebound
Investor sentiment was marginally firmer early on Thursday, although optimism quickly faded as crude prices turned positive again on reports that Iran’s supreme leader has issued a directive that its uranium must stay in Iran. Whether that is a dealbreaker remains to be seen, but oil did pop higher by $4 on the news, while European markets and US index futures slipped back into the red.
Share this:
Investor sentiment was marginally firmer early on Thursday, although optimism quickly faded as crude prices turned positive again on reports that Iran’s supreme leader has issued a directive that its uranium must stay in Iran. Whether that is a dealbreaker remains to be seen, but oil did pop higher by $4 on the news, while European markets and US index futures slipped back into the red. For now, markets remain stuck in a cautious holding pattern rather than embracing a full risk-on rally. A deal would likely send stocks sharply higher in Europe and less so on Wall Street. But the longer the stalemate continues, the situation in energy markets will become a significant headwind for global growth, and stocks. At the same time, even another set of exceptional results from Nvidia failed to inject fresh momentum into equities in the way many would normally expect. All eyes are on oil prices which will determine the near term direction of risk assets and the S&P 500 outlook.
Oil markets still dictating the narrative
Crude prices fell sharply in the previous session after fresh optimism emerged surrounding a potential agreement between Washington and Tehran. That helped to ease fears over a prolonged supply disruption in the Strait of Hormuz and pointed to a potential agreement. But Reuters’ report that Iran’s supreme leader has issued a directive that its uranium must stay in Iran does complicate the picture, if true. So, the geopolitical premium on oil remains. Trump repeated that military action remained on the table if negotiations failed and suggested there was little urgency to reach an agreement quickly. That rhetoric helped stabilise prices and reminded investors that energy-driven inflation risks remain very much alive.
This is not the first time markets have attempted to price in a diplomatic breakthrough. Earlier optimism this month faded almost as quickly as it arrived, and traders now appear far less willing to aggressively chase headlines without concrete progress. The increasingly hostile tone from both sides has only reinforced that caution.
Bond markets becoming increasingly important
Attention has also been on US Treasury yields, which continue to send warning signals for risk assets. The 30-year Treasury yield briefly touched 5.20% on Wednesday — its highest level since 2007 — before easing back alongside crude prices later in the day. Today, both are bouncing back, and so stock markets are coming under a bit of pressure again.
Only a few months ago, markets were steadily moving towards a softer inflation outlook, with investors increasingly convinced that the Federal Reserve would eventually deliver additional rate cuts. But the escalation in Middle East tensions and concerns over the Strait of Hormuz triggered a sharp repricing across global bond markets.
What has been remarkable, however, is how resilient US equities — particularly technology stocks — have remained throughout the move higher in yields. The Nasdaq 100 only recently pulled back from record highs despite borrowing costs surging again.
That resilience may now face a tougher test. If yields resume their climb, pressure on the high-valuation momentum trade is likely to intensify, increasing the risk of a broader correction across equity markets. Equally, any meaningful de-escalation in the Middle East would probably trigger a rally in bonds, lower yields and provide renewed support for equities. Much still hinges on oil and developments around the Strait of Hormuz.
Technical S&P 500 outlook: Momentum is beginning to cool
From a technical standpoint, the broader trend still remains constructive despite recent volatility. However, markets are increasingly showing signs of becoming stretched in the short term, raising the probability of either consolidation or a modest pullback.
From a technical standpoint, the broader trend still remains constructive despite recent volatility. However, markets are increasingly showing signs of becoming stretched in the short term, raising the probability of either consolidation or a modest pullback.
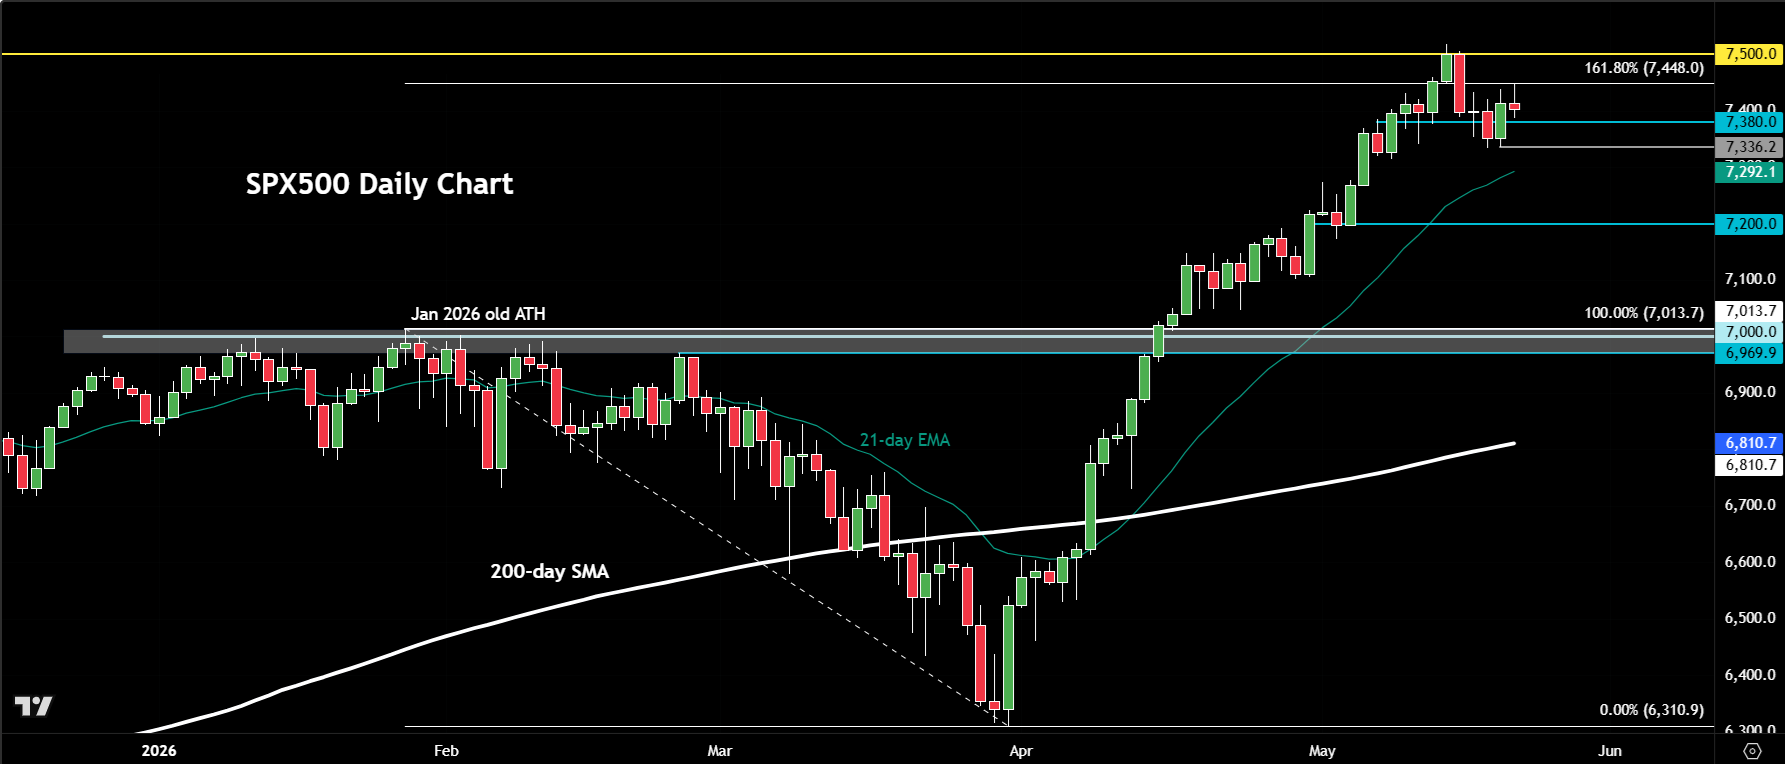
In many respects, that pause may already be underway. The S&P 500 has spent roughly the past week trading around similar levels, suggesting momentum has stalled rather than accelerated. The next phase now depends heavily on the direction of oil prices and bond yields.
The index has already extended into the 161.8% Fibonacci extension of the major downswing that began in late January and bottomed towards the end of March. That extension sits near the 7,448 region and has started to attract profit-taking activity.
Initial support is seen around 7,380. However, a move below yesterday’s low near 7,336 could expose a deeper retracement towards 7,300 and then 7,200.
Longer term, the more significant support zone remains around 7,000— effectively the previous all-time highs established earlier this year. Reaching those levels would likely require a renewed escalation in geopolitical tensions alongside another sharp rise in both crude prices and Treasury yields.
On the upside, resistance levels remain relatively thin beyond the psychologically important 7,500 area, while last Thursday’s record high near 7,540 remains the next obvious reference point for traders watching for signs of exhaustion.
For now, any weakness still appears likely to remain relatively contained. A more meaningful correction would probably require clearer evidence that underlying momentum across the broader market is beginning to deteriorate more decisively.

-- Written by Fawad Razaqzada, Market Analyst
Follow Fawad on Twitter @Trader_F_R
Latest market news




Open an account in minutes
Experience award-winning platforms with fast and secure execution, and enjoy tight spreads from 0.5 pts on FX and 0.3 pts on indices.
Economic calendar
Web Trader platform
Our sophisticated web-based platform is packed with features.
Related articles
ASX 200 Futures Hold Relatively Firm as Nikkei Plunges After Wall Street Rout
Wall Street's AI-led rout sends Nikkei futures plunging 9%, while ASX 200 futures hold relatively firm despite surging volatility and broader risk aversion.
S&P 500 Update: SPX Records Its Biggest Selloff of the Year Ahead of NFP
The trading week has not been particularly favorable for risk appetite in the short term, and this is now becoming increasingly evident in the performance of the S&P 500. During today's session, the index is down nearly 4.2%, marking its largest intraday decline of 2026.

Canadian Dollar Short-term Outlook: USD/CAD Plunge Stalls at Pivotal Support—Range Break in Focus 11 5 2026
Friday’s U.S. and Canadian employment reports could trigger a decisive USD/CAD move as bulls and bears battle for control at critical support.

This report is intended for general circulation only. It should not be construed as a recommendation, or an offer (or solicitation of an offer) to buy or sell any financial products. The information provided does not take into account your specific investment objectives, financial situation or particular needs. Before you act on any recommendation that may be contained in this report, independent advice ought to be sought from a financial adviser regarding the suitability of the investment product, taking into account your specific investment objectives, financial situation or particular needs.
StoneX Financial Pte. Ltd., may distribute reports produced by its respective foreign entities or affiliates within the StoneX group of companies or third parties pursuant to an arrangement under Regulation 32C of the Financial Advisers Regulations. Where the report is distributed to a person in Singapore who is not an accredited investor, expert investor or an institutional investor (as defined in the Securities Futures Act), StoneX Financial Pte. Ltd. accepts legal responsibility to such persons for the contents of the report only to the extent required by law. Singapore recipients should contact StoneX Financial Pte. Ltd. at 6826 9988 for matters arising from, or in connection with the report.
In the case of all other recipients of this report, to the extent permitted by applicable laws and regulations neither StoneX Financial Pte. Ltd. nor its associated companies will be responsible or liable for any loss or damage incurred arising out of, or in connection with, any use of the information contained in this report and all such liability is hereby expressly disclaimed. No representation or warranty is made, express or implied, that the content of this report is complete or accurate.
StoneX Financial Pte. Ltd. is not under any obligation to update this report.
Trading CFDs carries a high level of risk that may not be suitable for some investors. Consider your investment objectives, level of experience, financial resources, risk appetite and other relevant circumstances carefully. The possibility exists that you could lose some or all of your investments, including your initial deposits. If in doubt, please seek independent expert advice. Visit www.forex.com/en-sg/terms-and-policies for the complete Risk Disclosure Statement.