



Signs of life emerge in battered Hang Seng Tech
Supportive news flow and bullish reversal signal has put Hang Seng Tech back on the radar. Here's why 4,400 is the level to watch.
Share this:
- Reversal signal shifts focus to 4,400
- Supportive news flow lifts China tech sentiment
- Break above 4,400 may target 4,620
Hang Seng Tech may have just delivered a near-term bottoming signal
There have been plenty of false dawns for Chinese tech over the past year, meaning this one deserves a healthy degree of scepticism. Even so, the combination of price action and increasingly supportive news flow suggests it's at least worth paying attention to.
Reports suggesting Chinese AI models continue to close the gap on the global leaders have helped reinforce the view the country remains a serious player in the AI race. Hong Kong is also seeing another wave of technology IPOs, with AI, autonomous driving and semiconductor firms lining up to raise fresh capital. On the mainland, Beijing is also making it easier for strategic technology companies to list domestically, another sign policymakers remain committed to supporting the sector. Valuations also remain cheap relative to regional and US rivals.
While none necessarily explain the recent price action, taken together they point to a more supportive backdrop for the sector than we've seen for some time.
Whether that's coincidence or not is open to debate. But it does make what's happening on the chart a little more interesting.
Source: TradingView
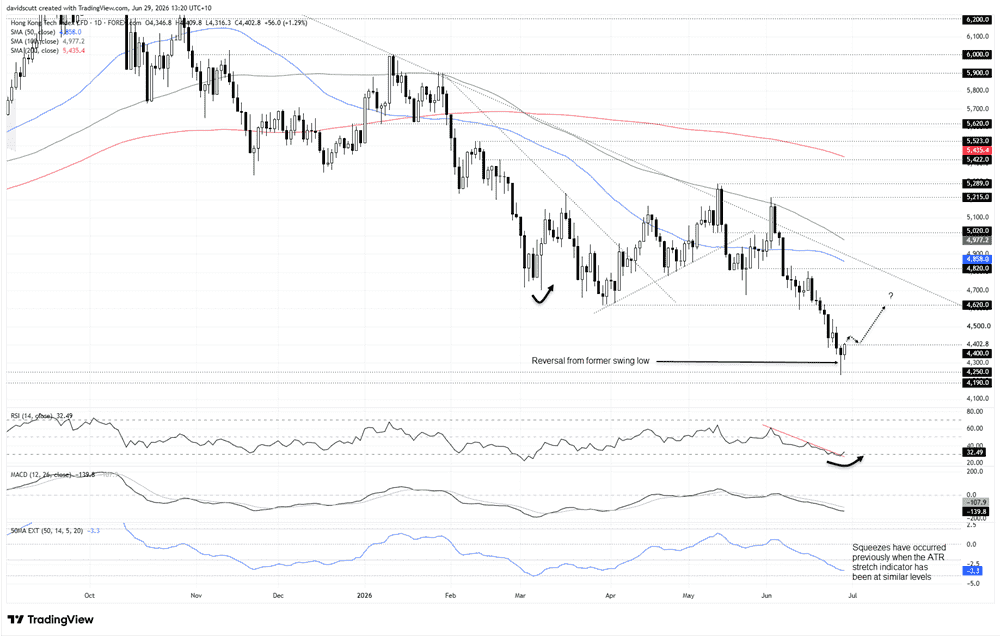
Hang Seng Tech printed a clear hammer candle from 4,250 late last week, the same swing low established back in April last year. After such an elongated bearish trend, it's the type of price action you often see when selling pressure begins to exhaust.
Of course, a hammer candle on its own proves nothing. Confirmation is needed. That's why I'm watching 4,400 closely.
The index bounced from that level last week and is testing it again today. A move above 4,400, particularly on a closing basis, may strengthen the case that a near-term low is in place. I'd have greater confidence if the breakout was followed by a successful back-test and bounce from the level. Importantly, a close above 4,400 would also complete a bullish reversal pattern on the Hang Seng Tech futures contract, providing confirmation across both markets.
If buyers can maintain the recent momentum, or extend it further, one option for those looking to position for upside may be to consider longs above 4,400 with a tight stop beneath the level, initially targeting 4,620, the breakdown zone from where the latest bearish move began.
If 4,620 were to give way, attention may then shift towards 4,820, a level that's acted as both support and resistance, along with the 50-day moving average and long-running downtrend resistance from the October 2025 highs. The downtrend, in combination with the 100-day moving average, has repeatedly proven to be formidable resistance, often sparking major bearish reversals.
Like the price action, momentum indicators are also becoming a little more encouraging. RSI (14) has broken the downtrend that had been in place throughout much of June and is starting to edge higher. At 33, it still points to weak momentum, while MACD has yet to confirm the improvement, suggesting some caution remains warranted.
However, the indicator that's caught my eye is the ATR stretch shown in the lower pane, which measures how extended the price is from the 50DMA relative to recent volatility. While the current reading isn't overly extreme, similar readings have often coincided with some form of short-term squeeze higher.
Latest market news




Open an account in minutes
Experience award-winning platforms with fast and secure execution, and enjoy tight spreads from 0.5 pts on FX and 0.3 pts on indices.
Economic calendar
Web Trader platform
Our sophisticated web-based platform is packed with features.
Related articles
Yen Weakness Fuels USD/JPY and EUR/JPY Breakouts Ahead of Midterms
Yen weakness drives USD/JPY and EUR/JPY higher despite intervention risks, with traders eyeing 160 and 180 as US midterm results emerge.
US Dollar Short-term Outlook: USD Rally on the Line as Midterms, NFP Loom 11 3 2026
DXY is testing pivotal support, with the weekly range breakout likely to determine the next major leg of the trend as key event risk unfolds.

Nasdaq 100 forecast: Stocks rebound but AI concerns linger
The Nasdaq 100 was finding some support at 28,000 after recent sell-off amid concerns about the AI trade. Even with oscillators oversold, the risk to the near-term forecast is tilted to the downside.

This report is intended for general circulation only. It should not be construed as a recommendation, or an offer (or solicitation of an offer) to buy or sell any financial products. The information provided does not take into account your specific investment objectives, financial situation or particular needs. Before you act on any recommendation that may be contained in this report, independent advice ought to be sought from a financial adviser regarding the suitability of the investment product, taking into account your specific investment objectives, financial situation or particular needs.
StoneX Financial Pte. Ltd., may distribute reports produced by its respective foreign entities or affiliates within the StoneX group of companies or third parties pursuant to an arrangement under Regulation 32C of the Financial Advisers Regulations. Where the report is distributed to a person in Singapore who is not an accredited investor, expert investor or an institutional investor (as defined in the Securities Futures Act), StoneX Financial Pte. Ltd. accepts legal responsibility to such persons for the contents of the report only to the extent required by law. Singapore recipients should contact StoneX Financial Pte. Ltd. at 6826 9988 for matters arising from, or in connection with the report.
In the case of all other recipients of this report, to the extent permitted by applicable laws and regulations neither StoneX Financial Pte. Ltd. nor its associated companies will be responsible or liable for any loss or damage incurred arising out of, or in connection with, any use of the information contained in this report and all such liability is hereby expressly disclaimed. No representation or warranty is made, express or implied, that the content of this report is complete or accurate.
StoneX Financial Pte. Ltd. is not under any obligation to update this report.
Trading CFDs carries a high level of risk that may not be suitable for some investors. Consider your investment objectives, level of experience, financial resources, risk appetite and other relevant circumstances carefully. The possibility exists that you could lose some or all of your investments, including your initial deposits. If in doubt, please seek independent expert advice. Visit www.forex.com/en-sg/terms-and-policies for the complete Risk Disclosure Statement.