




S&P 500 analysis: AAPL, TSLA breakdown puts techs into focus
The US stock markets spent the first half of the session in the positivise territory, stabilising after Friday’s sell-off. But with sentiment shaken, there is a risk we could witness a similar pattern and see the gains evaporate later on in the session.
Share this:

- S&P 500 analysis – will more tech stocks break lower?
- AAPL, TSLA among tech stocks breaking lower
- S&P 500 Technical analysis: Bears still need more confirmation
The US stock markets spent the first half of the session in the positive territory, stabilising after Friday’s sell-off. But with sentiment shaken, there is a risk we could witness a similar pattern and see the gains evaporate later on in the session.
S&P 500 analysis – will more tech stocks break lower?
Along with slowing sales growth, you also have rising bond yields making growth stocks less appealing, as ‘risk-free’ rates are offering a decent return right now. On top of all this, don’t forget the impact of profit-taking among reasons why stocks have struggled. After a strong performance so far in the year, many investors would be looking for excuses to bank some profit. While the slump in Apple and Tesla shares have weighed heavily on the Nasdaq, the S&P 500 was showing a similar picture, printing some bearish-looking price action last week. So, the calmness we have witnessed so far in the day may not last long.
Earlier, my colleague Matt Weller wrote about the underperformance of the US tech sector of late, owing to the slowdown in sales growth. More HERE.
Earlier, my colleague Matt Weller wrote about the underperformance of the US tech sector of late, owing to the slowdown in sales growth. More HERE.
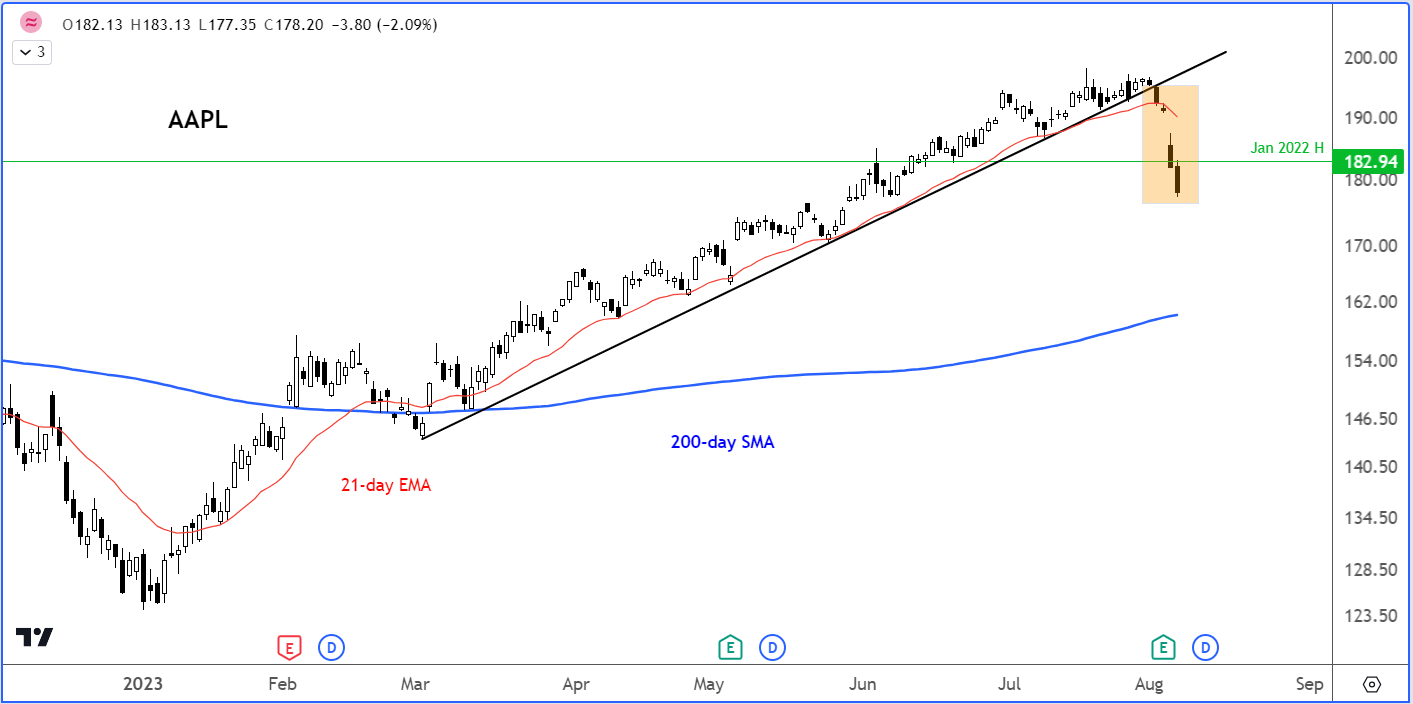
Shares in Apple closed 7% lower last week, with Tesla also struggling. Both stocks have started the new week on the backfoot, although the major indices have advanced.
Here’s how AAPL chart looked like earlier:
And here’s how the chart of TSLA looked like:
S&P 500 analysis: Technical analysis
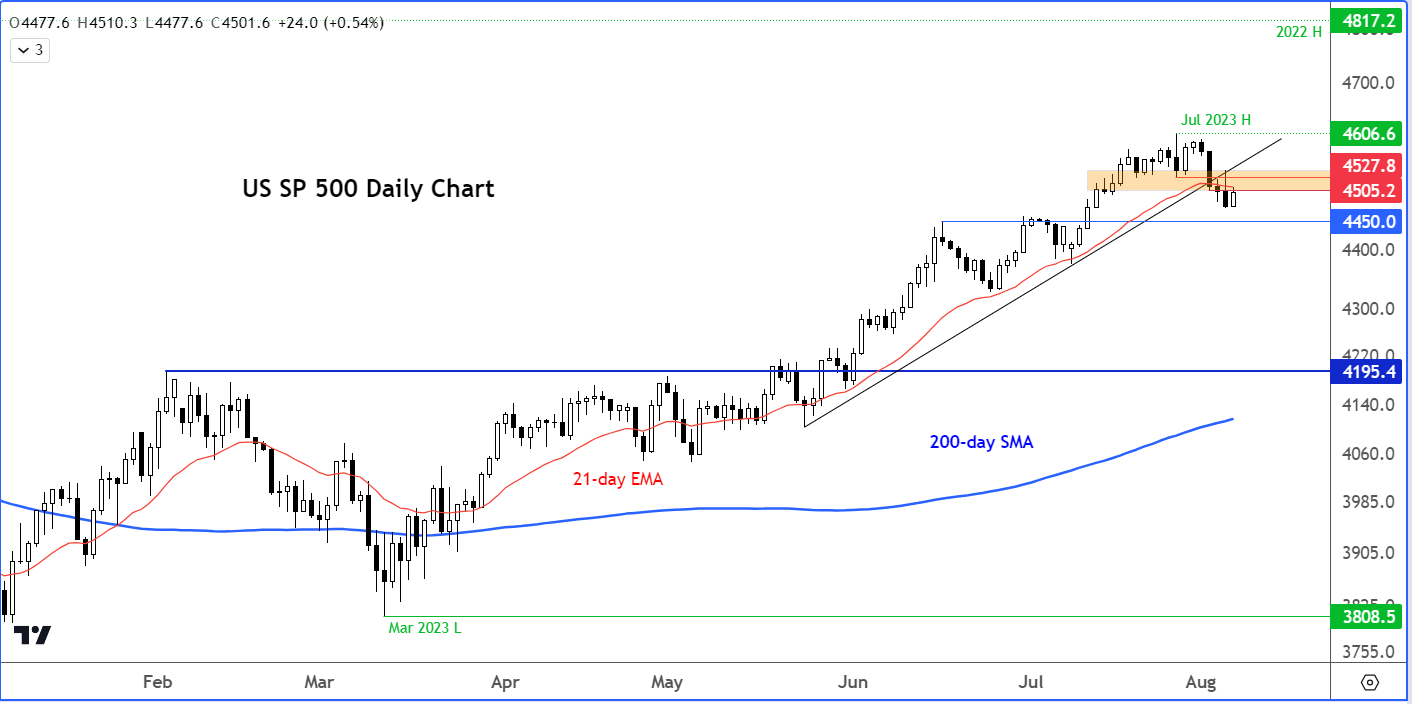
On Friday, the S&P gave up its earlier gains to turn lower, closing below the 21-day moving average and prior support around 4505 area.
Today, the stock market bulls must be relieved that despite Friday’s sharp reversal, there has been no downside follow through. However, like we saw on Friday, things could unravel quickly. There are still a few hours to go until the closing bell.
If by the close of play the markets are still holding onto their gains, then this would be a bullish technical development heading into Tuesday’s session.
However, another bearish close is what we are wary of. If that were to happen, then look out below. As more investors rush for the exits, this will exacerbate the selling.
With a bullish trend line already broken, the short-term path of least resistance is to the downside. But we will stop short of calling this the top. The strong bullish trend has to weaken first before most traders would even entertain the idea of shorting the markets.
Source for all charts used in this article: TradingView.com
-- Written by Fawad Razaqzada, Market Analyst
Follow Fawad on Twitter @Trader_F_R
How to trade with City Index
You can trade with City Index by following these four easy steps:
- Open an account, or log in if you’re already a customer
• Open an account in the UK
• Open an account in Australia
• Open an account in Singapore
- Search for the company you want to trade in our award-winning platform
- Choose your position and size, and your stop and limit levels
- Place the trade
Related tags:




Open an account in minutes
Experience award-winning platforms with fast and secure execution, and enjoy tight spreads from 0.5 pts on FX and 0.3 pts on indices.
Economic calendar
Web Trader platform
Our sophisticated web-based platform is packed with features.
Related articles
This report is intended for general circulation only. It should not be construed as a recommendation, or an offer (or solicitation of an offer) to buy or sell any financial products. The information provided does not take into account your specific investment objectives, financial situation or particular needs. Before you act on any recommendation that may be contained in this report, independent advice ought to be sought from a financial adviser regarding the suitability of the investment product, taking into account your specific investment objectives, financial situation or particular needs.
StoneX Financial Pte. Ltd., may distribute reports produced by its respective foreign entities or affiliates within the StoneX group of companies or third parties pursuant to an arrangement under Regulation 32C of the Financial Advisers Regulations. Where the report is distributed to a person in Singapore who is not an accredited investor, expert investor or an institutional investor (as defined in the Securities Futures Act), StoneX Financial Pte. Ltd. accepts legal responsibility to such persons for the contents of the report only to the extent required by law. Singapore recipients should contact StoneX Financial Pte. Ltd. at 6826 9988 for matters arising from, or in connection with the report.
In the case of all other recipients of this report, to the extent permitted by applicable laws and regulations neither StoneX Financial Pte. Ltd. nor its associated companies will be responsible or liable for any loss or damage incurred arising out of, or in connection with, any use of the information contained in this report and all such liability is hereby expressly disclaimed. No representation or warranty is made, express or implied, that the content of this report is complete or accurate.
StoneX Financial Pte. Ltd. is not under any obligation to update this report.
Trading CFDs carries a high level of risk that may not be suitable for some investors. Consider your investment objectives, level of experience, financial resources, risk appetite and other relevant circumstances carefully. The possibility exists that you could lose some or all of your investments, including your initial deposits. If in doubt, please seek independent expert advice. Visit www.forex.com/en-sg/terms-and-policies for the complete Risk Disclosure Statement.