



S&P 500 Outlook: SPX approaches all-time highs once again
The U.S. S&P 500 index has posted one of its strongest streaks of 2026, recording seven consecutive bullish sessions, with a gain of more than 6% in the short term.
Share this:

The U.S. S&P 500 index has posted one of its strongest streaks of 2026, recording seven consecutive bullish sessions, with a gain of more than 6% in the short term.
The sustained buying pressure in the index is being driven by a renewed risk appetite, supported by easing tensions in the Middle East and declining U.S. bond yields in the short term. These factors have created conditions for demand to remain strong in the SPX, and this dynamic could continue to support the market in the coming sessions, as long as confidence remains stable.
Confidence dominates the markets
Despite the ongoing naval blockade in the Strait of Hormuz by the United States, both sides of the Middle East conflict have expressed willingness to resume negotiations during the week. This suggests that diplomacy is becoming the primary path forward, and for now, no significant escalation is expected in the short term.
The possibility of an agreement has begun to reduce uncertainty related to potential disruptions in global energy supply, allowing for a more stable short-term confidence environment.
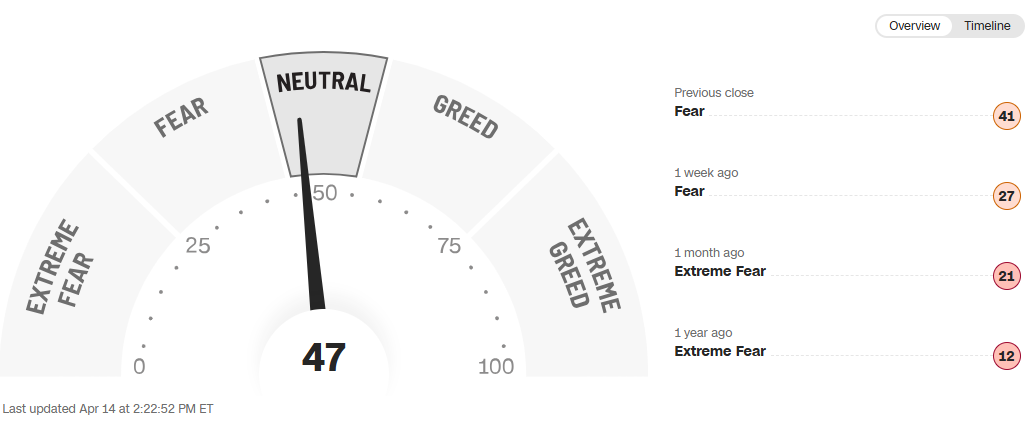
This effect can be observed in the Fear and Greed Index, which is currently around 47 points, marking a significant improvement from 27 points a week ago and 21 points a month ago. The index has entered the neutral zone, highlighting a steady recovery in market sentiment.
Source: CNN
In this environment of improving confidence, demand for safe-haven assets such as the U.S. dollar has started to decline, while risk assets like the S&P 500 have gained momentum.
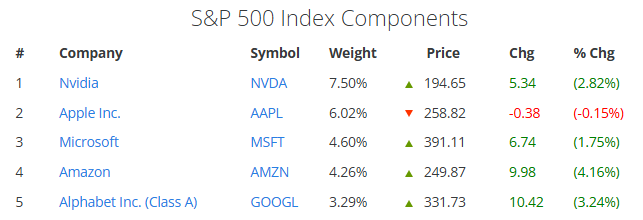
This is reflected in the performance of the index’s main components, with Nvidia up +2.82%, Microsoft +1.75%, Amazon leading with +4.16%, Google +3.24%, and only Apple showing a slight decline of -0.15%. Overall, this indicates that renewed confidence is supporting consistent demand in equities.
Source: Slickcharts
In this context, if calm conditions persist and negotiations continue to progress, the environment could remain favorable for continued demand in the S&P 500. However, this outlook depends on the absence of any renewed escalation in the Middle East conflict.
Bond yields begin to ease pressure
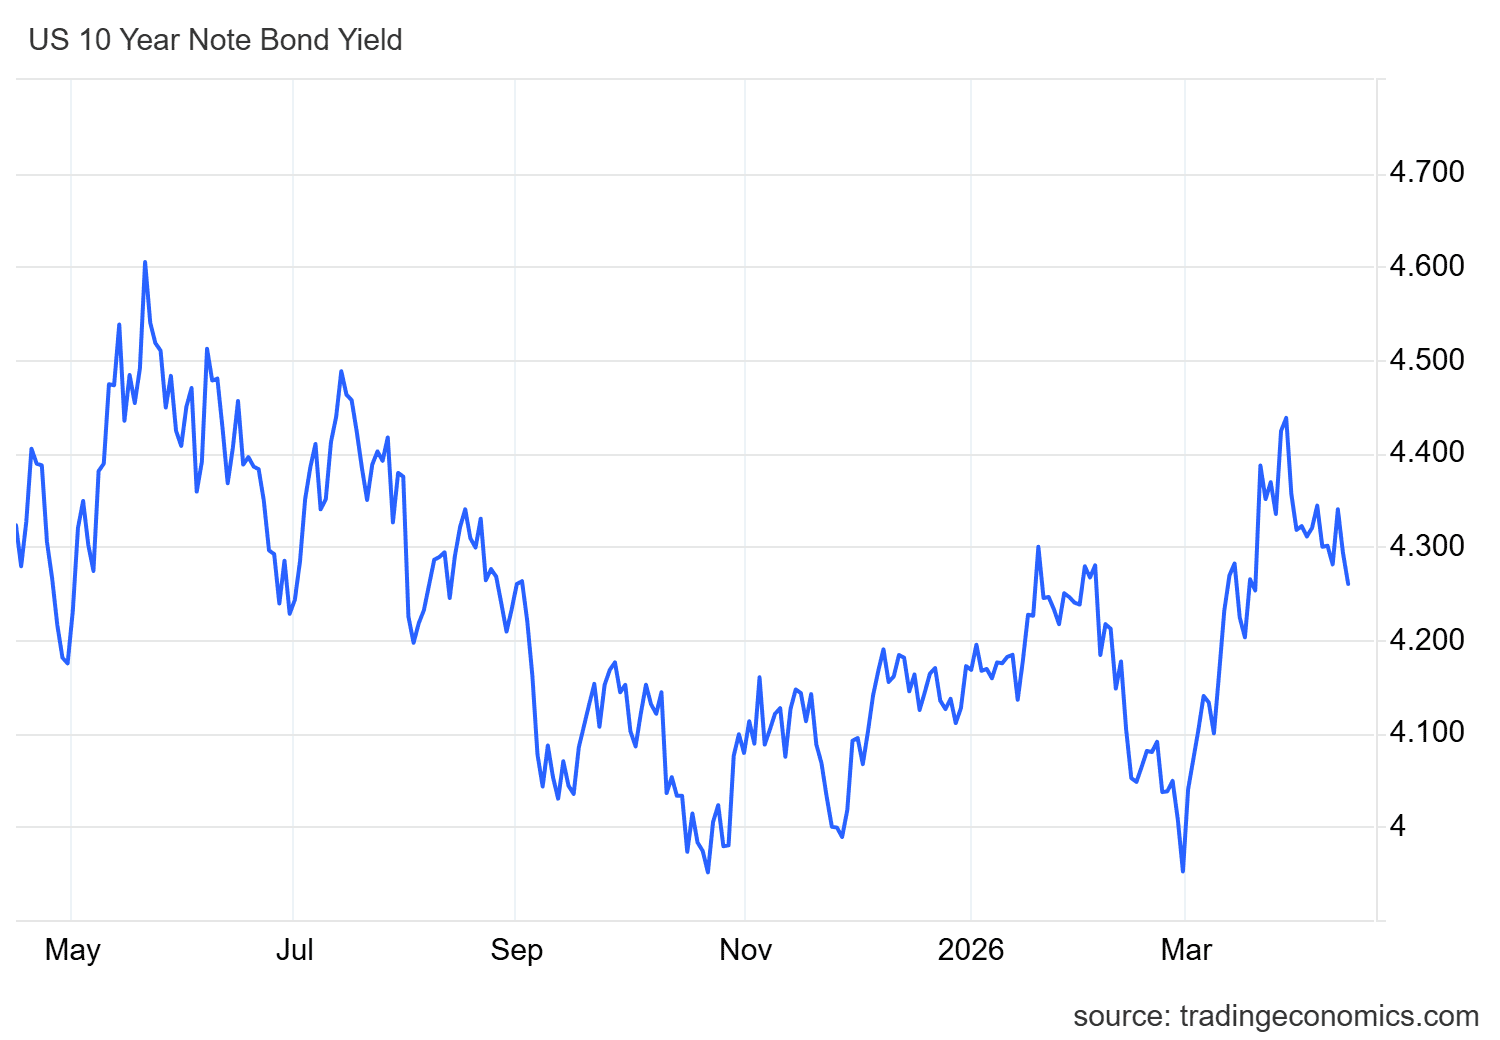
The behavior of U.S. 10-year Treasury yields has shown a notable decline in the short term, evidenced by the drop below the 4.3% level during the latest session. This move reflects a downward slope in recent sessions and confirms a consistent weakness in bond market yields in the near term.
Source: TradingEconomics
This development has started to create room for risk markets, as the loss of attractiveness in bond yields reduces demand for these safe-haven assets, shifting interest toward more attractive markets such as equities, in this case the S&P 500 index.
In this context, if fixed income continues to lose appeal, it could further support sustained demand for risk assets, which in turn may help maintain consistent buying pressure in the equity market in the coming sessions.
S&P 500 Technical Outlook
Source: StoneX, Tradingview
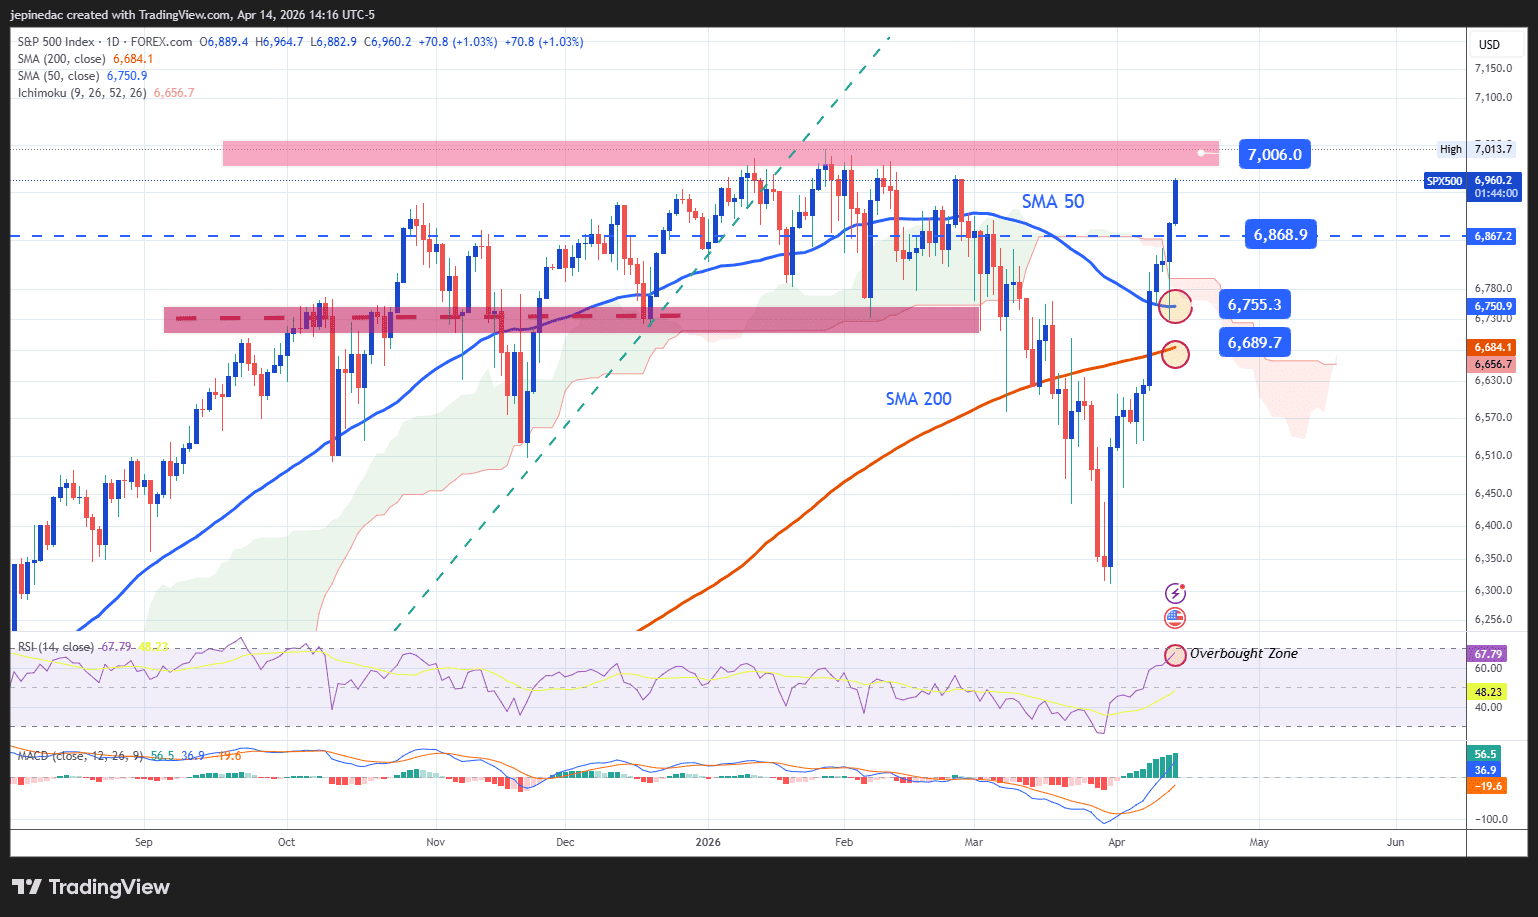
- Bullish momentum gains traction: The bullish bias has become more established in recent price action, pushing the index close to all-time highs. While a fully structured long-term uptrend is not yet confirmed, proximity to these levels could allow for the development of a more defined bullish structure in the coming weeks. However, it is important to note that the rapid price advance could also open the door for short-term corrective pullbacks.
- MACD: The MACD histogram remains above the zero line, indicating consistent bullish momentum in short-term moving averages. If this continues, buying pressure could remain relevant in the medium term.
- RSI: The RSI is approaching the overbought zone (70), suggesting that recent price action may be experiencing an excess of bullish momentum, which could lead to potential short-term corrections.
Key levels:
- 7,000 points – Key resistance: The all-time high zone and the main upside barrier. A break above this level could confirm a dominant bullish bias and support the formation of a more structured uptrend.
- 6,868 points – Near-term barrier: A relevant retracement level that could act as a reference point in case of short-term pullbacks.
- 6,755 points – Key support: A level aligned with the 50-period moving average. A move below this area could put the recent recovery at risk and lead to a more pronounced phase of indecision.
Written by Julian Pineda, CFA, CMT – Market Analyst
Follow him on: @julianpineda25




Open an account in minutes
Experience award-winning platforms with fast and secure execution, and enjoy tight spreads from 0.5 pts on FX and 0.3 pts on indices.
Economic calendar
Web Trader platform
Our sophisticated web-based platform is packed with features.
Related articles

S&P 500, Nasdaq, Dow Forecast: Wall Street Split Widens Into Month-End 9 26 2026
Nasdaq strength contrasts with mounting Dow pressure as rising Treasury yields raise the stakes for stocks heading into the monthly close.


Equity Indices Q4, 2026 Outlook: Cracks Begin to Show
There's still an open door for a melt-up in the S&P 500 and Nasdaq but the Dow and Russell 2000 are looking more vulnerable, and until calm hits the Treasuries market there's a higher probability for volatility. The big question is whether that's a next quarter theme or not.


S&P 500 Forecast: SPX rises as oil prices fall, but treasuries remain at multi-decade highs
U.S. stocks are rising on Friday after a volatile week that saw a surge in Treasury yields ripple through financial markets.

This report is intended for general circulation only. It should not be construed as a recommendation, or an offer (or solicitation of an offer) to buy or sell any financial products. The information provided does not take into account your specific investment objectives, financial situation or particular needs. Before you act on any recommendation that may be contained in this report, independent advice ought to be sought from a financial adviser regarding the suitability of the investment product, taking into account your specific investment objectives, financial situation or particular needs.
StoneX Financial Pte. Ltd., may distribute reports produced by its respective foreign entities or affiliates within the StoneX group of companies or third parties pursuant to an arrangement under Regulation 32C of the Financial Advisers Regulations. Where the report is distributed to a person in Singapore who is not an accredited investor, expert investor or an institutional investor (as defined in the Securities Futures Act), StoneX Financial Pte. Ltd. accepts legal responsibility to such persons for the contents of the report only to the extent required by law. Singapore recipients should contact StoneX Financial Pte. Ltd. at 6826 9988 for matters arising from, or in connection with the report.
In the case of all other recipients of this report, to the extent permitted by applicable laws and regulations neither StoneX Financial Pte. Ltd. nor its associated companies will be responsible or liable for any loss or damage incurred arising out of, or in connection with, any use of the information contained in this report and all such liability is hereby expressly disclaimed. No representation or warranty is made, express or implied, that the content of this report is complete or accurate.
StoneX Financial Pte. Ltd. is not under any obligation to update this report.
Trading CFDs carries a high level of risk that may not be suitable for some investors. Consider your investment objectives, level of experience, financial resources, risk appetite and other relevant circumstances carefully. The possibility exists that you could lose some or all of your investments, including your initial deposits. If in doubt, please seek independent expert advice. Visit www.forex.com/en-sg/terms-and-policies for the complete Risk Disclosure Statement.