



Tariff Concerns Lift EURUSD Above 1.18, Gold Above 5,100
Trump’s proposed 15% tariff retaliation, following the Supreme Court’s rejection of the earlier 10% blanket tariff, will be tested on Tuesday. This development is capping dollar gains while lifting EURUSD and gold.
Share this:

Key Events
- DXY pulls back below the 98 mark on renewed tariff concerns, boosting EURUSD back above 1.18 and gold above 5,100.
- Trump aims to implement a 15% tariff blanket after the Supreme Court rejected the 10%, reviving April 2025 drawdown risks across the dollar, energy, and risk assets, while keeping haven assets and major currencies supported.
- Key technical levels continue to hold, helping confirm whether moves across DXY, EURUSD, and Gold reflect structural shifts or merely headline-driven volatility.
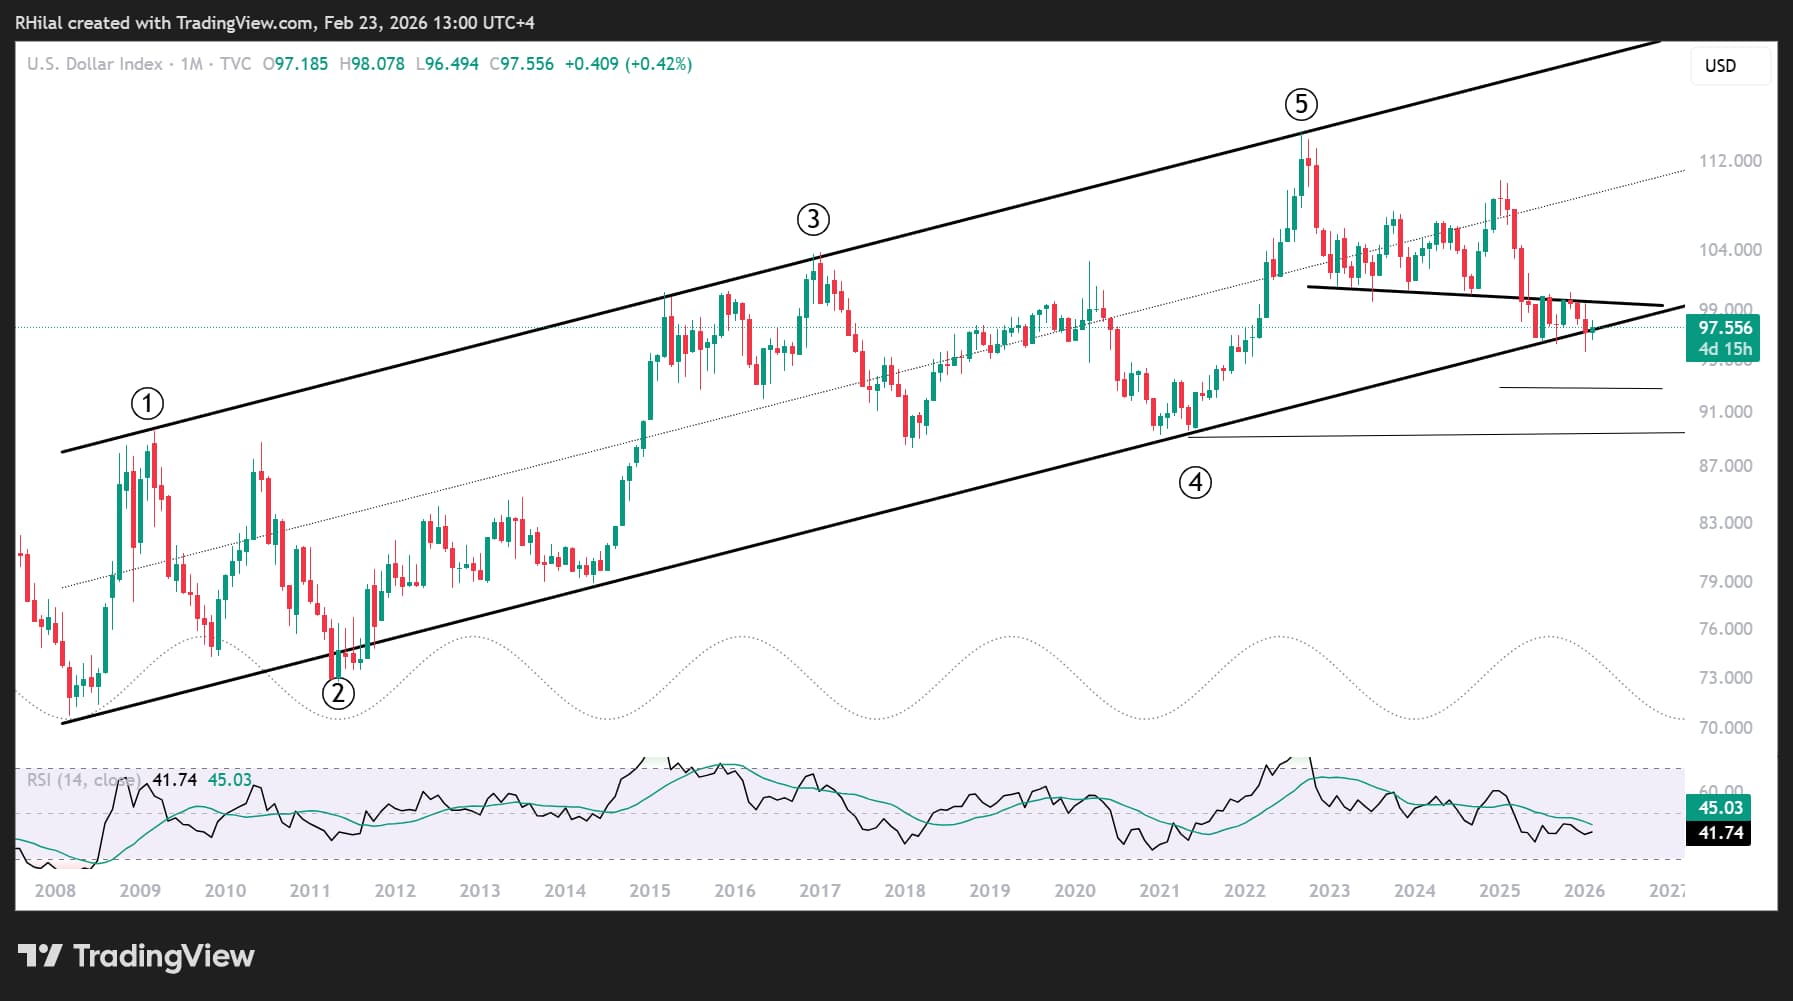
If you’ve been following my articles, you’ve likely seen this chart several times. I use it to monitor the long-term structure of the DXY amid volatile headlines driven by geopolitical tensions, economic data, Fed rate expectations, and tariffs.
DXY Outlook: Monthly Time Frame – Log Scale
Source: Trading view
The DXY’s latest pullback from the 98 resistance level has revived bearish concerns as price continues to hold the 2008–2026 ascending trendline. The sharp wick along that boundary in February preserves a bullish bias despite current headlines — unless we see a monthly close below the 97 and 96 marks, which would expose a structural shift in the pattern.
For now, consolidation below the 100 mark remains in play until a decisive breakout occurs in either direction, keeping the broader uptrend technically intact.
Translating this reading into EURUSD and Gold:

- EURUSD is trading back above 1.18, but remains below the 1.1950 resistance and yearly highs.
- Gold is trading back above 5,100, but still faces resistance at 5,300 and 5,600 before confirming a continuation toward the 6,000 threshold.
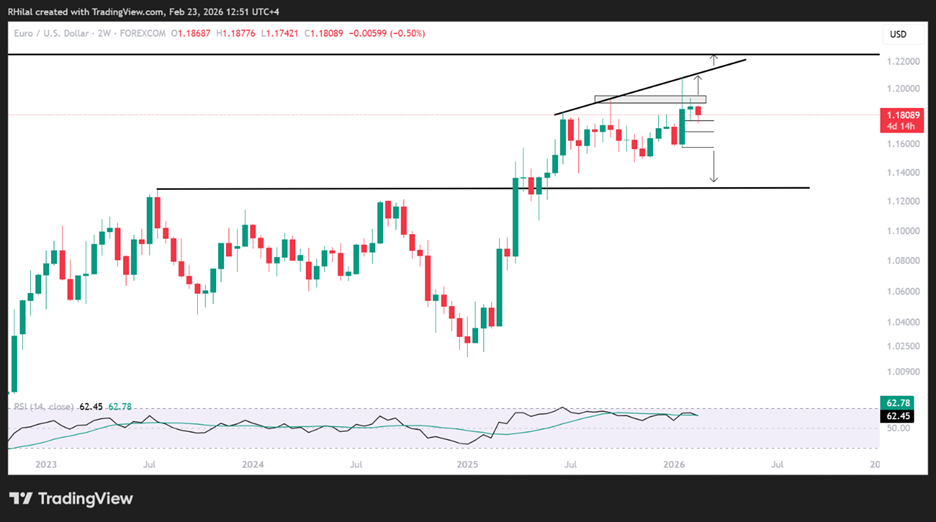
EURUSD Outlook: Two Week Time Frame – Log Scale
Source: Trading view
On the two week chart, EURUSD is facing resistance connecting consecutive higher highs since June 2025, capping gains below the key 1.1950 zone. A daily or weekly close above this level is required to reassert bullish bias toward 1.20, before potentially extending toward the 2022 and 2018 highs near 1.23 and 1.25 respectively.
That outlines the bullish scenario. However, recent price action is turning lower, with downside risks building. A break below 1.1760, which represents the 0.618 retracement of the 2026 advance, could open the door to deeper drawdowns toward:
• 1.1680
• 1.1580
The 1.1580 level becomes pivotal. A hold there could revive bullish momentum. Failure to stabilize may expose the 1.12–1.11 zone, a scenario in which renewed dollar strength takes control.
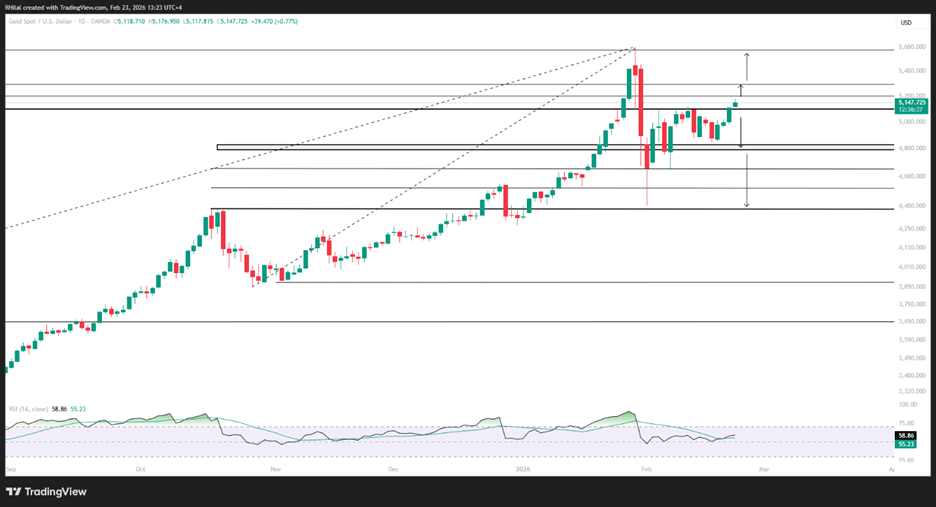
Gold Outlook: Two Week Time Frame – Log Scale
Source: Trading view
Gold prices are holding above the 5,100 mark following margin and liquidity adjustments earlier this year amid the 1,000 point swings. This maintains a bullish bias from a short-term perspective.
A clean hold above 5,200 would extend the next 100-point projection toward 5,300 — a key barrier separating a renewed long-term bullish push toward record highs and the 6,000 threshold, from a potential corrective drawdown back toward the 4,800 and 4,400 support levels. Closing below 4,400 would likely expose another 1,000-point drop.
Written by Razan Hilal, CMT
Follow on X: @Rh_waves
Latest market news




Open an account in minutes
Experience award-winning platforms with fast and secure execution, and enjoy tight spreads from 0.5 pts on FX and 0.3 pts on indices.
Economic calendar
Web Trader platform
Our sophisticated web-based platform is packed with features.
Related articles
Fed, DXY, EUR/USD, GBP/USD, USD/CAD, Gold Weekly Technical Outlook 10 26 2026
Sr. Technical Strategist Michael Boutros highlights the levels that matter on the USD Majors, commodities, and equity indices charts this week.
EUR/USD Update: Euro Weakness Returns Ahead of Central Bank Decisions
A new trading week is underway and the euro continues to show signs of weakness in the short term. This can be seen in the recent performance of EUR/USD, which has fallen nearly 0.5% over the last three trading sessions, reflecting a relatively consistent loss of momentum in the European currency.


Brent Crude Oil and Forex Technical Analysis | Oil Gaps Lower
Brent crude oil gaps sharply lower after an extended rally, while several forex pairs approach key technical levels. We examine the latest setups across oil, EUR/USD, USD/JPY and other major currency pairs.

This report is intended for general circulation only. It should not be construed as a recommendation, or an offer (or solicitation of an offer) to buy or sell any financial products. The information provided does not take into account your specific investment objectives, financial situation or particular needs. Before you act on any recommendation that may be contained in this report, independent advice ought to be sought from a financial adviser regarding the suitability of the investment product, taking into account your specific investment objectives, financial situation or particular needs.
StoneX Financial Pte. Ltd., may distribute reports produced by its respective foreign entities or affiliates within the StoneX group of companies or third parties pursuant to an arrangement under Regulation 32C of the Financial Advisers Regulations. Where the report is distributed to a person in Singapore who is not an accredited investor, expert investor or an institutional investor (as defined in the Securities Futures Act), StoneX Financial Pte. Ltd. accepts legal responsibility to such persons for the contents of the report only to the extent required by law. Singapore recipients should contact StoneX Financial Pte. Ltd. at 6826 9988 for matters arising from, or in connection with the report.
In the case of all other recipients of this report, to the extent permitted by applicable laws and regulations neither StoneX Financial Pte. Ltd. nor its associated companies will be responsible or liable for any loss or damage incurred arising out of, or in connection with, any use of the information contained in this report and all such liability is hereby expressly disclaimed. No representation or warranty is made, express or implied, that the content of this report is complete or accurate.
StoneX Financial Pte. Ltd. is not under any obligation to update this report.
Trading CFDs carries a high level of risk that may not be suitable for some investors. Consider your investment objectives, level of experience, financial resources, risk appetite and other relevant circumstances carefully. The possibility exists that you could lose some or all of your investments, including your initial deposits. If in doubt, please seek independent expert advice. Visit www.forex.com/en-sg/terms-and-policies for the complete Risk Disclosure Statement.