




Tesla, Microsoft: Earnings in Focus
Market optimism lifts ahead of key mega-cap earnings and tonight’s FOMC meeting, in line with a sharp dollar drawdown and a revival in AI-related sentiment. However, the steepness of recent trends warrants contrarian caution.
Share this:

Key Trends
- Tesla earnings are expected to decline amid rising competition from BYD and weakening EV adoption rates
- Microsoft earnings lean to the bullish side, supported by AI optimism and the Nasdaq’s and S&P 500’s push toward record highs
- Nasdaq and the S&P 500 hold near record levels, while the Dow diverges on defensiveness and missed earnings expectations from UnitedHealth
- Latest video with Stone X : U.S. Equity Rally Tested by Fed Decision and Tesla Microsoft Earnings
SP500, Nasdaq, Dow Jones Weekly Outlook
Source: Trading view
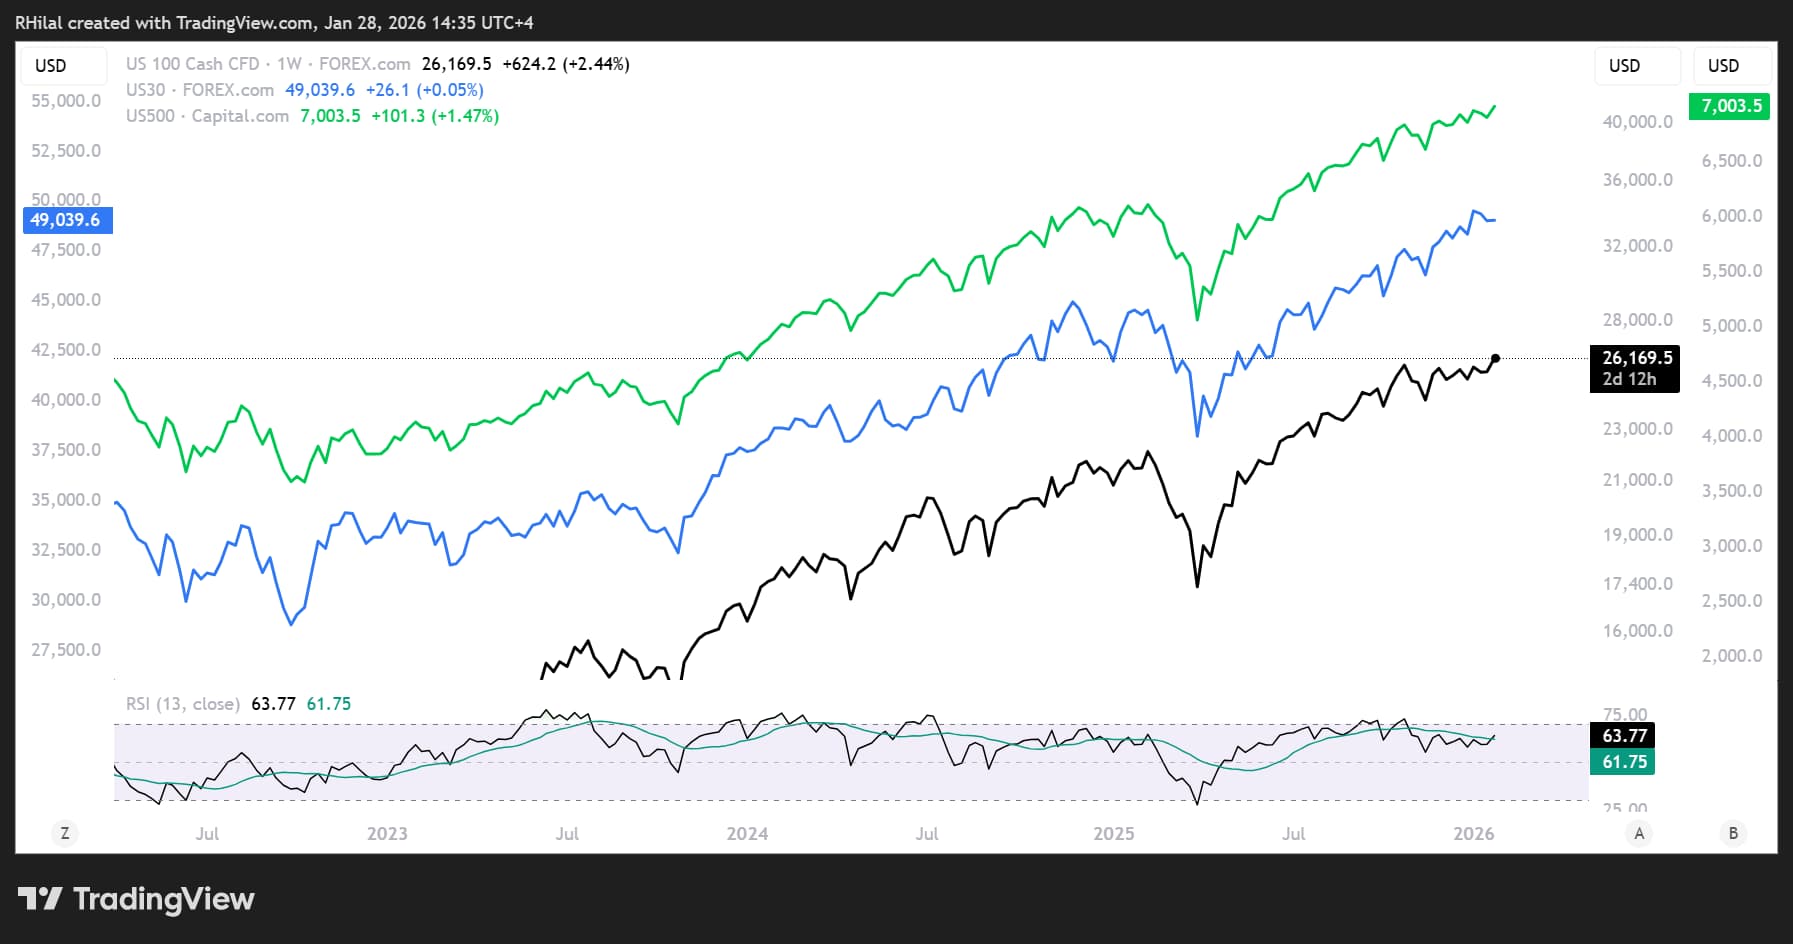
With key earnings in focus this week, AI-related optimism continues to drive both the S&P 500 and Nasdaq higher. In contrast, the Dow remains under pressure following negative earnings from UnitedHealth near the 49,000 mark. This divergence keeps key technical levels and confirmations in focus, especially as markets remain highly sensitive to geopolitical tariff headlines and earnings-driven volatility, pushing gold near record levels around 5,200.
The following charts are presented on higher time frames to align short-term headlines with primary frameworks and dominant trends.
Tesla Outlook: Monthly Time Frame – Log Scale
Source: Trading view
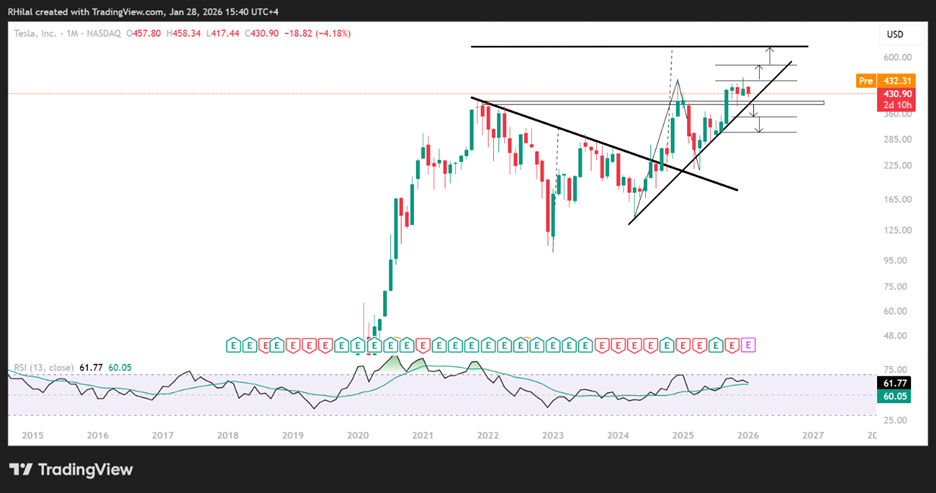
While Tesla posted revenue of $28.1B in the previous quarter, current expectations point to a decline toward $24.8B, driven by intensifying competition from BYD and weakening EV adoption rates from reduced incentives. Tesla’s price action has remained in consolidation below the 490 record high since October 2025, in line with rising growth risks as the company shifts strategic focus toward autonomy.
Looking at the Tesla chart on the monthly timeframe, we can see a large inverted bullish continuation head-and-shoulders pattern stretching from November 2021 to September 2024. The bullish bias can also be supported by a trendline connecting higher lows from April 2025 through January 2026.
If this pattern continues to play out, and if Tesla can overcome competitive pressure from BYD and broader EV‑adoption concerns, then a clean hold above 500 should open the way toward 560 first, and 660 in extended scenarios. Those upside targets also align with the 100% and 127% Fibonacci extensions measured from the April 2024 low → December 2024 high → April 2025 low.
On the downside, if earnings disappoint or we close back below the 400 mark, the bias shifts lower toward 348 and then 303, which remain key support zones.
Microsoft Outlook: Weekly Time Frame – Log Scale
Source: Trading view
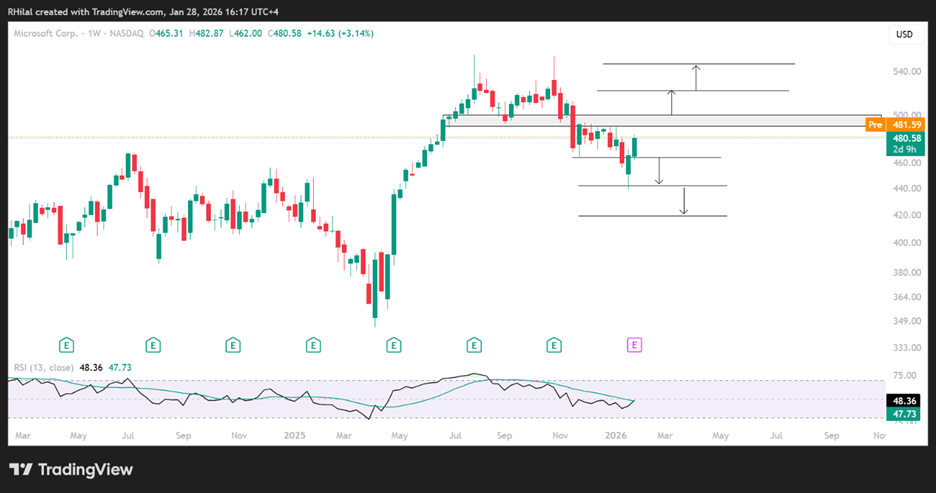
Microsoft is also due to report today after the bell, with Wall Street expecting strong results of around $80B in revenue, driven by continued 40% Azure growth and broad AI adoption across Azure and Copilot. Despite the stock trading roughly 14% below its highs, analyst sentiment remains bullish, and a solid cloud and AI performance could help reignite upside momentum.
From a technical perspective, the weekly trend remains in a bullish rebound, supported by rising Copilot and AI adoption across global institutions. Price is currently pushing back toward the 490 neckline of the double-top pattern that triggered the drawdown from July 2025 into January 2026.
A sustained hold above 500 would open the way for a move back toward record zones near 521 and 546. On the downside, if sentiment turns risk-off, a break below 460 would likely redirect the trend toward 440 and 420, which could present potential dip-buying opportunities.
Written by Razan Hilal, CMT
Follow on X: @Rh_waves
Related tags:
Latest market news




Open an account in minutes
Experience award-winning platforms with fast and secure execution, and enjoy tight spreads from 0.5 pts on FX and 0.3 pts on indices.
Economic calendar
Web Trader platform
Our sophisticated web-based platform is packed with features.
Related articles

Magnificent Seven Earnings Preview: Is the AI Boom Facing Its Biggest Test Yet?
After a wobble in the broader AI trade, the Magnificent Seven" stocks are reporting earnings in the coming week - see the key themes and Nasdaq 100 levels to watch!


AUD/USD coils ahead of US CPI as breakout risk builds
The Aussie is coiling beneath 0.7000 ahead of US CPI, with its relationship with US front-end yields strengthening sharply just as markets question whether the Fed will need to hike again this month.


Treasury Auctions Explained: Why Bond Auctions Matter, Even if You Don’t Trade Bonds
You may never trade a Treasury bond, but if you trade the US dollar, gold, or stock indices, US Treasury auctions are worth understanding - read on for everything you need to know!
This report is intended for general circulation only. It should not be construed as a recommendation, or an offer (or solicitation of an offer) to buy or sell any financial products. The information provided does not take into account your specific investment objectives, financial situation or particular needs. Before you act on any recommendation that may be contained in this report, independent advice ought to be sought from a financial adviser regarding the suitability of the investment product, taking into account your specific investment objectives, financial situation or particular needs.
StoneX Financial Pte. Ltd., may distribute reports produced by its respective foreign entities or affiliates within the StoneX group of companies or third parties pursuant to an arrangement under Regulation 32C of the Financial Advisers Regulations. Where the report is distributed to a person in Singapore who is not an accredited investor, expert investor or an institutional investor (as defined in the Securities Futures Act), StoneX Financial Pte. Ltd. accepts legal responsibility to such persons for the contents of the report only to the extent required by law. Singapore recipients should contact StoneX Financial Pte. Ltd. at 6826 9988 for matters arising from, or in connection with the report.
In the case of all other recipients of this report, to the extent permitted by applicable laws and regulations neither StoneX Financial Pte. Ltd. nor its associated companies will be responsible or liable for any loss or damage incurred arising out of, or in connection with, any use of the information contained in this report and all such liability is hereby expressly disclaimed. No representation or warranty is made, express or implied, that the content of this report is complete or accurate.
StoneX Financial Pte. Ltd. is not under any obligation to update this report.
Trading CFDs carries a high level of risk that may not be suitable for some investors. Consider your investment objectives, level of experience, financial resources, risk appetite and other relevant circumstances carefully. The possibility exists that you could lose some or all of your investments, including your initial deposits. If in doubt, please seek independent expert advice. Visit www.forex.com/en-sg/terms-and-policies for the complete Risk Disclosure Statement.