


UAE MSCI and S&P 500 Outlook: Key Levels to Watch
Price action in both the UAE MSCI and S&P 500 has been consolidating for several months, leaving each market at a key technical juncture. The direction of any breakout could offer insight into the health of UAE and US markets as risk sentiment remains subdued, crude oil prices stay elevated, and major earnings reports and elections approach.
Share this:

Price action in both the UAE MSCI and S&P 500 has been consolidating for several months, leaving each market at a key technical juncture. The direction of any breakout could offer insight into the health of UAE and US markets as risk sentiment remains subdued, crude oil prices stay elevated, and major earnings reports and elections approach.
The UAE MSCI tracks the performance of large- and mid-cap UAE equities, with financial stocks carrying the largest sector weighting. The S&P 500, meanwhile, reflects the performance of leading US companies. Both indices are showing similar consolidation patterns and currently have a neutral-to-positive correlation.
I cover these charts in my weekly webinars, held every Tuesday 12:30 PM GST
Key catalysts for both markets include technology and AI earnings, crude oil prices, geopolitical developments, and the approaching Israeli and US elections on October 27 and November 3, respectively.
Regional tensions and attacks on shipping and energy infrastructure could have a more direct impact on UAE markets, given their sensitivity to regional developments, crude oil and inflation. Changes in expectations for AI and technology companies may have a more direct effect on the S&P 500, with potential spillover to UAE markets through their exposure to technology and AI investment across sectors.
Against this backdrop, the patterns on both charts may offer clues about market direction ahead of megacap earnings, central-bank decisions and elections in the coming weeks.
S&P 500 Price Outlook: Daily Time Frame – Log Scale
Source: TradingView
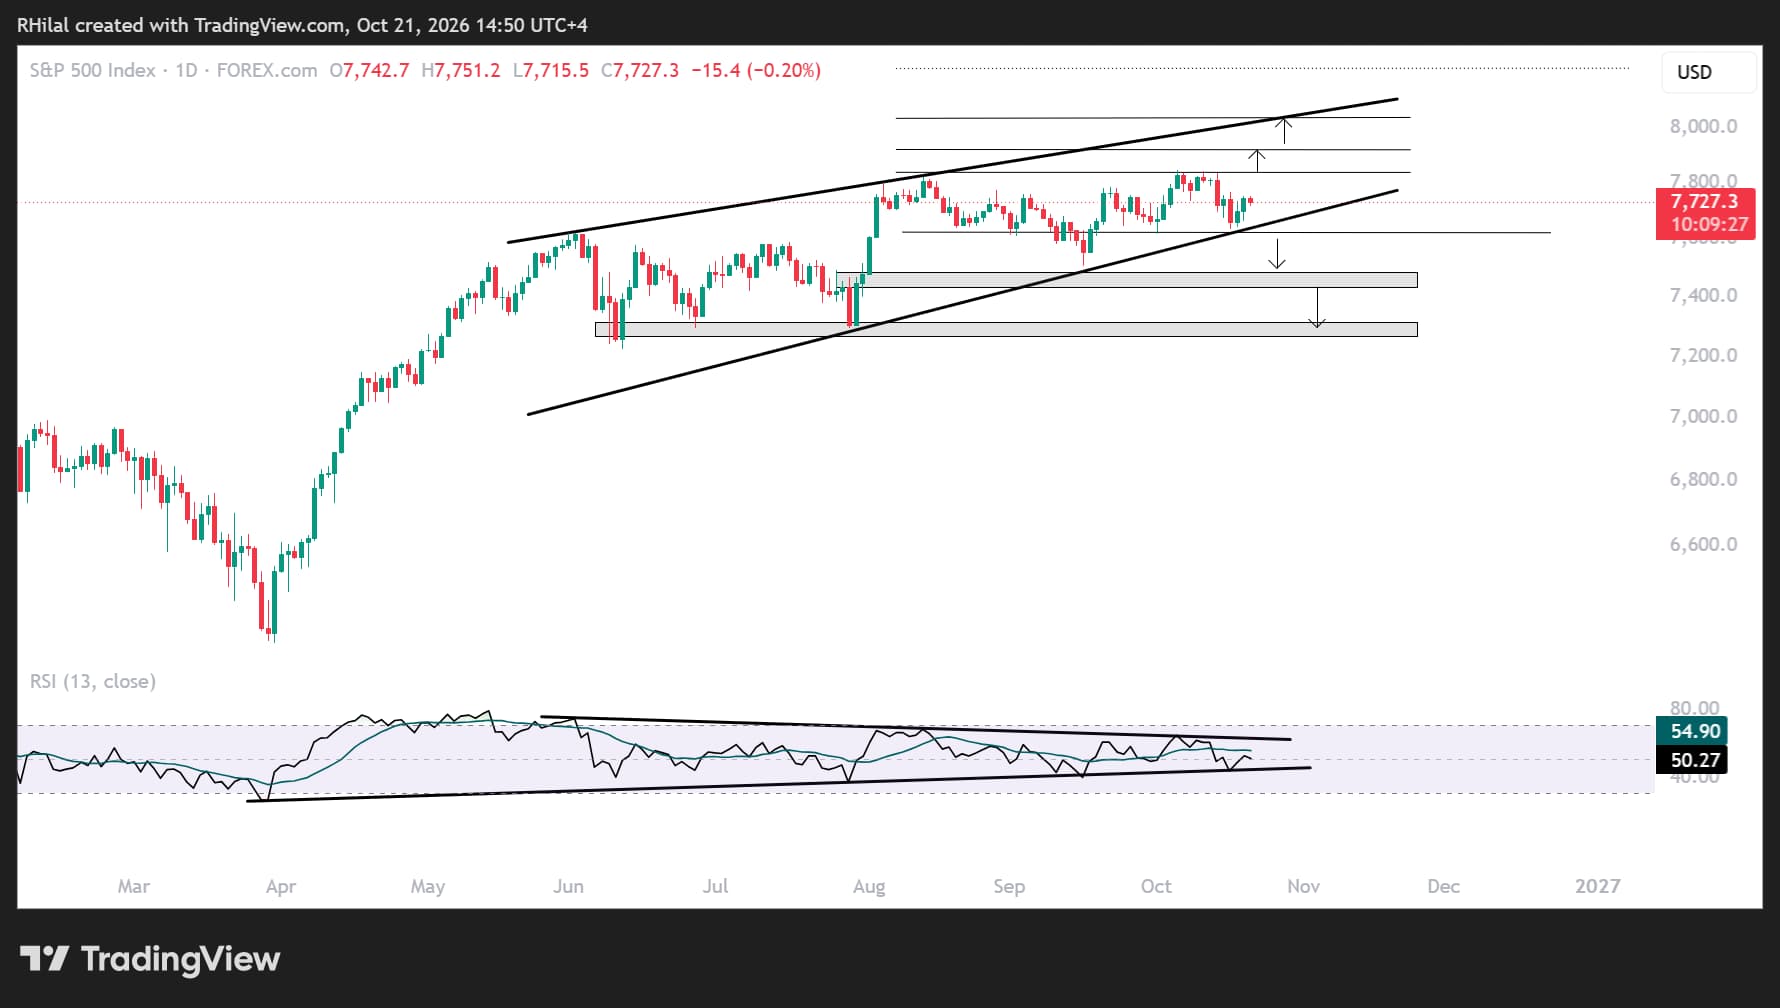
The S&P 500 has been coiling within a contracting consolidation on both the daily price chart and RSI for nearly five months. In technical analysis, a prolonged consolidation can precede a sharp breakout, although the direction is not clear until price confirms it. With major catalysts approaching—including technology and AI earnings, the Israeli election and the US midterm elections—a significant move may be on the horizon.
On the weekly chart, a bearish divergence between price and RSI highlights drawdown risks. Those risks could increase if geopolitical developments deteriorate and weigh on technology and AI company margins. The divergence coincides with RSI overbought levels last seen in September 2025 and July 2024.
A break below 7,610 would confirm the bearish scenario and expose the 27.2% retracement of the March–August advance near 7,420. This could be an area for a short-term rebound; a deeper decline would bring the 38.2% retracement near 7,250 into focus. That level also marks a support zone respected in June and July 2026.
On the upside, the index has pulled back twice from its record high near 7,830, which aligns with the 78.6% extension of the April 22, 2025–January 28, 2026–March 31, 2026 move. A breakout above the record high would expose the 100% extension near 8,240. In the shorter term, resistance may emerge around 7,900–7,920 and 8,000–8,030, along the rising trendline connecting higher highs from June to August.
UAE MSCI Price Outlook: Weekly Time Frame – Log Scale
Source: TradingView
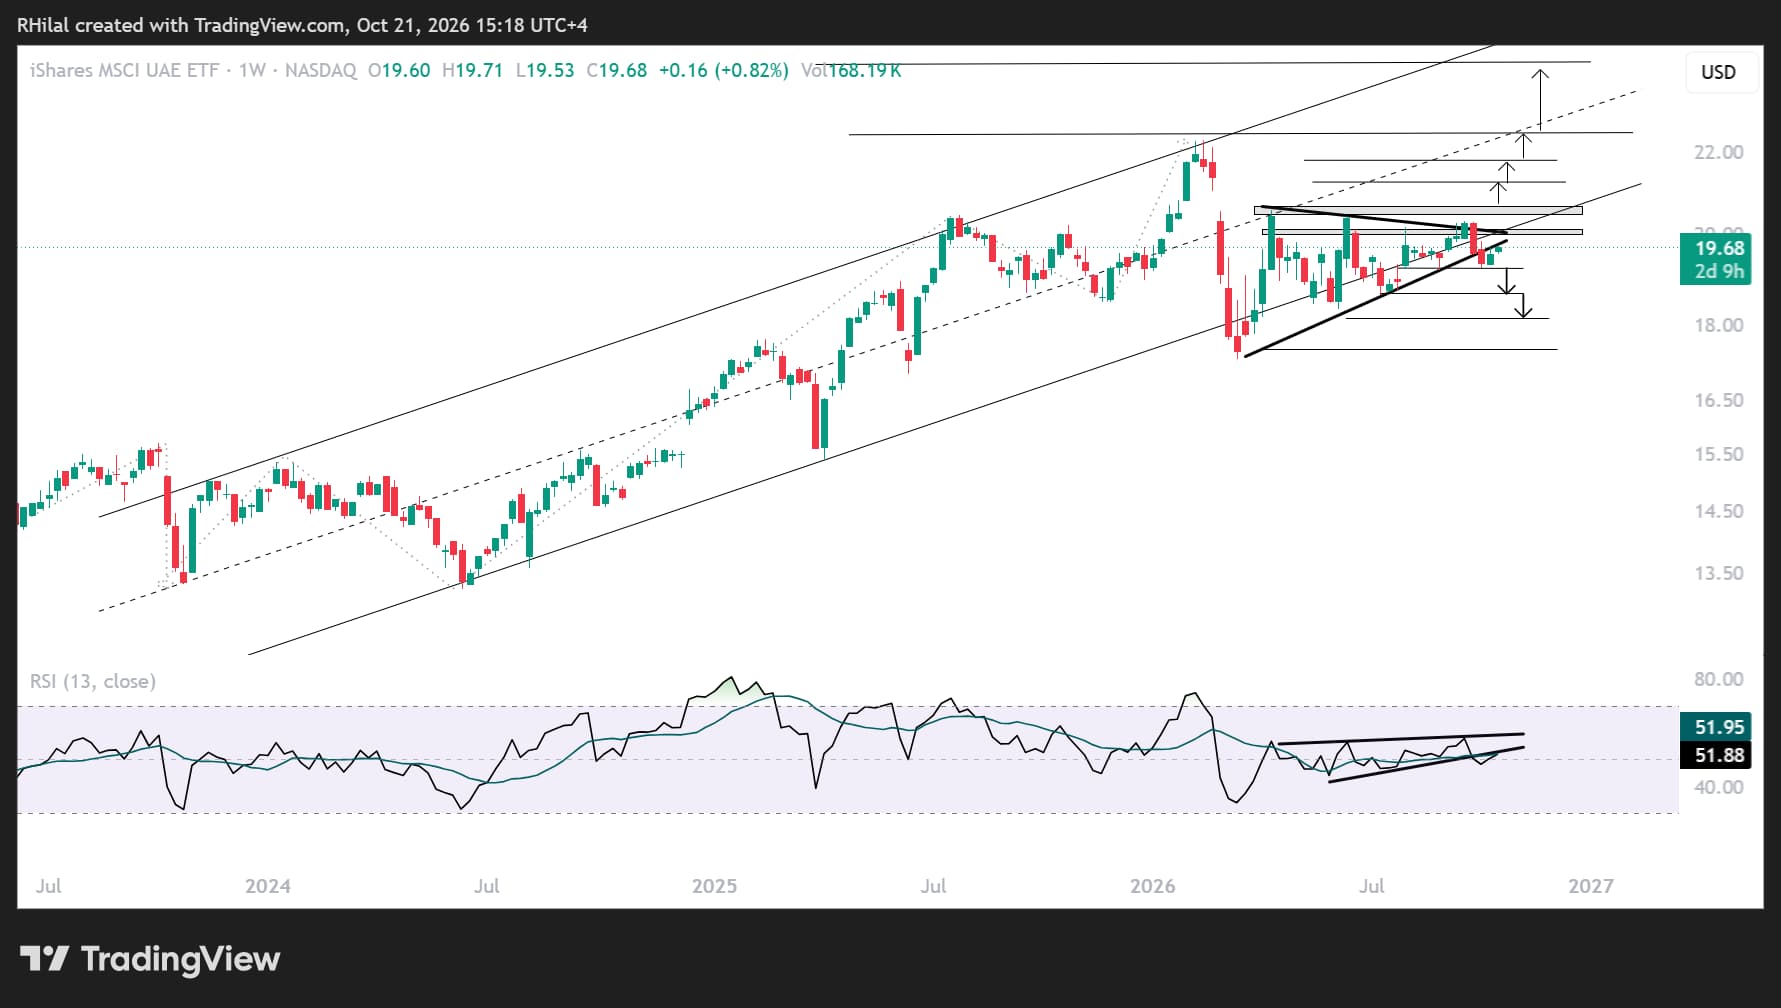
UAE markets may be directly affected by regional tensions and attacks on shipping through the Strait of Hormuz and on energy infrastructure. Bearish risks remain in focus as the index trades slightly below the boundary of its rising channel, respected since 2023, and the contracting consolidation that has been in place since March 2026.
Price and RSI are retesting the boundaries of this multi-month consolidation from below, leaving both bearish and bullish continuation scenarios in play. The key resistance zone is 19.75–19.87. A breakout above this zone would bring the index back in line with its bullish structure since 2023. Resistance near 20.30 would then be the next level to clear to confirm a potential continuation toward the yearly highs, possibly alongside improving risk sentiment and a more favorable geopolitical outlook.
On the downside, breaks below 19.20 and then 18.60 would increase bearish risks and bring the yearly lows into focus. A move below 18.60 could also put the three-year uptrend at risk, particularly if geopolitical conditions worsen.
For now, both charts retain a neutral-to-bullish bias, but confirmation is still needed. The boundaries of each multi-month consolidation provide key levels to monitor for a potential shift in direction and can help frame risk-management decisions.
Written by Razan Hilal, CMT
Follow on X: @Rh_waves



Open an account in minutes
Experience award-winning platforms with fast and secure execution, and enjoy tight spreads from 0.5 pts on FX and 0.3 pts on indices.
Economic calendar
Web Trader platform
Our sophisticated web-based platform is packed with features.
Related articles
UAE MSCI and S&P 500 Outlook: Key Levels to Watch
Price action in both the UAE MSCI and S&P 500 has been consolidating for several months, leaving each market at a key technical juncture. The direction of any breakout could offer insight into the health of UAE and US markets as risk sentiment remains subdued, crude oil prices stay elevated, and major earnings reports and elections approach.

Nasdaq 100 forecast: Stocks rebound ahead of more earnings
European indices recovered from a weaker start to turn positive by mid-morning trade, although US futures were still nursing small losses. Global indices were looking to add to their gains from the day before. Investors are weighing up encouraging earnings from SpaceX and Super Micro against elevated oil prices, which are limiting the upside for risk assets. We have more tech earnings coming up today which could shape the near-term Nasdaq 100 forecast.


New Zealand inflation report puts spotlight on hawkish RBNZ pricing
New Zealand's recovery is barely underway, yet markets have priced a series of RBNZ rate hikes. Thursday's inflation report will put that hawkish recalibration under the microscope.

This report is intended for general circulation only. It should not be construed as a recommendation, or an offer (or solicitation of an offer) to buy or sell any financial products. The information provided does not take into account your specific investment objectives, financial situation or particular needs. Before you act on any recommendation that may be contained in this report, independent advice ought to be sought from a financial adviser regarding the suitability of the investment product, taking into account your specific investment objectives, financial situation or particular needs.
StoneX Financial Pte. Ltd., may distribute reports produced by its respective foreign entities or affiliates within the StoneX group of companies or third parties pursuant to an arrangement under Regulation 32C of the Financial Advisers Regulations. Where the report is distributed to a person in Singapore who is not an accredited investor, expert investor or an institutional investor (as defined in the Securities Futures Act), StoneX Financial Pte. Ltd. accepts legal responsibility to such persons for the contents of the report only to the extent required by law. Singapore recipients should contact StoneX Financial Pte. Ltd. at 6826 9988 for matters arising from, or in connection with the report.
In the case of all other recipients of this report, to the extent permitted by applicable laws and regulations neither StoneX Financial Pte. Ltd. nor its associated companies will be responsible or liable for any loss or damage incurred arising out of, or in connection with, any use of the information contained in this report and all such liability is hereby expressly disclaimed. No representation or warranty is made, express or implied, that the content of this report is complete or accurate.
StoneX Financial Pte. Ltd. is not under any obligation to update this report.
Trading CFDs carries a high level of risk that may not be suitable for some investors. Consider your investment objectives, level of experience, financial resources, risk appetite and other relevant circumstances carefully. The possibility exists that you could lose some or all of your investments, including your initial deposits. If in doubt, please seek independent expert advice. Visit www.forex.com/en-sg/terms-and-policies for the complete Risk Disclosure Statement.