



US CPI Preview: Could the Fed Actually Hike Rates on a Hot Inflation Report?
While hawkish hopes are perhaps too elevated, a surprising CPI report could still drive abnormal volatility in major markets given uncertainty around the FOMC’s near-term path under Kevin Warsh.
Share this:

US CPI KEY TAKEAWAYS:
- US CPI expectations: 3.8% y/y headline inflation, 2.8% y/y core inflation
- A surprising CPI report could still drive abnormal volatility in major markets given uncertainty around the FOMC’s near-term path
- The Nasdaq 100 is poised for a potential higher-volatility breakout heading into one of the most important economic data releases of the month
When is the US CPI report?
The US CPI report for June will be released at 8:30ET (12:30 GMT) on Tuesday, July 14.
What are the US CPI Report Expectations?
Traders and economists are projecting headline CPI at -0.1% m/m (3.8% y/y) and Core CPI at +0.2% m/m (2.8% y/y).
US CPI Forecast
Are we past peak inflation?
That’s the question that will be top of mind for traders heading into the June CPI report. For the first time in three months, the Strait of Hormuz was (partially) open in the latter half of June, leading to a steep decline in energy prices, while the lingering effects of President Trump’s now-invalidated “Liberation Day” tariffs had presumably already worked their way through the economic machine.
Against that backdrop, traders and economists are expecting the first negative m/m reading in headline inflation in more than a year, a development that would ease some of the concerns about an imminent FOMC interest rate hike. As the chart below shows, Fed Funds Futures markets currently pricing in a 35% chance that the central bank will raise interest rates at its meeting later this month after a relatively hawkish meeting last month under new FOMC Chairman Kevin Warsh:
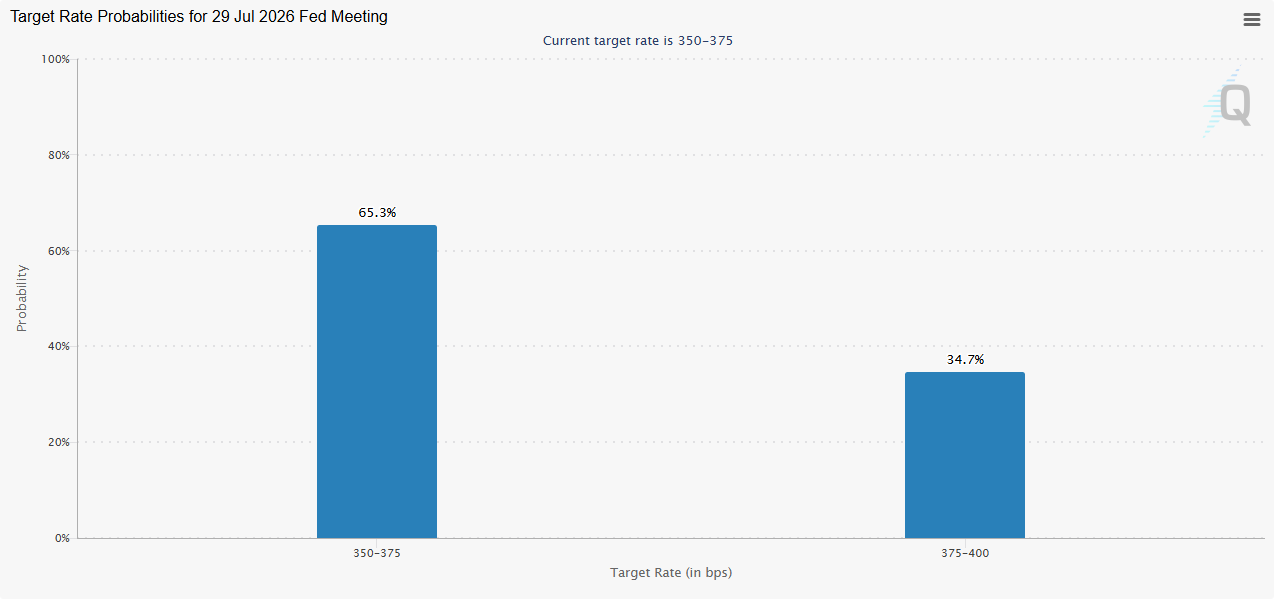
Source: CME FedWatch
While my view is that the hawks are getting overly optimistic, a surprising CPI report in combination with Chairman Warsh’s first Humphrey-Hawkins testimony at 10:00 ET the same day could still drive abnormal volatility in major markets given the uncertainty.
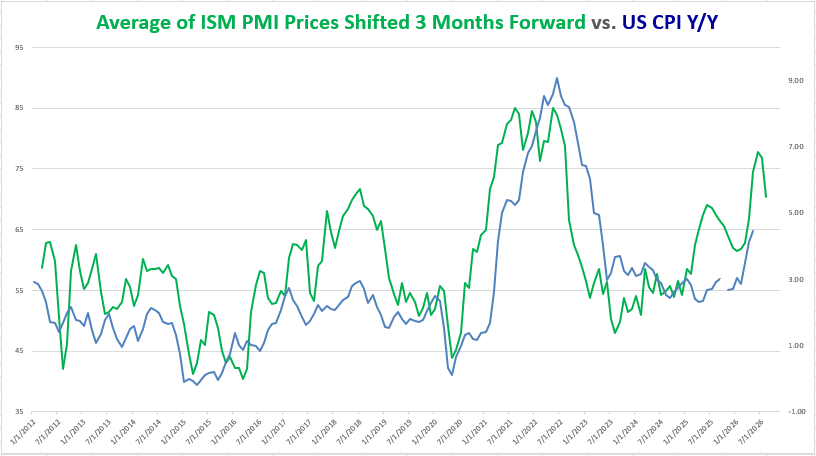
As many readers know, the Fed technically focuses on a different measure of inflation, Core PCE, when setting its policy, but for traders, the CPI report is at least as significant because it’s released weeks earlier. As we noted above, has remained stubbornly above the Fed’s 2% target for a half-decade already, and leading indicators are suggesting it could rise further from here:
Source: TradingView, StoneX
Looking at the chart above, the “Prices” components of the PMI reports have edged lower in recent months, hinting that the gap between that indicator and the headline CPI inflation rate could continue to narrow in the coming months.
Nasdaq 100 Technical Analysis – NDX Daily Chart
Source: TradingView, StoneX
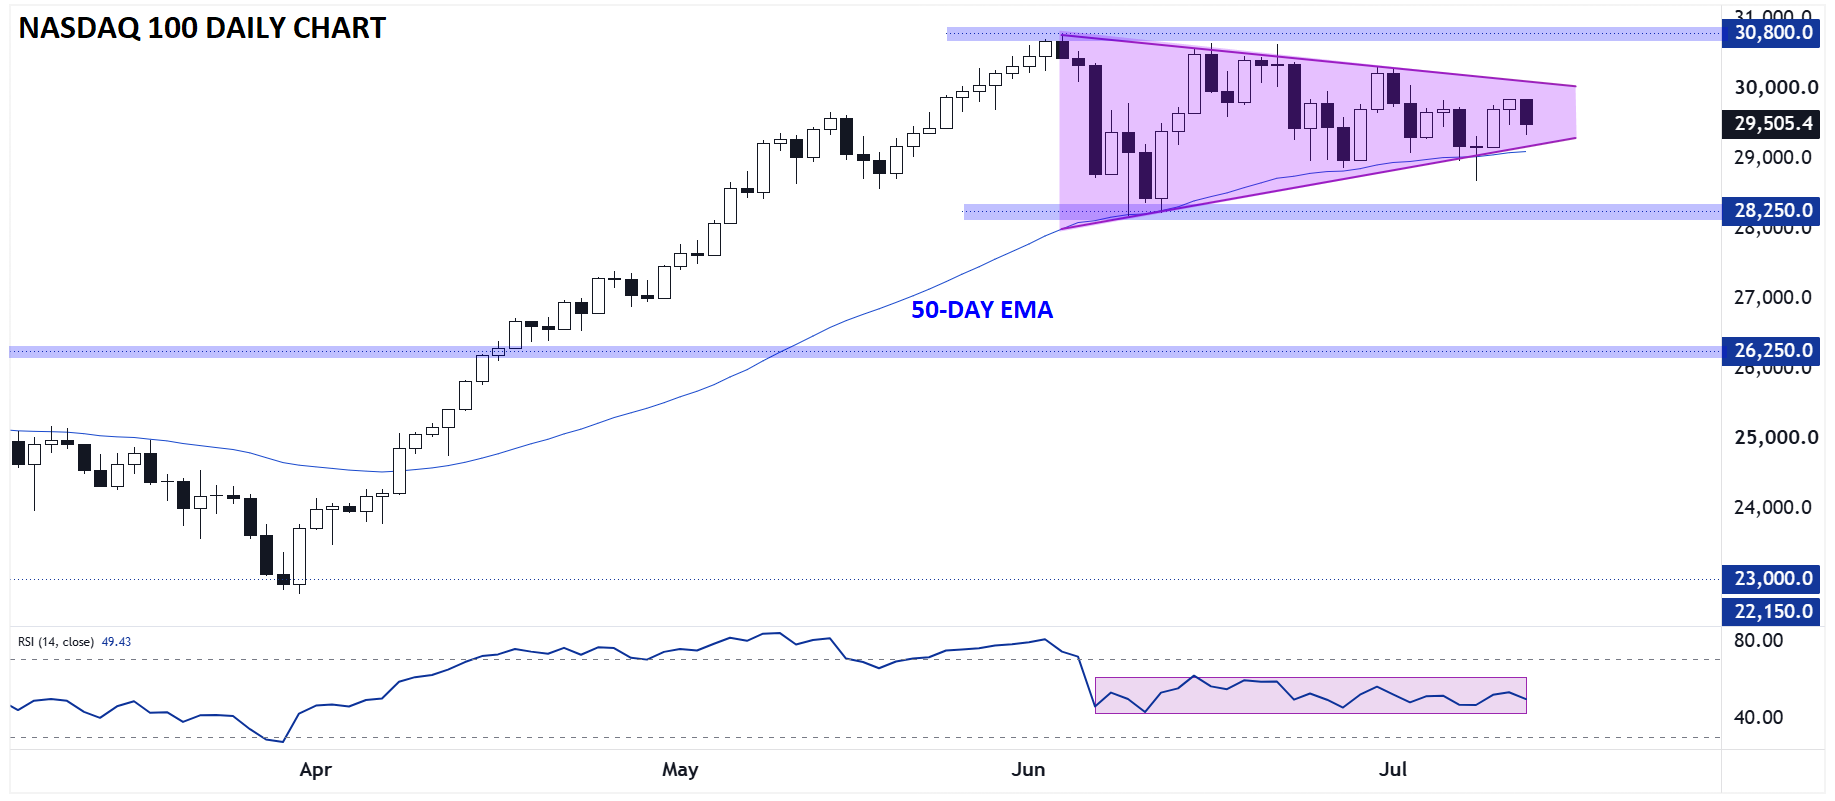
The tech-focused Nasdaq 100 could be one of the bigger movers on the back of the CPI report. From a technical perspective, the index is coiling within an increasingly tight “symmetrical triangle” pattern on the daily chart. For the uninitiated, a common analogy for this pattern is that of a spring being compressed from both the top and the bottom: it builds up potential energy and once one of those pressure points is removed, the spring (the Nasdaq 100 price) is likely to move sharply in that direction.
In other words, the market is poised for a potential higher-volatility breakout heading into one of the most important economic data releases of the month. If we see a topside breakout, in line with the underlying uptrend and rising 50-day EMA, a continuation toward (and potentially through) record highs at 30,800 could be in play later this week, whereas a bearish breakdown could expose the multi-month low at 28,250 in short order.
-- Written by Matt Weller, Global Head of Research
Check out Matt’s Daily Market Update videos on YouTube and be sure to follow Matt on Twitter: @MWellerFX
Latest market news




Open an account in minutes
Experience award-winning platforms with fast and secure execution, and enjoy tight spreads from 0.5 pts on FX and 0.3 pts on indices.
Economic calendar
Web Trader platform
Our sophisticated web-based platform is packed with features.
Related articles
US dollar outlook: Nasdaq breakdown raises stakes for EUR/USD, USD/JPY
A potential Democratic sweep of Congress is adding to the AI trade's headaches, with Nasdaq 100 futures breaking below a major technical level. The implications for the dollar could be significant.
Gold Analysis: Resilient U.S. Labor Market Continues to Pressure XAU/USD
Recent trading sessions have not been particularly favorable for gold in the short term. XAU/USD has fallen nearly 2.5% over the last three sessions, reflecting that selling pressure is once again gaining relevance and that the metal continues to struggle to regain momentum.


Nasdaq 100 forecast: Stocks rebound but AI concerns linger
The Nasdaq 100 was finding some support at 28,000 after recent sell-off amid concerns about the AI trade. Even with oscillators oversold, the risk to the near-term forecast is tilted to the downside.

This report is intended for general circulation only. It should not be construed as a recommendation, or an offer (or solicitation of an offer) to buy or sell any financial products. The information provided does not take into account your specific investment objectives, financial situation or particular needs. Before you act on any recommendation that may be contained in this report, independent advice ought to be sought from a financial adviser regarding the suitability of the investment product, taking into account your specific investment objectives, financial situation or particular needs.
StoneX Financial Pte. Ltd., may distribute reports produced by its respective foreign entities or affiliates within the StoneX group of companies or third parties pursuant to an arrangement under Regulation 32C of the Financial Advisers Regulations. Where the report is distributed to a person in Singapore who is not an accredited investor, expert investor or an institutional investor (as defined in the Securities Futures Act), StoneX Financial Pte. Ltd. accepts legal responsibility to such persons for the contents of the report only to the extent required by law. Singapore recipients should contact StoneX Financial Pte. Ltd. at 6826 9988 for matters arising from, or in connection with the report.
In the case of all other recipients of this report, to the extent permitted by applicable laws and regulations neither StoneX Financial Pte. Ltd. nor its associated companies will be responsible or liable for any loss or damage incurred arising out of, or in connection with, any use of the information contained in this report and all such liability is hereby expressly disclaimed. No representation or warranty is made, express or implied, that the content of this report is complete or accurate.
StoneX Financial Pte. Ltd. is not under any obligation to update this report.
Trading CFDs carries a high level of risk that may not be suitable for some investors. Consider your investment objectives, level of experience, financial resources, risk appetite and other relevant circumstances carefully. The possibility exists that you could lose some or all of your investments, including your initial deposits. If in doubt, please seek independent expert advice. Visit www.forex.com/en-sg/terms-and-policies for the complete Risk Disclosure Statement.